Euler Diagram, usually referred to as Venn diagram, is used to demonstrate both logical and set relationships. In mathematical terms, these are a group of things connected together called as “set”. Not only in mathematics, Venn is broadly used in business presentations too. Use it to showcase the universe of various elements that you are dealing with. Tell your audience how they are interconnected to each other. Illustrate your organization’s objectives, result and value analysis, business, marketing or other mathematical figures using these designs.
The Venn graphic comprises of interlinking circles to geometrically represent how various functions operate individually. Although, thanks to MS PowerPoint 2013, we now have all types of Venn diagram available in Smart Art, yet, undoubtedly to allure more audience, one needs attractive designs for the presentation. Learn to turn your ordinary, boring and colorless Venn to creative and captivating Venn Graphics. Convert your plain text into a visual metaphor.
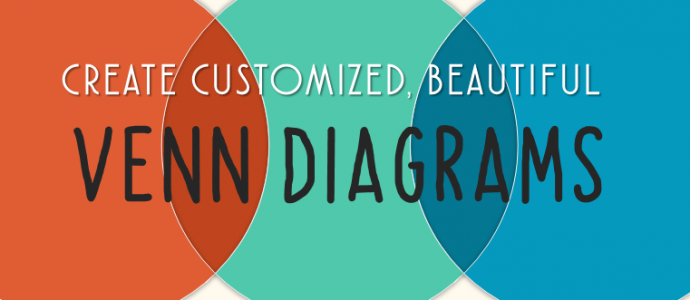
You’ll learn to create this:
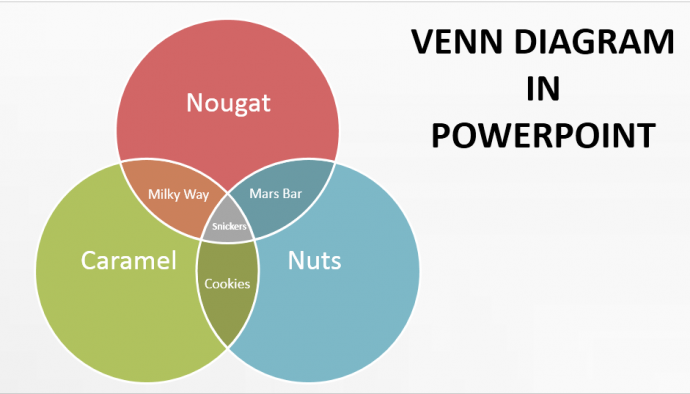
Steps to create a Venn Graphic:
Step 1- Insert the Venn Diagram from SmartArt
Go to the Insert Tab > SmartArt > Relationship > Select the Venn of your choice.
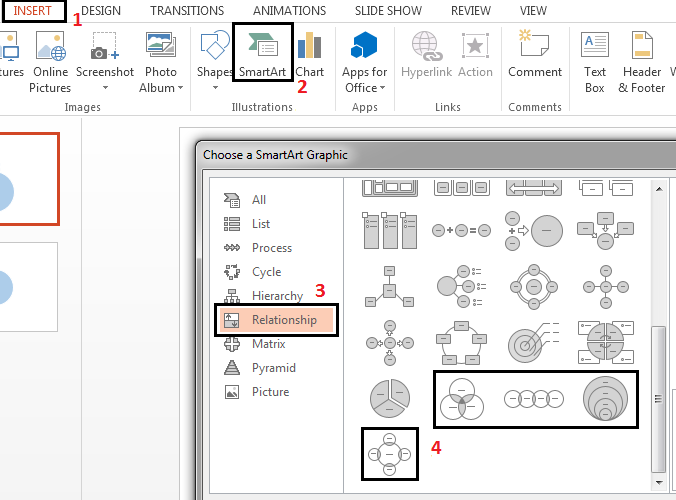
Step 2- Ungroup the Venn Diagram
We are selecting the Basic Venn to demonstrate the steps. However, you can select any Venn diagram option from the SmartArt.
- Select the outer boundary of the Venn and press Shift + CTRL + G keys altogether to ungroup the shape.
- Press Shift + CTRL + G keys again to have all three circles ungrouped (see the screenshot).
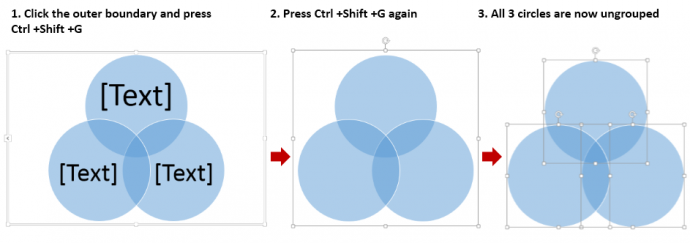
Step 3- Fragment the Circles
Keep your left index finger on the Shift Key and select each circular shape. Next, go to the Format Tab > Merge Shapes > Fragment. All areas of the circles including the intersecting parts will now become a separate object.
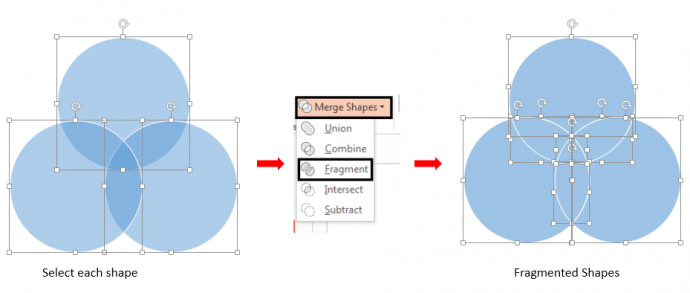
Step 4- Customize Each Shape
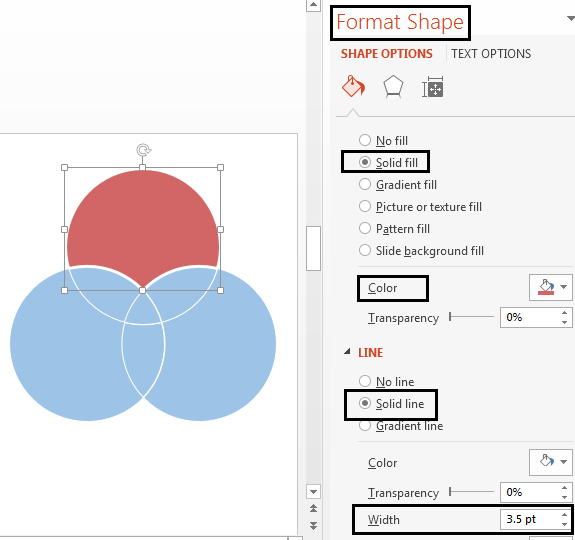
Lastly, select one shape at a time, right click and select Format Shape. The Format Shape window will open on the right side of the screen.
Now, Solid Fill > Color - Opt the color that you desire > Line > Solid Line > Color - White > Width – 3.5 pt. Follow similar steps for the rest of the fragmented shapes.
Note: You can also increase the transparency by 50% in the Fill option. Moreover, select comparatively darker colors for the fragmented shapes, where the original shapes overlapped.
To add text, either just select the shape and type the text, or, go to Insert Tab > Text Box. Place it over the shape and then type. Later, select each shape and text and group them together by pressing Control and G keys.
Your customized, attention-grabbing Venn Diagram is ready. Doesn’t it look so much better than ordinary Venn!
Options in Venn Diagrams:
Option 1- Edit the Number of Shapes
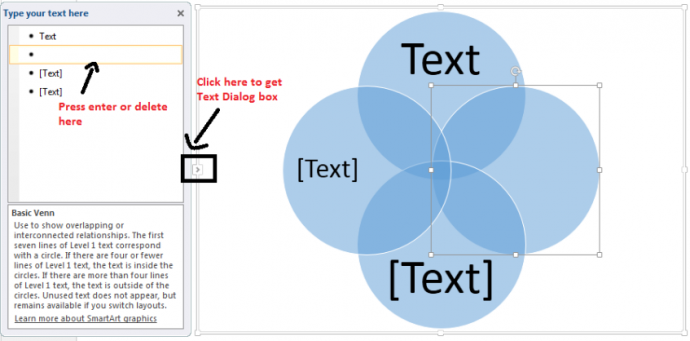
First select the Venn shape -> click the arrow on the left side of the diagram and the text dialog box will open on the left side -> now hit enter or type Text on the text dialog box to add more circular shapes or press delete to reduce the number.
Option 2- Vary Shapes
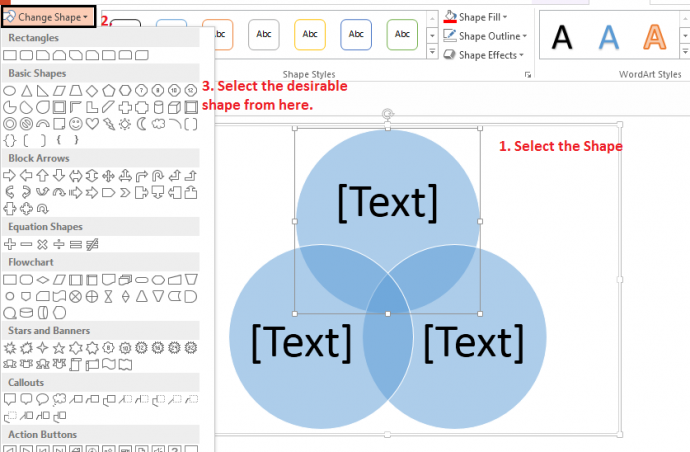
If you want to use other shapes instead of circles, follow these steps and adjust the shape accordingly. Select one circle at the moment, then go to the Format Tab > click on Change Shape and select the shape you desire. (Most of the times, you need not click Format Tab as it by default shows the Format tab menu once you select the shape to be altered.)
Types of Venn Diagrams:
1. Basic Venn – These are the most commonly used Venn diagrams. Display the interconnected relationships among various variables. In this, each variable has at least one thing common to rest of the variables.
 Click here to download this Basic Venn template.
You can browse through our collection of Basic Venn PPT template from here.
2. Stacked Venn – These are used to demonstrate the overlapping relationships. The growth and gradation from the inside shape to outside can be aptly shown using these designs. In this, each successive shape (whether it’s a circle or the one you chose) is enclosed by the previous one.
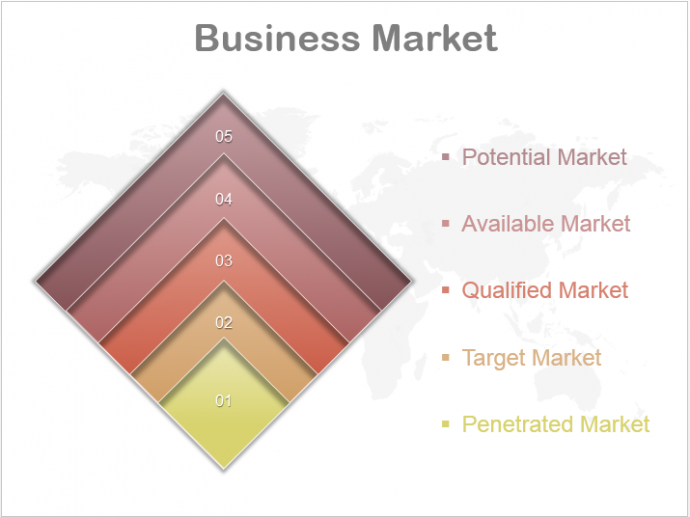 Download this stunning stacked Venn diagram from here.
Browse through our assortment of Stacked Venn Diagram PowerPoint by clicking here.
3. Linear Venn – The sequential overlapping of relationships is represented using these designs. These are applicable in cases where one variable is not interlinked to all the variables.
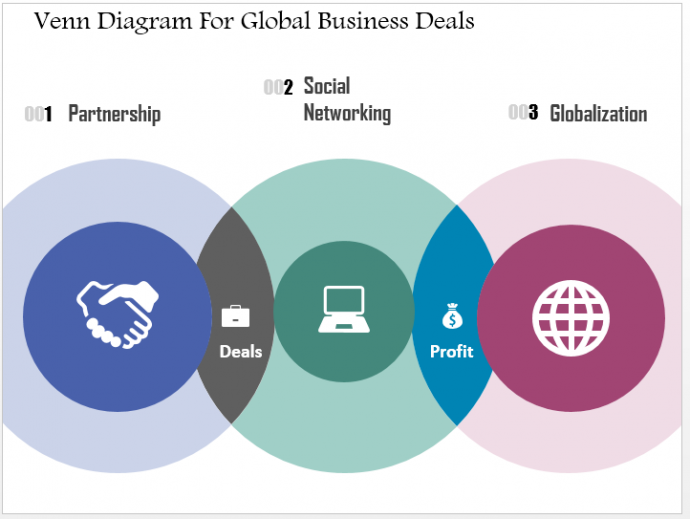 Just click here and go through this Global Business Linear Venn Diagram.
4. Radial Venn - This can be used to show both overlapping relationships and the relationship to a central idea in a cycle.
Click here and download this Radial Venn Diagram Template
Implement these Venn PPT diagrams to illustrate your basic corporate concepts and highlight overlapping processes to arrive at common goals.
Professional Venn Diagram PowerPoint Templates:-
Template Design #1
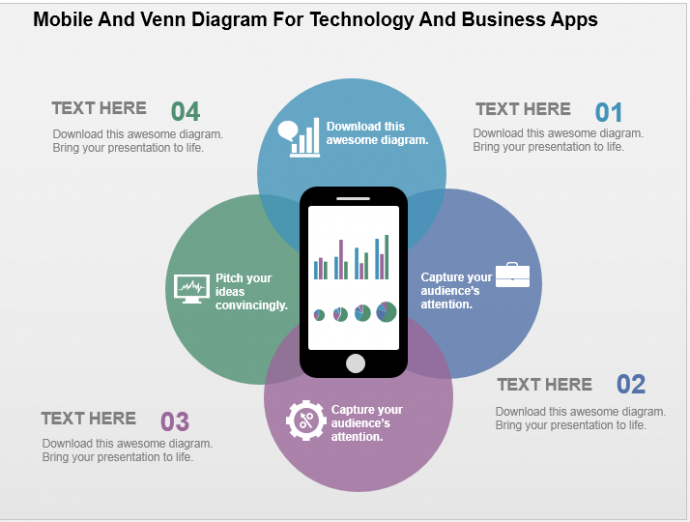 Click here and download this awesome Venn Diagram PowerPoint template.
Template Design #2
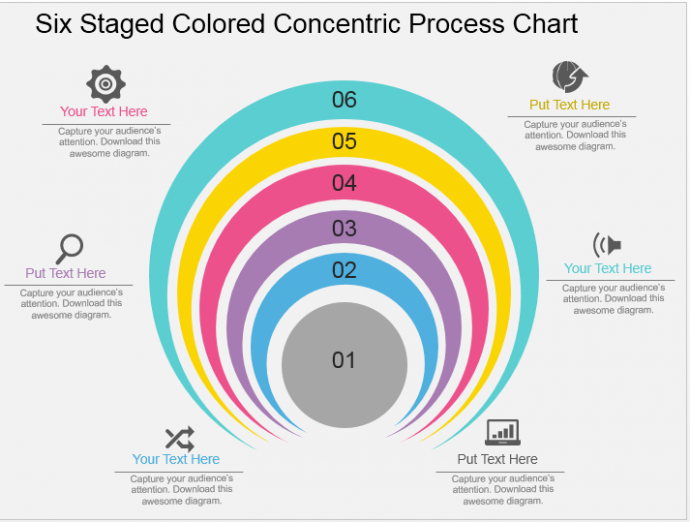 Browse here to download this Concentric Process Chart Venn by clicking here.
Template Design #3
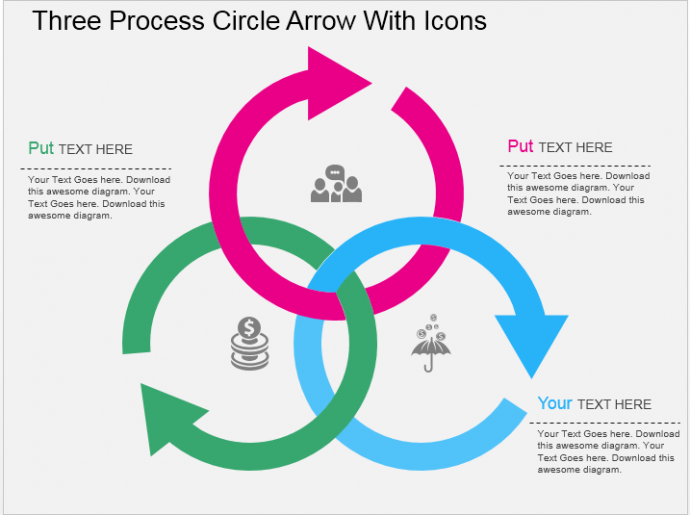 Go through this link to download this Circular Arrow Venn Diagram Slide.
Template Design #4
 Visit here to download this Venn presentation slide from here.
Template Design #5
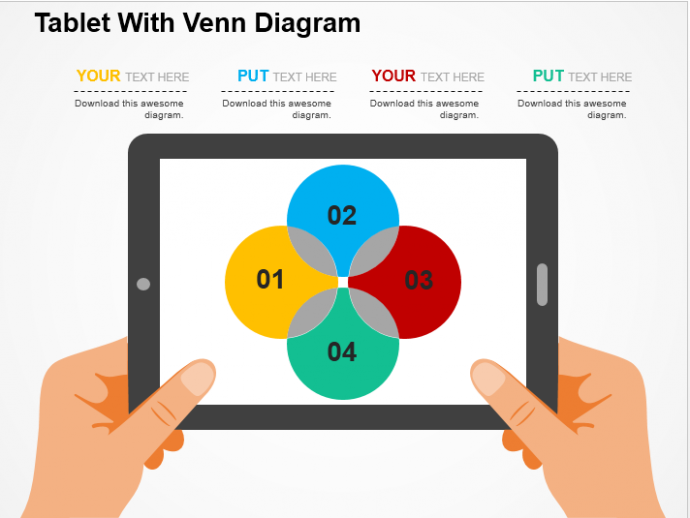 Click and download this Tablet Venn Diagram from here.
Template Design #6
 Browse here to download this Lead Analysis Venn Diagram PPT Template.
How did you like our customized Venn diagrams? Share your feedback in the comments below.




 Customer Reviews



![How to Create a Stunning Circular Flow Chart in PowerPoint [Tutorial #26]](https://www.slideteam.net/wp/wp-content/uploads/2016/10/How-to-Create-Beautiful-Circular-Flow-Diagram-in-PowerPoint-335x146.png)


