All Excel Linked Misc Measuring Graphics Powerpoint Diagram Slide
-
 61920198 style essentials 2 dashboard 6 piece powerpoint presentation diagram infographic slide
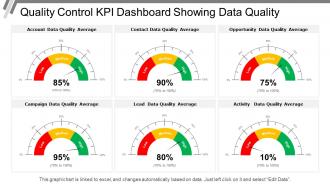
Presenting this set of slides with name - Quality Control Kpi Dashboard Snapshot Showing Data Quality. This is a six stage process. The stages in this process are Quality Management, Quality Control, Quality Assurance.
-
 40599318 style layered horizontal 3 piece powerpoint presentation diagram template slide
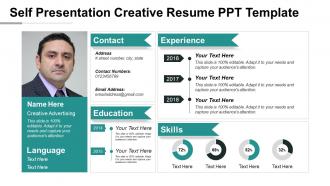
Presenting self-presentation creative resume PPT template PPT slide. The users can comfortably demonstrate their skills, experiences, and capabilities in a clear and vivid style by the use of this high-resolution PPT. Such PPT is of use to an individual during their career analysis at assessment centers. Sometimes the company representatives also use this slide to introduce themselves, their organization and their product and services. PPT is compatible with Google Slides, multiple software and format options. The content is thoroughly editable.
-
 78703420 style essentials 2 dashboard 7 piece powerpoint presentation diagram infographic slide
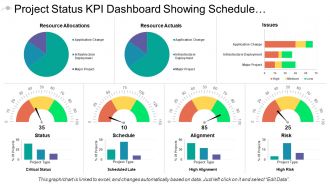
Presenting this set of slides with name - Project Status Kpi Dashboard Showing Schedule And Alignment. This is a seven stage process. The stages in this process are Project Health Card, Project Performance, Project Status.
-
 97426304 style essentials 2 financials 4 piece powerpoint presentation diagram infographic slide
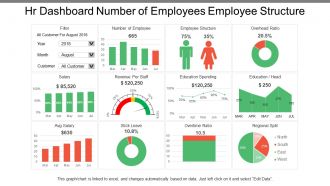
Presenting this set of slides with name - Hr Dashboard Number Of Employees Employee Structure. This is a four stage process. The stages in this process are Hr Dashboard, Human Resource Dashboard, Hr Kpi.
-
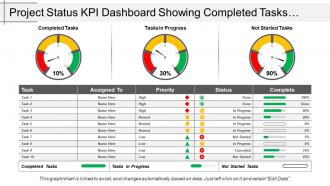 41636764 style essentials 2 dashboard 3 piece powerpoint presentation diagram infographic slide
Presenting, project status kpi dashboard snapshot showing completed tasks and task in progress. This PowerPoint slide can be used by businesses experts for their business performance related presentations. The topics and the similar data shown in the flat design can be easily edited in terms of color, text, and fonts by just by heeding few steps. The color and orientation of the elements can also be changed easily. These PPT slides are cooperative with google slides.
-
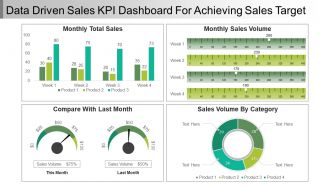 37361776 style essentials 2 financials 4 piece powerpoint presentation diagram infographic slide
This PPT can be downloaded very conveniently on a click of a button. Your business presentation looks very professional with its use. The images used in this PPT template are 100% editable. The color, size and orientation of any icon can easily be changed in this presentation as you wish. The excel-linked chart can be edited as the shapes automatically adjusts according to your data. You can select from thousands of editable icons on each and every topic. Personalize the presentation with individual company name and logo. It can be viewed and saved in JPG or PDF format. It is fully compatible with Google slides as well.
-
 40668413 style essentials 2 dashboard 6 piece powerpoint presentation diagram infographic slide
Introducing, the performance meter gauges PowerPoint Presentation Slide. This Presentation has been designed professionally and is fully editable. You can reshape the font size, font type, colors, and even the background. This Template is amiable with Google Slide and can be saved in JPG or PDF format without any fuss created. Fast download at the click of the button.
-
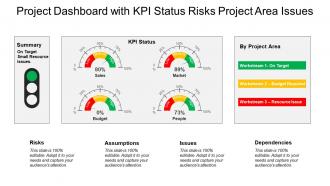 4682803 style essentials 2 dashboard 4 piece powerpoint presentation diagram infographic slide
Presenting this set of slides with name - Project Dashboard Snapshot With Kpi Status Risks Project Area Issues. This is a four stage process. The stages in this process are Project Review, Project Analysis, Project Performance management.
-
 86455950 style essentials 2 financials 5 piece powerpoint presentation diagram infographic slide
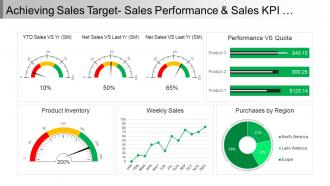
Presenting Achieving Sales Target Sales Performance and Sales KPI Dashboard Snapshot PPT Icon. This presentation includes five stage processes with all the instructions to customize as per your needs and preferences. The stages in this process are sales objectives, sales goal, achieving sales target. You can add your brand’s name, logo or label for that extra impact. The Complete information and Enhanced Visuals are the strongest points of this Sales KPI Dashboard PPT.
-
 73555808 style essentials 2 dashboard 5 piece powerpoint presentation diagram template slide
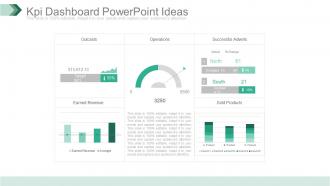
Fabulously composed PPT design useful for business professionals, organizational experts or researchers , students and many more from diverse areas , Comprehensive and convenient PPT Images with ductile dummy data options, Consonant with all available graphic software’s and Google slides, Accessible to other file configurations like PDF or JPG. Multi-color options, background images, styles and other characteristics are fully editable, Expeditious downloading process, Allows to introduce your company logo or brand name in the PPT slides.
-
 1214 multiple meters on dashboard for speed measurement powerpoint slide
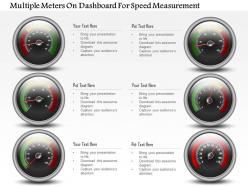
This template with speed meters is convenient to use. You can easily insert or remove any kind of figures or illustrations as per your requirements by simply following the instructions that have been given in the sample slides. The font size, font color and the font style that you use in the slides is 100% editable and can be changed easily as per your needs. You can get these slides in widescreen display with ratio of 16:9 by just a click. You can even upload these slides to Google Slides and they will work automatically. Also you can save the template in JPG or PDF format.
-
 57995178 style essentials 2 our goals 4 piece powerpoint presentation diagram infographic slide
Presenting key human resource metrics dashboard snapshot ppt slide. This is a key human resource metrics dashboard ppt slide. This is a four stage process. The stages in this process are key health metrics, previous 4 quarters, change year over year, voluntary, turnover rate, involuntary, q, registration rate, manager instability rate, top talent turnover rate, top 3 potential areas of concern, for smb services in vancouver, for products in u k, for human resources in denver, key health metrics, previous 4 quarters, change year over year, flow through rate, headcount flow, out, in, span of control, direct compensation change.
-
 48662031 style essentials 2 financials 3 piece powerpoint presentation diagram infographic slide
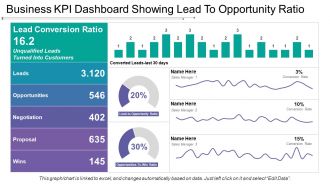
Presenting this set of slides with name - Business Kpi Dashboard Showing Lead To Opportunity Ratio. This is a three stage process. The stages in this process are Business Dashboard, Business Kpi, Business Performance.
-
 65544580 style essentials 2 dashboard 1 piece powerpoint presentation diagram template slide
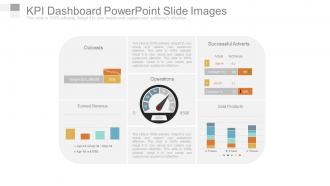
Presenting kpi dashboard powerpoint slide images. This is a kpi dashboard powerpoint slide images. This is a one stage process. The stages in this process are sold products, earned revenue, outcasts, successful adverts, operations, target, compare.
-
 65012062 style essentials 2 dashboard 3 piece powerpoint presentation diagram infographic slide
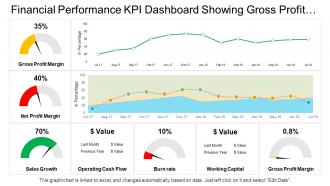
Presenting this set of slides with name - Financial Performance Kpi Dashboard Showing Gross Profit Margin Sales Growth Operating Cash Flow. This is a three stage process. The stages in this process are Financial Performance, Financial Report, Financial Review.
-
 14720730 style essentials 2 dashboard 4 piece powerpoint presentation diagram infographic slide
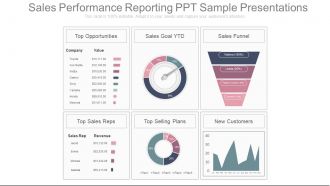
These slides are fully editable to suit your needs. Instantly download any design within a few seconds. Standard and widescreen compatible graphics. Can be opened using Google Slides also. Suitable for use by marketers, sales team, businessmen. Premium customer support service.This is a four stage process. The stages in this process are top opportunities, sales goal ytd, sales funnel, top sales reps, top selling plans, new customers, company, value, sales rep, revenue.
-
 22967863 style essentials 2 financials 4 piece powerpoint presentation diagram infographic slide
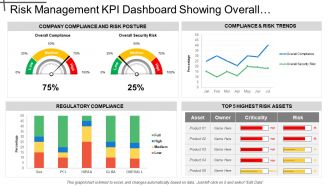
Presenting this set of slides with name - Risk Management Kpi Dashboard Showing Overall Security Risk And Regulatory Compliance. This is a four stage process. The stages in this process are Risk Management, Risk Assessment, Project Risk.
-
 56892716 style essentials 2 financials 3 piece powerpoint presentation diagram infographic slide
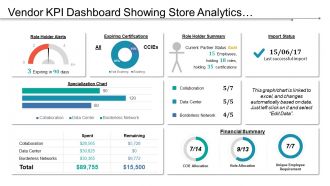
Presenting Vendor KPI Dashboard Showing Role Holder Alerts And Specialization Chart Pictures PPT slide. This presentation design has been professionally designed, is fully editable in PowerPoint and is compatible with Google slides as well. The font type, font size, colors of the diagrams, background color are customizable and the company logo can be added too. High quality graphs, charts, tables and icons ensure that there is no deteriorating in quality on enlarging their size. Fast download at click of a button.
-
 72671910 style essentials 2 financials 6 piece powerpoint presentation diagram infographic slide
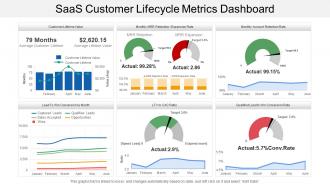
Presenting this set of slides with name - Saas Customer Lifecycle Metrics Dashboard. Highlighting Saas customer lifecycle metrics dashboard PowerPoint presentation. Offer 100% access to change the size and style of the slides once downloaded and saved in the desired format. Beneficial for the business managers, marketing professionals and the strategy designers. Access to convert the presentation design into JPG and PDF. High quality images and visuals used in the designing process. Choice to get presentation slide in standard or in widescreen view. Easy to convert in JPEG and PDF document.
-
 34061117 style essentials 2 dashboard 4 piece powerpoint presentation diagram infographic slide
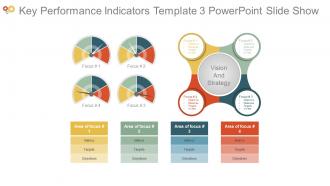
Presenting key performance indicators template 3 powerpoint slide show. Presenting key performance indicators template 3 powerpoint slide show. Presenting key performance indicators template 3 powerpoint slide show. This is a key performance indicators template 3 powerpoint slide show. This is four stage process. The stages in this process are area of focus, metrics, targets, objectives, vision and strategy, objective, measures, targets, invites.
-
 70481860 style essentials 2 financials 3 piece powerpoint presentation diagram infographic slide
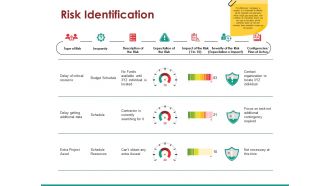
Presenting this set of slides with name - Risk Identification Ppt Examples. This is a three stage process. The stages in this process are Type Of Risk, Jeopardy, Description Of The Risk, Expectation Of The Risk.
-
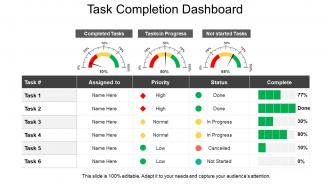 71417966 style essentials 2 dashboard 3 piece powerpoint presentation diagram infographic slide
Presenting Task Completion Dashboard Presentation Examples. It is a professionally designed template with relevant visual content. Get easy access to the customizable slide. You can edit the color, and the font size of the slide. Background and the number of fields can be altered too. The slide is compatible with Google Slides and can be exported in PDF, JPEG or JPG formats. Avail it in standard screen and full-screen size.
-
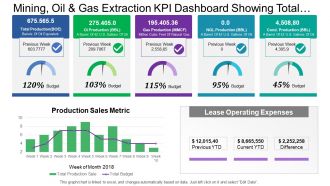 69223260 style essentials 2 financials 3 piece powerpoint presentation diagram infographic slide
Presenting this set of slides with name - Mining Oil And Gas Extraction Kpi Dashboard Showing Total Production And Budget. This is a three stage process. The stages in this process are Mining, Oil And Gas Extraction, Refinery, Natural Gas.
-
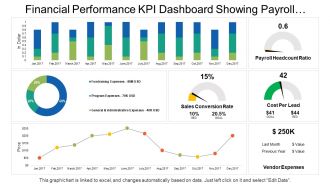 40186317 style essentials 2 financials 7 piece powerpoint presentation diagram infographic slide
Presenting this set of slides with name - Financial Performance Kpi Dashboard Showing Payroll Headcount Ratio Cost Per Lead. This is a seven stage process. The stages in this process are Financial Performance, Financial Report, Financial Review.
-
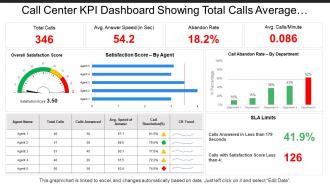 38203634 style essentials 2 financials 5 piece powerpoint presentation diagram infographic slide
Presenting this set of slides with name - Call Center Kpi Dashboard Showing Total Calls Average Answer Speed Abandon Rate. This is a five stage process. The stages in this process are Call Center Agent, Customer Care, Client Support.
-
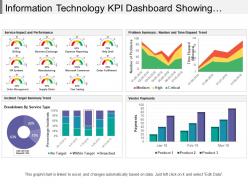 75506128 style essentials 2 financials 5 piece powerpoint presentation diagram infographic slide
Presenting this set of slides with name - Information Technology Kpi Dashboard Showing Incident Target Summary Trend. This is a five stage process. The stages in this process are Information Technology, It, Iot.
-
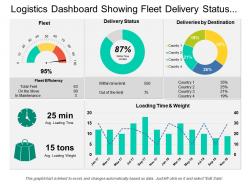 181595 style essentials 2 financials 3 piece powerpoint presentation diagram infographic slide
Presenting this set of slides with name - Logistics Dashboard Showing Fleet Delivery Status And Delivery By Destination. This is a three stage process. The stages in this process are Logistics Dashboard, Logistics Kpis, Logistics Performance.
-
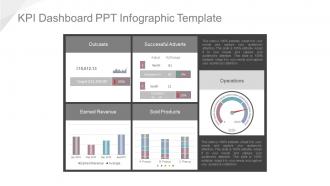 54039612 style essentials 2 dashboard 4 piece powerpoint presentation diagram template slide
Presenting kpi dashboard ppt infographic template. This is a Kpi Dashboard Ppt Infographic Template. This is a four stage. The Stages in this process are outcasts, successful adverts, earned revenue, sold products, operations.
-
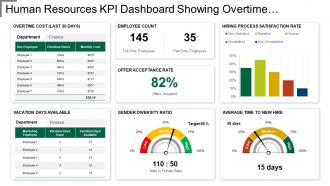 50469508 style essentials 2 financials 6 piece powerpoint presentation diagram infographic slide
Presenting this set of slides with name - Kpi Dashboard Showing Overtime Cost Gender Diversity Ratio. This is a six stage process. The stages in this process are Human Resource, Hrm, Human Capital.
-
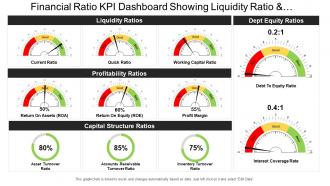 42671253 style essentials 2 dashboard 3 piece powerpoint presentation diagram infographic slide
Presenting this set of slides with name - Financial Ratio Kpi Dashboard Snapshot Showing Liquidity Ratio And Profitability Ratio. This is a three stage process. The stages in this process are Accounting Ratio, Financial Statement, Financial Ratio.
-
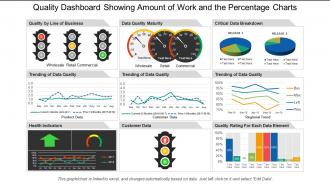 52378135 style essentials 2 financials 3 piece powerpoint presentation diagram infographic slide
SlideTeam feels immense pleasure in presenting to you its 100% customizable and user-friendly quality dashboard snapshot showing customer data with data quality. The business slides can be viewed in widescreen display ratio of 16:9 or standard size display ratio of 4:3 after being downloaded. The PPT presentation lets you insert or remove any given feature from the redesigned set of slides. You can also save the slideshow in format of PDF or JPG and also it is compatible with Google Slides. So hit download, edit it and present it.
-
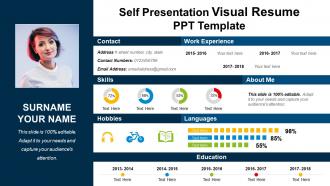 27248579 style layered vertical 4 piece powerpoint presentation diagram infographic slide
Highlighting self presentation visual resume PPT template. Hasty download and easily adapt into JPEG and PDF document. Preferences showcase presentation design in standard and widescreen display view. Availability alters the design with enterprise name, image, icon and picture. High quality PowerPoint layout comes with modification options as color, text and font and other elements can be edited. Presentation PPT template is available with different nodes and stages and can be merged with Google Slides.
-
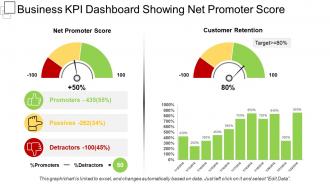 51964122 style essentials 2 financials 2 piece powerpoint presentation diagram infographic slide
Presenting this set of slides with name - Business Kpi Dashboard Snapshot Showing Net Promoter Score. This is a two stage process. The stages in this process are Business Dashboard, Business Kpi, Business Performance.
-
 26578383 style essentials 2 dashboard 4 piece powerpoint presentation diagram infographic slide
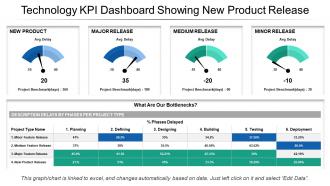
Delivering technology KPI dashboard new product release PowerPoint design. Presentation template goes well with Google slides. PPT slide is adaptable with maximum number of software i.e. JPG and PDF. Great picture quality PowerPoint graphic comes with high resolution picture as pixels never break even on wide screen. Choice includes business information such as name, logo and tagline. Fully amendable Presentation diagram comes with editable options. PPT design is easy to download and save for later use.
-
 19875835 style essentials 2 financials 3 piece powerpoint presentation diagram infographic slide
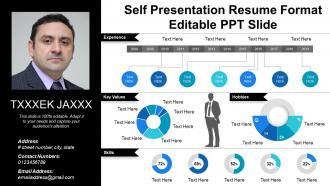
Presenting self presentation resume format editable PPT slide which is thoroughly editable, data driven i.e. excel linked and fast to download. The presenter can customize and personalize this PPT slide it to meet his / her own specifications. This presentation has been designed by plethora of professional expertise. This PowerPoint shape is fully compatible with Google Slides, multiple software and format options. This slideshow can be saved as JPG and / or in PDF. For your kind assistance, editing instructions are also provided.
-
 1214 six staged pie charts for text representation powerpoint slide
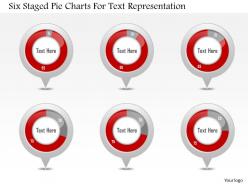
We are proud to present our 1214 six staged pie charts for text representation powerpoint slide. six staged pie charts are used to craft this power point template slide. This PPT slide contains the concept of process analysis. This analysis can be used for business and marketing related presentations.
-
 Speedometer with three text boxes powerpoint slides
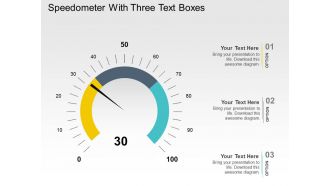
Perfect balance of colors, shapes and stages in relation to presentation topic. High resolution and fine quality PowerPoint slides. Instant download and can be shared easily with large audience. Compatible with Google slides and easily convertible into JPEG and PDF. Guidance for executing the changes has been provided for assistance. Modify and personalize the presentation by including the company name and logo.
-
 32280063 style essentials 2 dashboard 4 piece powerpoint presentation diagram infographic slide
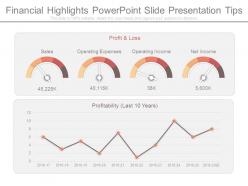
Presenting financial highlights powerpoint slide presentation tips. This is a financial highlights powerpoint slide presentation tips. This is a four stage process. The stages in this process are sales, operating expenses, operating income, net income, profitability.
-
 7937074 style essentials 2 dashboard 5 piece powerpoint presentation diagram infographic slide
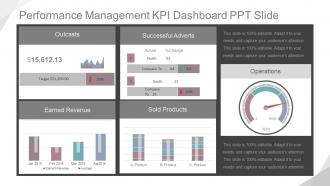
Presenting performance management kpi dashboard snapshot ppt slide. This is a performance management kpi dashboard ppt slide. This is a five stage process. The stages in this process are product, sold products, compare to, south, north, actual, change, successful adverts, jan, feb, mar, apr, earned revenue, average, target, outcasts, operations.
-
 18984594 style essentials 2 financials 4 piece powerpoint presentation diagram infographic slide
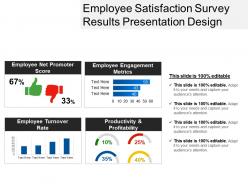
Presenting Employee Satisfaction Survey Results Presentation Design. The slide is completely customizable and can be downloaded in various formats like JPG, PNG, and JPEG. It goes well with the Google Slides and the major Microsoft versions. Also, you are free to change the colors, font type and the font size of the slide. The background of the template can also be altered. The template can be viewed on two screen sizes i.e. standard screen (4:3) and widescreen (16:9).
-
 88663825 style essentials 2 financials 3 piece powerpoint presentation diagram infographic slide
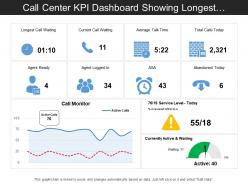
Presenting this set of slides with name - Call Center Kpi Dashboard Showing Longest Call Waiting And Average Talk Time. This is a three stage process. The stages in this process are Call Center Agent, Customer Care, Client Support.
-
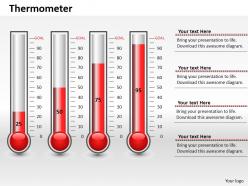 0414 business growth thermometer chart powerpoint graph
Thoroughly editable predesigned slides. Ease of inclusion and exclusion of content as per the need. Compatibility with number of online and offline software options. Compatibility with numerous format options. Impressive image quality. The visuals do not deter in quality when projected on wide screen. Freedom to personalize the content with company name and logo. Used by marketers, professionals of various departments, students and educators.
-
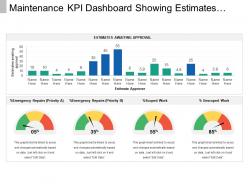 19463766 style essentials 2 financials 2 piece powerpoint presentation diagram infographic slide
Presenting maintenance KPI dashboard snapshot showing estimates awaiting approval PPT slide. This layout is fully compatible with Google slides and data driven. User can edit the data in linked excel sheet and the design will change accordingly. Easy to put in company logo, trademark or name; accommodate words to support the key points. Images do no distort out even when they are projected on large screen. Adjust colors, text and fonts as per your business requirements.
-
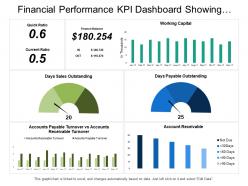 47966171 style essentials 2 dashboard 3 piece powerpoint presentation diagram infographic slide
Presenting this set of slides with name - Financial Performance Kpi Dashboard Showing Quick Ratio Current Ratio Working Capital. This is a three stage process. The stages in this process are Financial Performance, Financial Report, Financial Review.
-
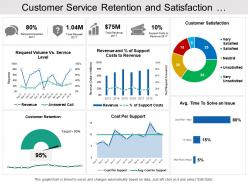 83477491 style essentials 2 financials 6 piece powerpoint presentation diagram infographic slide
Presenting this set of slides with name - Customer Service Retention And Satisfaction Dashboard. This is a six stage process. The stages in this process are Customer Base, Recurring Customers, Customer Services.
-
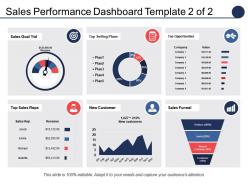 81906914 style essentials 2 financials 6 piece powerpoint presentation diagram infographic slide
Presenting sales performance dashboard top selling plans top opportunities PPT template. Completely amendable by any user at any point of time without any hassles. Error free performance to put an everlasting impression on the viewers. Great for incorporating business details such as name, logo and trademark. Can be utilized by students, entrepreneurs, investors and customers. Professionally designed presentation slides. Personalize the presentation with individual company name and logo. Available in both Standard and Widescreen slide size.
-
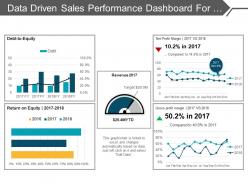 12592497 style essentials 2 financials 5 piece powerpoint presentation diagram infographic slide
Presenting a PPT slide named Data driven sales performance dashboard for achieving sales target PPT slides. This PPT slide is Excel driven and easily customizable. The font style, the font color and the font size can be easily edited by a mere click. Access this presentation easily anywhere as it is compatible with Google slides. You can convert and save this slide in PDF or JPG formats. Add or delete content from the given slide as per your convenience. You can add icons to make it more impressive. You can choose from thousands of high quality icons. Download and enjoy the professionally designed PPT slide.
-
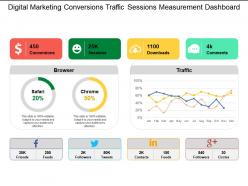 38580188 style essentials 2 financials 4 piece powerpoint presentation diagram infographic slide
Presenting digital marketing conversions traffic sessions measurement dashboard. This is a digital marketing conversions traffic sessions measurement dashboard. This is a four stage process. The stages in this process are digital marketing, digital marketing dashboard, digital marketing funnel.
-
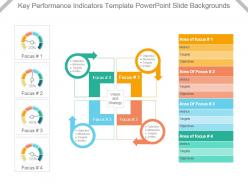 19902345 style essentials 2 dashboard 4 piece powerpoint presentation diagram infographic slide
Excellent use colors in the presentation template. Imaginatively created PowerPoint shape with modification options. Easily adjustable PPT slide as can be converted into JPG and PDF format. Conforming designs accessible to different nodes and stages. Great pixel quality as image quality remains relentless on every screen size. Choice to reveal slide in standard 4:3 widescreen 16:9 view. Presentation graphic suitable with Google slides. Fast download saves valuable time. Makes it easier to share the information with ease with large set of viewers. Easy to portray the KRAs related to the work.
-
 90155534 style division donut 4 piece powerpoint presentation diagram infographic slide
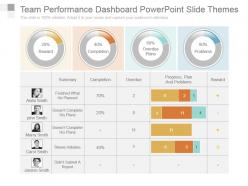
Presenting team performance dashboard powerpoint slide themes. This is a team performance dashboard powerpoint slide themes. This is a four stage process. The stages in this process are summary, completion, overdue, progress, plan and problems, reward, finished what he planned, doesnt complete his plans, doesnt complete his plans, shows initiative, didnt submit a report.
-
 58325568 style essentials 2 financials 5 piece powerpoint presentation diagram infographic slide
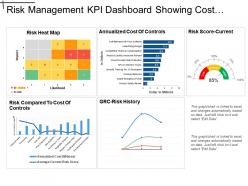
Presenting this set of slides with name - Risk Management Kpi Dashboard Showing Cost Of Control And Risk Score. This is a five stage process. The stages in this process are Risk Management, Risk Assessment, Project Risk.
-
 29988062 style essentials 2 financials 4 piece powerpoint presentation diagram infographic slide
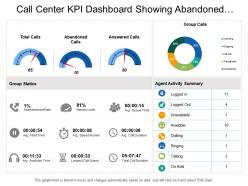
Presenting this set of slides with name - Call Center Kpi Dashboard Showing Abandoned Calls Group Calls Group Statistics. This is a four stage process. The stages in this process are Call Center Agent, Customer Care, Client Support.
-
 14053825 style essentials 2 financials 4 piece powerpoint presentation diagram infographic slide
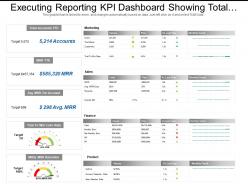
Presenting this set of slides with name - Executing Reporting Kpi Dashboard Showing Total Accounts Marketing Sales Finance. This is a four stage process. The stages in this process are Executive Reporting, Executive Analysis, Executive Performance.
-
 83427113 style essentials 2 dashboard 4 piece powerpoint presentation diagram infographic slide
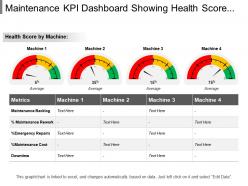
Presenting maintenance KPI dashboard showing health score by machine PowerPoint slide. This PPT slide offers you plenty of space to put in titles and sub titles. High resolution based presentation layout, does not change the image even after resizing. This presentation icon is fully compatible with Google slides. Quickly downloads and simple editing options in color text and fonts. Can easily be changed into JPEG and PDF applications. This diagram has been designed for entrepreneurs, corporate and business managers.
-
 34427863 style essentials 2 financials 4 piece powerpoint presentation diagram infographic slide
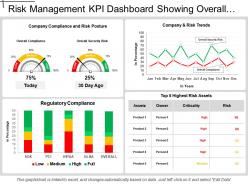
Presenting this set of slides with name - Compliance And Legal Kpi Dashboard Showing Regulatory Compliance. This is a four stage process. The stages in this process are Compliance And Legal, Legal Governance, Risk Management.
-
 0514 3d graphic of dollar bag powerpoint slides
The PPT images offer compatibility with Google templates. High resolution icons for clear message delivery. An easy access to make the desired changes or edit it anyways. Wide screen view of the slides. Easy conversion into JPG or PDF format. Unique and informational content. Valuable for business professionals, sales representatives, marketing professionals and finance managers.
-
 56884969 style essentials 2 dashboard 4 piece powerpoint presentation diagram template slide
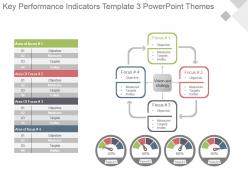
Presenting key performance indicators template 3 powerpoint themes. This is a key performance indicators template 3 powerpoint themes. This is a four stage process. The stages in this process are objective, measures, targets, invites.
-
 70094834 style essentials 2 financials 5 piece powerpoint presentation diagram infographic slide
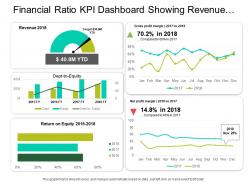
Presenting this set of slides with name - Financial Ratio Kpi Dashboard Showing Revenue Net Profit Margin And Debt To Equity. This is a five stage process. The stages in this process are Accounting Ratio, Financial Statement, Financial Ratio.
-
 46807333 style essentials 2 financials 6 piece powerpoint presentation diagram infographic slide
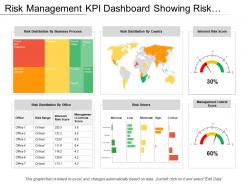
Presenting this set of slides with name - Risk Management Kpi Dashboard Showing Risk Distribution By Country Office And Business Process. This is a six stage process. The stages in this process are Risk Management, Risk Assessment, Project Risk.
-
 99854468 style essentials 2 dashboard 3 piece powerpoint presentation diagram infographic slide
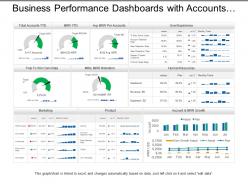
Presenting, our business performance dashboards snapshot with accounts and mr growth PPT layout. High pixel resolution of the designs. Easy to edit and save using google slides. 100% modification of the slides granted. Apply your company name, replacing the official trademark in the slides. Valuable for the Marketing Professionals, business managers, and the directors. Includes extensive text spaces to include a title and can be easily projected to a widescreen.


