Interactive Charts & Graphs PowerPoint Slides
-
 43839871 style essentials 2 financials 3 piece powerpoint presentation diagram template slide
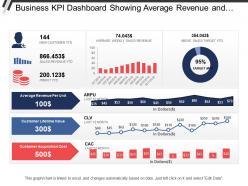
Presenting this set of slides with name - Business Kpi Dashboard Showing Average Revenue And Clv. This is a three stage process. The stages in this process are Business Dashboard, Business Kpi, Business Performance.
-
 Project Issue Tracking KPI Dashboard
This slide illustrates the dashboard for the project issue tracking and management. It includes the column chart for issues assignee, incomplete issues by priority and project, monthly percentage increase in issues created and closed, etc. Presenting our well structured Project Issue Tracking KPI Dashboard. The topics discussed in this slide are Project Issue Tracking, KPI Dashboard, Issue Status. This is an instantly available PowerPoint presentation that can be edited conveniently. Download it right away and captivate your audience.
-
 Conducting Successful Customer Dashboard For Analysing Aftersales Customer Satisfaction Kpis
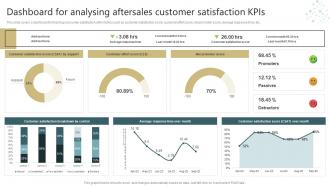
This slide covers a dashboard for tracking consumer satisfaction with metrics such as customer satisfaction score, customer effort score, net promoter score, average response time, etc. Present the topic in a bit more detail with this Conducting Successful Customer Dashboard For Analysing Aftersales Customer Satisfaction Kpis. Use it as a tool for discussion and navigation on Satisfaction, Response, Promoter. This template is free to edit as deemed fit for your organization. Therefore download it now.
-
 64576991 style essentials 2 financials 5 piece powerpoint presentation diagram infographic slide
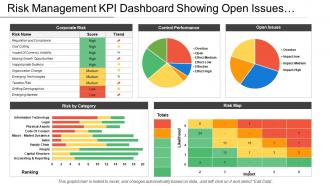
Presenting this set of slides with name - Risk Management Kpi Dashboard Showing Open Issues And Control Performance. This is a five stage process. The stages in this process are Risk Management, Risk Assessment, Project Risk.
-
 98633483 style essentials 2 financials 6 piece powerpoint presentation diagram infographic slide
Presentation graphic is totally compatible with Google slides. Multiple display options i.e. standard and widescreen. 100 percent editable designs to show your creativity. Similar designs available with different nodes and stages. Easy to download and convert into JPEG or PDF format. Alteration can be done in color, text and shape. Pre-designed PPT slide just download and insert it in the presentation. Quick download with easy to save. Choice to add company logo and replace text as required. High resolution quality ensures no pixilation.
-
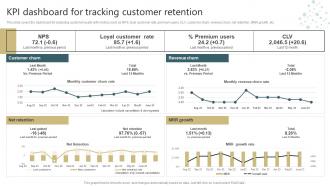 Conducting Successful Customer Kpi Dashboard For Tracking Customer Retention
This slide covers the dashboard for analyzing customer loyalty with metrics such as NPS, loyal customer rate, premium users, CLV, customer churn, revenue churn, net retention, MRR growth, etc. Deliver an outstanding presentation on the topic using this Conducting Successful Customer Kpi Dashboard For Tracking Customer Retention. Dispense information and present a thorough explanation of Rate, Premium Users using the slides given. This template can be altered and personalized to fit your needs. It is also available for immediate download. So grab it now.
-
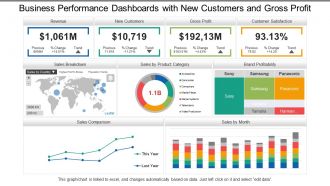 28908029 style concepts 1 growth 3 piece powerpoint presentation diagram infographic slide
Presenting, business performance dashboards Snapshot with new customers and gross profit PowerPoint ideas for your ease. Information based slides, creating an impact on the viewer, can be used by specialists from any background, entrepreneurs, and scholars. Engaging and editable font style, type, text design and the content of the icons or the PPT slides. Full-screen view choice available and can be transformed into the desired format. Compatible with Google Slides. Open in widescreen size 16:9 after downloading.
-
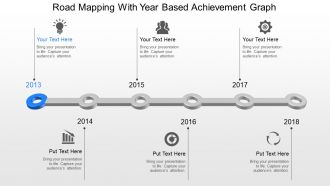 71584580 style essentials 1 agenda 6 piece powerpoint presentation diagram infographic slide
Presenting rm road mapping with year-based achievement graph PowerPoint template. Plentiful color choices, briskness and effects. Text and graphics can be placed on the slide. PPT diagram is 100% compatible with Google slide. Freely edit the icons, color, size and orientation. Supports to work offline and later upload the changes. Businessmen, stock market, sales and management professionals can put to use the presentation slide show.
-
 3d man holding big lens finding business solution ppt graphic icon
High resolution PPT slides addressing business solutions in depth. Modifiable background with color, font and layout. Authentic and relevant content with flexible data. Can be easily converted into JPG or PDF format. Beautiful 3D man holding big lens PowerPoint info graphics with alluring graph for comparison and fascinating figures to illustrate the concept. Benefitted for students, researchers and business professionals.
-
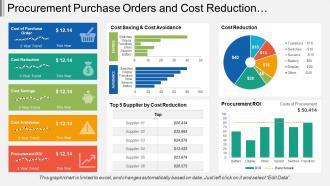 35237686 style essentials 2 financials 5 piece powerpoint presentation diagram infographic slide
Presenting this set of slides with name - Procurement Purchase Orders And Cost Reduction Dashboard. This is a five stage process. The stages in this process are Purchase, Procurement, Buy.
-
 24917127 style linear single 5 piece powerpoint presentation diagram infographic slide
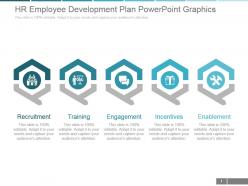
Presenting hr employee development plan powerpoint graphics. This is a hr employee development plan powerpoint graphics. This is a five stage process. The stages in this process are recruitment, training, engagement, incentives, enablement.
-
 65497465 style layered vertical 2 piece powerpoint presentation diagram infographic slide
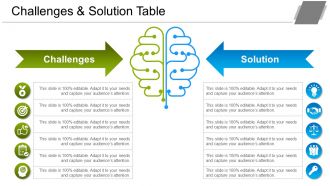
Presenting Challenges And Solution Table PowerPoint Graphics which is 100% editable. Use high-quality icons and make your presentation more descriptive. The template is adaptable with Google Slides which makes it accessible at once. Can be changed into formats like PDF, JPG, and PNG. Alter the color, fonts, font size, and font types of the template as per the requirements. The slide is readily available in both 4:3 and 16:9 aspect ratio.
-
 83341464 style essentials 1 roadmap 5 piece powerpoint presentation diagram infographic slide
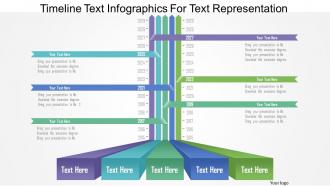
Fully compatible with Google slides and other commonly used softwares. Useful for every single company who maintains a timeline of events. High quality graphics retain excellent quality on bigger and wider screens. No pixilation. Slide is changeable into common formats like PDF or JPEG. Add company logo or trade name to prevent plagiarism. Customisable color schemes and option to change font sizes.
-
 94726624 style essentials 1 roadmap 6 piece powerpoint presentation diagram infographic slide
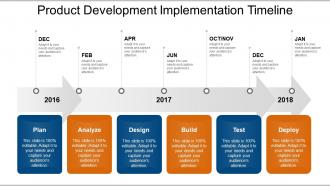
Presenting product development implementation timeline powerpoint graphics. This is a product development implementation timeline powerpoint graphics. This is a six stage process. The stages in this process are implementation timeline, timeline, roadmap.
-
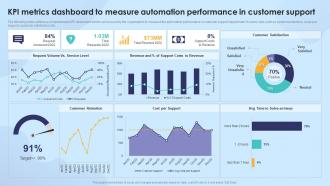 Strengthening Process Improvement KPI Metrics Dashboard To Measure Automation Performance
The following slide outlines a comprehensive KPI dashboard which can be used by the organization to measure the automation performance in customer support department. It covers kpis such as customer retention, costs per support, customer satisfaction, etc. Present the topic in a bit more detail with this Strengthening Process Improvement KPI Metrics Dashboard To Measure Automation Performance. Use it as a tool for discussion and navigation on Request Volume Vs Service Level, Customer Satisfaction, Cost Per Support, Customer Retention. This template is free to edit as deemed fit for your organization. Therefore download it now.
-
 10548866 style essentials 1 location 4 piece powerpoint presentation diagram infographic slide
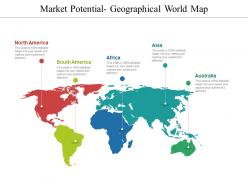
Presenting market potential geographical world map presentation ideas. This is a market potential geographical world map presentation ideas. This is a four stage process. The stages in this process are market overview, market assessments, market potential .
-
 61920198 style essentials 2 dashboard 6 piece powerpoint presentation diagram infographic slide
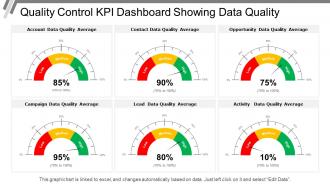
Presenting this set of slides with name - Quality Control Kpi Dashboard Snapshot Showing Data Quality. This is a six stage process. The stages in this process are Quality Management, Quality Control, Quality Assurance.
-
 91422851 style essentials 1 agenda 5 piece powerpoint presentation diagram infographic slide
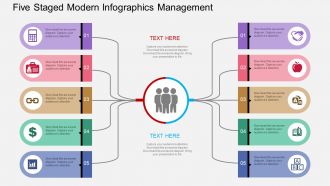
It contains complete set of high resolution ppt slides to address management and business related concept. Content is relevant and flexible. It can easily be converted to JPG and PDF format. Editable background with color, layout and font. Beneficial for business professional, students and researchers. Appealing graphs for comparison and fabulous figure to illustrate the concept.
-
 9152845 style division donut 2 piece powerpoint presentation diagram infographic slide
Presenting, meet our team representing in a circular format PPT design. This PPT slide contains visually engaging PPT presentation diagrams, which are loaded with incomparable benefits and can be utilized for displaying your team. Change the colors schemes used here, include your employee images and personalize. This design can be personalized by appending company trademark, logo, brand, symbols. Well-arranged patterns to avoid any confusion or uncertainty. These PPT slides can be instantly downloaded with just a click
-
 69714134 style hierarchy matrix 8 piece powerpoint presentation diagram template slide
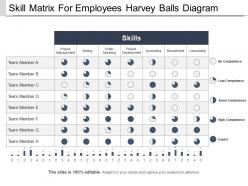
Presenting this set of slides with name- Skill Matrix for employees Harvey Balls Diagram PPT Background. Get easy access to this customizable template. You can change the color, text and font size as per your need. You can add or delete the content wherever required. Its compatibility with Google Slides makes it readily available. The PPT slide is available both in standard as well widescreen size. Convert and save this PPT slide in both PDF and JPG format.
-
 78703420 style essentials 2 dashboard 7 piece powerpoint presentation diagram infographic slide
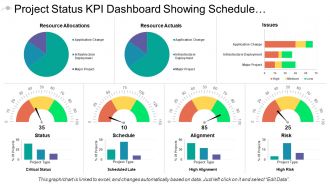
Presenting this set of slides with name - Project Status Kpi Dashboard Showing Schedule And Alignment. This is a seven stage process. The stages in this process are Project Health Card, Project Performance, Project Status.
-
 Bar graphs and histograms success powerpoint templates themes
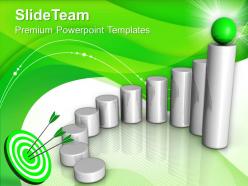
We are proud to present our bar graphs and histograms success powerpoint templates themes. Our bar graphs and histograms success PowerPoint templates themes will provide weight to your words. They will bring out the depth of your thought process. Words like arrows fly straight and true. Use our bar graphs and histograms success PowerPoint templates themes to make them hit bulls eye every time.
-
 97426304 style essentials 2 financials 4 piece powerpoint presentation diagram infographic slide
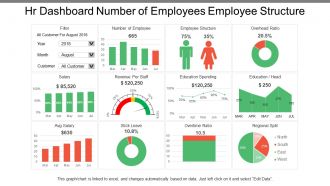
Presenting this set of slides with name - Hr Dashboard Number Of Employees Employee Structure. This is a four stage process. The stages in this process are Hr Dashboard, Human Resource Dashboard, Hr Kpi.
-
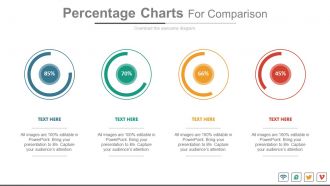 36490308 style essentials 2 compare 4 piece powerpoint presentation diagram infographic slide
The slides are equipped with superior resolution. Modify the slide outlook by changing the colors, size, and placement of graphics. The option of easy downloading is accompanied with the convenient saving of the template in multiple formats. Play the Ppt template in Google slides anytime anywhere. Remove the Slide-Team's watermark after completing the downloading process. Utilize the ample space for the content addition.
-
 Stack of dollar coins rising graph to dos ppt icons graphics
This PPT slide is a reliable way to present your company's financial matters and its practice related ideas. Engaging figures shown in this template can be resized and their colors can be changed according to your liking. Downloading this slide will give you access to its full version. You can be easily convert it into PDF or JPG formats.
-
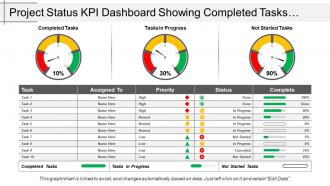 41636764 style essentials 2 dashboard 3 piece powerpoint presentation diagram infographic slide
Presenting, project status kpi dashboard snapshot showing completed tasks and task in progress. This PowerPoint slide can be used by businesses experts for their business performance related presentations. The topics and the similar data shown in the flat design can be easily edited in terms of color, text, and fonts by just by heeding few steps. The color and orientation of the elements can also be changed easily. These PPT slides are cooperative with google slides.
-
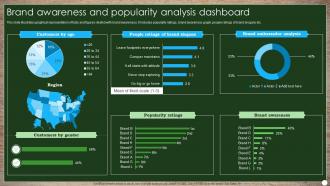 Brand Awareness And Popularity Analysis Dashboard
This slide illustrates graphical representation of facts and figures related with brand awareness. It includes popularity ratings, brand awareness graph, people ratings of brand slogans etc. Introducing our Brand Awareness And Popularity Analysis Dashboard set of slides. The topics discussed in these slides are Customers By Gender, Popularity Ratings, Brand Awareness. This is an immediately available PowerPoint presentation that can be conveniently customized. Download it and convince your audience.
-
 53408694 style essentials 2 financials 4 piece powerpoint presentation diagram infographic slide
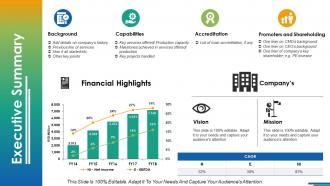
This is a four stage process. The stages in this process are Background, Capabilities, Accreditation, Vision, Mission.
-
 Notepad partnership introduction bar graph ppt icons graphics
All graphics are hundred percent adaptable in the layout slides. Great quality pictures can be used to compliment message. Functions outstandingly in Windows 7, 8, 10, XP, Vista and all PowerPoint form. Altering in presentation slide show ought to be conceivable from wherever by any device. Similarity with Google slides. PPT sensible offers content measurement which can be examined from a division.
-
 14837843 style circular loop 6 piece powerpoint presentation diagram infographic slide
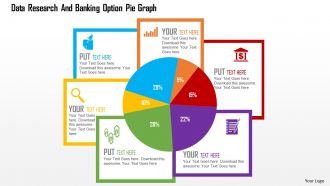
Exclusive patterns and graphics which are inspired by the current trends to impress the audience. Versatile and multipurpose PPT presentation diagram. Creates transparency of business processes. Enables better understanding and memorising the information displayed. Runs smoothly with all software’s. Compatible with Google framework. 100% amendable icons and images.
-
 47865712 style essentials 2 financials 4 piece powerpoint presentation diagram infographic slide
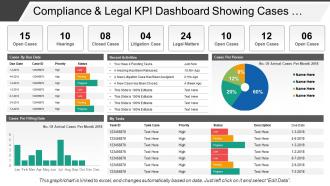
Presenting this set of slides with name - Compliance And Legal Kpi Dashboard Showing Cases By Due Date. This is a four stage process. The stages in this process are Compliance And Legal, Legal Governance, Risk Management.
-
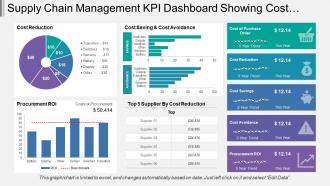 62107827 style essentials 2 financials 5 piece powerpoint presentation diagram infographic slide
Presenting this set of slides with name - Supply Chain Management Kpi Dashboard Showing Cost Reduction And Procurement Roi. This is a five stage process. The stages in this process are Demand Forecasting, Predicting Future Demand, Supply Chain Management.
-
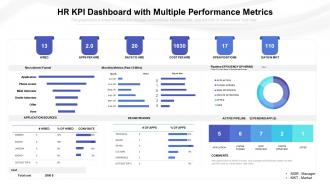 Hr kpi dashboard with multiple performance metrics
Presenting HR KPI Dashboard With Multiple Performance Metrics PPT template. This is a customized slide and can be edited as per your requirements. You can add texts, images, graphics, and infographics. The template supports Google Slides as well. Perfectly ideal for all types of screen, be it small or big.
-
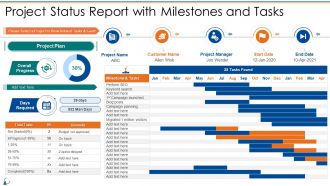 Project Status Report With Milestones And Tasks Communication Management Bundle
Deliver an outstanding presentation on the topic using this Project Status Report With Milestones And Tasks Communication Management Bundle. Dispense information and present a thorough explanation of Project Status Report With Milestones And Tasks using the slides given. This template can be altered and personalized to fit your needs. It is also available for immediate download. So grab it now.
-
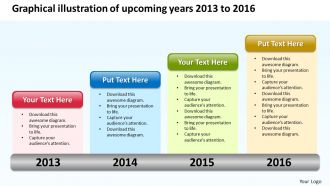 Product roadmap timeline graphical illustration of upcoming years 2013 to 2016 powerpoint templates slides
This timeline graph designed deck of slides is fully favorable for professionals, all you have to do is just download it and edit the text used in it. The font size, font style and font color is also customizable and you make changes to it according to your own requirements. You can also add or remove any kind of graphical illustration that is used in this slideshow depicting the product roadmap. This template can be saved in PDF or JPG format easily. When you download this graphical illustration, you get both widescreen i.e. ratio of 16:9 and standard screen i.e. ratio of 4:3 PPT files.
-
 23296329 style essentials 2 financials 3 piece powerpoint presentation diagram infographic slide
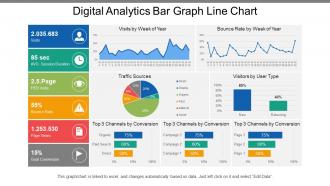
Presenting this set of slides with name - Digital Analytics Bar Graph Line Chart. This is a five stage process. The stages in this process are Digital Analytics, Digital Dashboard, Digital Kpis.
-
 1430875 style concepts 1 growth 5 piece powerpoint presentation diagram infographic slide
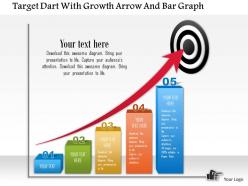
The slides are equipped with the superior quality resolution to give you the best experience of visual play. The affinity of the slide with Google slides and other software options is it's another attractive feature. Customize endlessly with colour, grouping and orientation arrangement. The option to download the template extends to file format of JPG and PDF.
-
 Multiple project management dashboard with risks and issues status
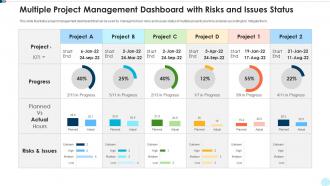
Presenting our well structured Multiple Project Management Dashboard With Risks And Issues Status. The topics discussed in this slide are MSP Framework For Risk And Issue Management. This is an instantly available PowerPoint presentation that can be edited conveniently. Download it right away and captivate your audience.
-
 59319654 style essentials 1 roadmap 6 piece powerpoint presentation diagram infographic slide
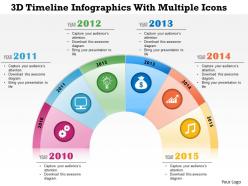
Easy access to convert the slide into JPEG and PDF document. Presentation design comes in standard and widescreen view. PowerPoint slide created with high quality resolution design. 100% editable Presentation design as can be edited with ease. Downloadable with different nodes and stages. Download is quick and can be easily inserted in the presentation. Suitable for event managers, project managers, business leaders.
-
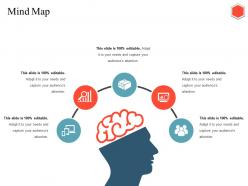 95310769 style hierarchy mind-map 5 piece powerpoint presentation diagram infographic slide
Presenting this set of slides with name - Mind Map Ppt Infographics. This is a five stage process. The stages in this process are.
-
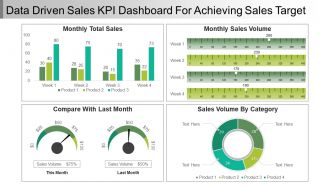 37361776 style essentials 2 financials 4 piece powerpoint presentation diagram infographic slide
This PPT can be downloaded very conveniently on a click of a button. Your business presentation looks very professional with its use. The images used in this PPT template are 100% editable. The color, size and orientation of any icon can easily be changed in this presentation as you wish. The excel-linked chart can be edited as the shapes automatically adjusts according to your data. You can select from thousands of editable icons on each and every topic. Personalize the presentation with individual company name and logo. It can be viewed and saved in JPG or PDF format. It is fully compatible with Google slides as well.
-
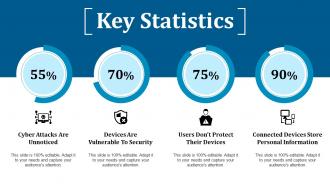 24011331 style essentials 2 financials 4 piece powerpoint presentation diagram infographic slide
Presenting this set of slides with name - Key Statistics Ppt Show Deck. This is a four stage process. The stages in this process are Devices Are Vulnerable To Security, Users Dont Protect Their Devices, Cyber Attacks Are Unnoticed.
-
 3d man arranging colorful toy blocks ppt graphics icons powerpoint
High resolution PPT template. Highly prompt content that are logical, accurate with flexible data. Amendable background with color, layout and font. We have designed 3D man colorful toy PowerPoint info graphics with alluring graph for comparison and fascinating figures to illustrate the concept. Can be easily converted into JPG or PDF format. Benefitted for students, researchers and business professionals.
-
 52351120 style linear 1-many 4 piece powerpoint presentation diagram infographic slide
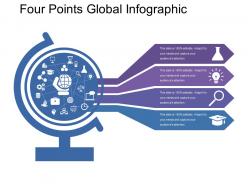
Presenting this set of slides with name - Four Points Global Infographic. This is a four stage process. The stages in this process are Global Infographic, International Infographic, Worldwide Inforgraphic.
-
 40668413 style essentials 2 dashboard 6 piece powerpoint presentation diagram infographic slide
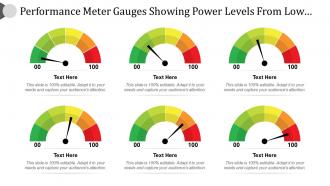
Introducing, the performance meter gauges PowerPoint Presentation Slide. This Presentation has been designed professionally and is fully editable. You can reshape the font size, font type, colors, and even the background. This Template is amiable with Google Slide and can be saved in JPG or PDF format without any fuss created. Fast download at the click of the button.
-
 43115336 style layered vertical 5 piece powerpoint presentation diagram infographic slide
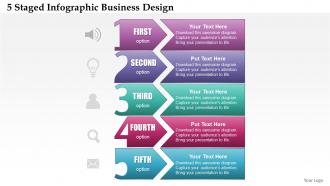
They have an infinite PPT designs. They are also steep and high quality PowerPoint graphics. These are also handy for the management studies, technology researchers, business professionals etc. These PPT slides have rewrite able contents, symbols, formats and PowerPoint Image etc. These are fully factual with plenty of room to add relevant title or subtitle, Consistent with Google slides, compatible with other file layouts as PDF or JPG.
-
 82135922 style essentials 2 financials 4 piece powerpoint presentation diagram infographic slide
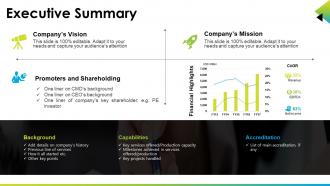
High resolution Presentation design is easy to portray and share with audience. PPT diagram is easy to amend as elements like font, colors and shape are editable. Download is hasty which saves time as well as effort. Tailor it by injecting corporation trade name and design. Display in both Standard and Widescreen format. Presentation design is totally responsive with Google slides. PPT PowerPoint slide comes with creative and professional approach.
-
 Process control gear strength employment opportunities business deal ppt icons graphics
Presenting process control gear strength employment opportunities business deal ppt icons graphics. This Power Point icon template diagram has been crafted with graphic of gear, employment and business icons. This icon PPT diagram contains the concept of process control and business deal representation. Use this icon PPT for business and finance related presentations.
-
 4682803 style essentials 2 dashboard 4 piece powerpoint presentation diagram infographic slide
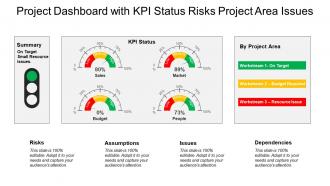
Presenting this set of slides with name - Project Dashboard Snapshot With Kpi Status Risks Project Area Issues. This is a four stage process. The stages in this process are Project Review, Project Analysis, Project Performance management.
-
 10954454 style essentials 2 financials 3 piece powerpoint presentation diagram infographic slide
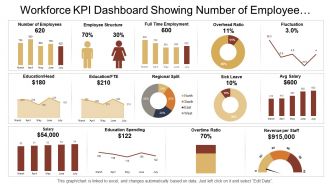
Presenting this set of slides with name - Workforce Kpi Dashboard Showing Number Of Employee Overhead Ratio And Salary. This is a three stage process. The stages in this process are Staff, Personnel, Workforce.
-
 66265408 style essentials 2 financials 5 piece powerpoint presentation diagram infographic slide
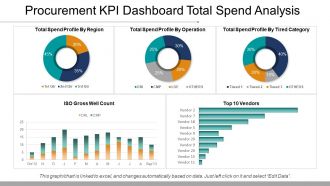
Presenting procurement kpi dashboard total spend analysis ppt samples. This is a procurement kpi dashboard total spend analysis ppt samples. This is a five stage process. The stages in this process are business, strategy, growth, finance, chart and graph.
-
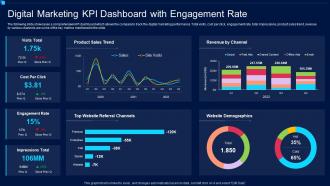 Digital Marketing KPI Dashboard With Engagement Rate
The following slide showcases a comprehensive KPI dashboard which allows the company to track the digital marketing performance. Total visits, cost per click, engagement rate, total impressions, product sales trend, revenue by various channels are some of the key metrics mentioned in the slide. Introducing our Digital Marketing KPI Dashboard Snapshot With Engagement Rate set of slides. The topics discussed in these slides are Product Sales Trend, Revenue By Channel, Top Website Referral Channels, Website Demographics, Engagement Rate, Impressions Total. This is an immediately available PowerPoint presentation that can be conveniently customized. Download it and convince your audience.
-
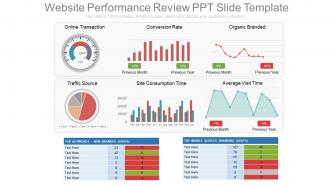 31657559 style essentials 2 financials 6 piece powerpoint presentation diagram infographic slide
These are exclusively codified PPT design schemes which are quite suitable for online business managers, process experts etc. These PPT graphics can be acclimating with divergent software’s and Google slides. These are wonderfully conceived pictorial Presentation templates which can be customizable in to other file formats like PDF or JPG. They have an alterable designs, forms, colors, contents etc. These Website performance PPT design can also provide a space to add the title or subtitle as per your need.
-
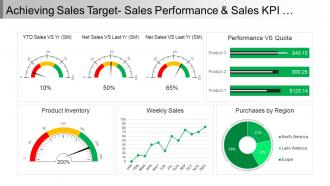 86455950 style essentials 2 financials 5 piece powerpoint presentation diagram infographic slide
Presenting Achieving Sales Target Sales Performance and Sales KPI Dashboard Snapshot PPT Icon. This presentation includes five stage processes with all the instructions to customize as per your needs and preferences. The stages in this process are sales objectives, sales goal, achieving sales target. You can add your brand’s name, logo or label for that extra impact. The Complete information and Enhanced Visuals are the strongest points of this Sales KPI Dashboard PPT.
-
 45312805 style linear opposition 2 piece powerpoint presentation diagram infographic slide
Presenting two charts pros and cons indication flat PowerPoint design. This PPT slide offers you plenty of space to put in titles and sub titles. High resolution based presentation layout, does not change the image quality even after resizing. This presentation is fully compatible with Google slides. Quick downloading speed and simple editing options in color text and fonts. PPT icons can easily be changed into JPEG and PDF applications. This diagram has been designed for entrepreneurs, corporate and business managers. Easy to use, edit and you can design attractive slides within few minutes.
-
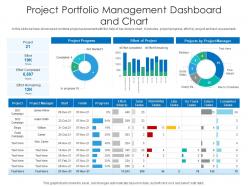 Project portfolio management dashboard and chart
In this slide we have showcased combine project assessment with the help of bar and pie chart, it includes- project progress, effort by project and task assessment. Introducing our Project Portfolio Management Dashboard And Chart set of slides. The topics discussed in these slides are Project Portfolio Management Dashboard And Chart. This is an immediately available PowerPoint presentation that can be conveniently customized. Download it and convince your audience.
-
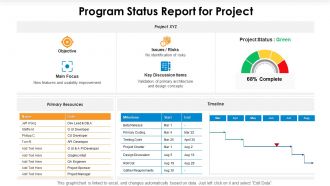 Program status report for project
Presenting this set of slides with name Program Status Report For Project. The topics discussed in these slides are Resources, Timeline, Focus. This is a completely editable PowerPoint presentation and is available for immediate download. Download now and impress your audience.
-
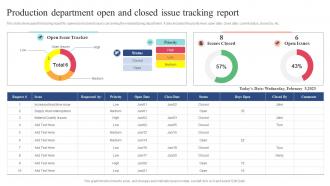 Production Department Open And Closed Issue Tracking Report
This slide showcases the tracking report for opened and closed issues concerning the manufacturing department. It also includes the priority level, open date, close date, current status, closed by, etc. Presenting our well structured Production Department Open And Closed Issue Tracking Report. The topics discussed in this slide are Production Department, Open Closed Issue, Tracking Report. This is an instantly available PowerPoint presentation that can be edited conveniently. Download it right away and captivate your audience.
-
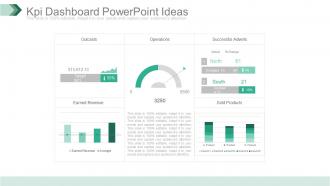 73555808 style essentials 2 dashboard 5 piece powerpoint presentation diagram template slide
Fabulously composed PPT design useful for business professionals, organizational experts or researchers , students and many more from diverse areas , Comprehensive and convenient PPT Images with ductile dummy data options, Consonant with all available graphic software’s and Google slides, Accessible to other file configurations like PDF or JPG. Multi-color options, background images, styles and other characteristics are fully editable, Expeditious downloading process, Allows to introduce your company logo or brand name in the PPT slides.
-
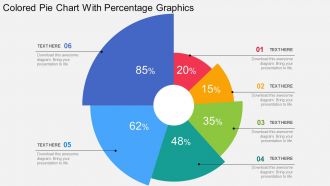 54231009 style division pie 6 piece powerpoint presentation diagram infographic slide
We are proud to present our colored pie chart with percentage graphics flat powerpoint design. Graphic of colored pie chart has been used to craft this power point template diagram. This PPT diagram contains the concept of financial analysis. Use this PPT diagram for business and finance related presentations.


