- Sub Categories
-
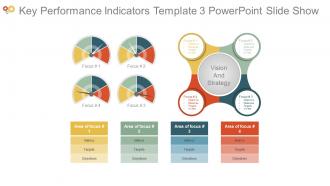 Key performance indicators template 3 powerpoint slide show
Presenting key performance indicators template 3 powerpoint slide show. Presenting key performance indicators template 3 powerpoint slide show. Presenting key performance indicators template 3 powerpoint slide show. This is a key performance indicators template 3 powerpoint slide show. This is four stage process. The stages in this process are area of focus, metrics, targets, objectives, vision and strategy, objective, measures, targets, invites.
-
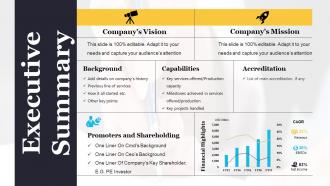 Executive summary example of ppt presentation
Presenting executive summary example PowerPoint Presentation. Elegant and simple visuals help you present your research in easy to understand, visual style. Presentation is downloaded in both widescreen (16:9) and standard screen (4:3) aspect ratio. Presentation template is compatible with Google slides. Fully editable in PowerPoint slideshow. Customize the font size, font color, graphic colors, and slide background without any hassle. The slides have text placeholders to enter your presentation content. PPT images with unaffected high resolution after editing any number of times.
-
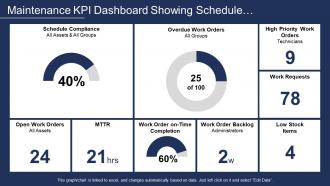 Maintenance kpi dashboard showing schedule compliance and mttr
Presenting this set of slides with name - Maintenance Kpi Dashboard Showing Schedule Compliance And Mttr. This is a nine stage process. The stages in this process are Maintenance, Preservation, Conservation.
-
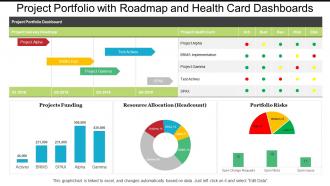 Project portfolio with roadmap and health card dashboards
Presenting, project portfolio with roadmap and health card dashboards. This Design possesses a construction that not only has a high market need but also displays clear judgment about the details and concept of the organization. It is obvious that there are various risks involved in a new business process so selecting an active medium to propose the message and other learning is very vital. These PPT designs have an addition to the advantage that these are pre-designed which makes it even more convenient for the new business.
-
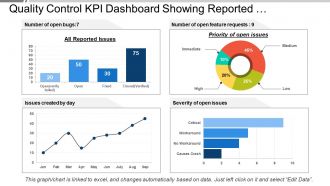 Quality control kpi dashboard showing reported issues and priority
Presenting this set of slides with name - Quality Control Kpi Dashboard Showing Reported Issues And Priority. This is a four stage process. The stages in this process are Quality Management, Quality Control, Quality Assurance.
-
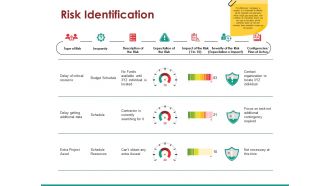 Risk identification ppt examples
Presenting this set of slides with name - Risk Identification Ppt Examples. This is a three stage process. The stages in this process are Type Of Risk, Jeopardy, Description Of The Risk, Expectation Of The Risk.
-
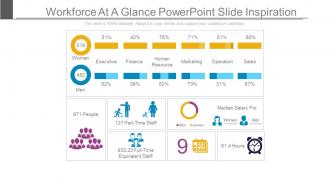 Workforce at a glance powerpoint slide inspiration
Presenting workforce at a glance powerpoint slide inspiration. This is a workforce at a glance powerpoint slide inspiration. This is a two stage process. The stages in this process are women, executive, finance, human resource, marketing, operation, sales, median salary for,part time staff,full time equivalent staff.
-
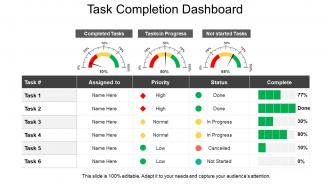 Task completion dashboard presentation examples
Presenting Task Completion Dashboard Presentation Examples. It is a professionally designed template with relevant visual content. Get easy access to the customizable slide. You can edit the color, and the font size of the slide. Background and the number of fields can be altered too. The slide is compatible with Google Slides and can be exported in PDF, JPEG or JPG formats. Avail it in standard screen and full-screen size.
-
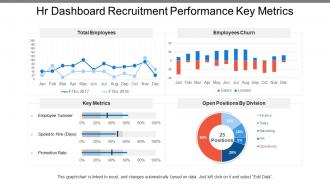 Hr dashboard snapshot recruitment performance key metrics
Presenting this set of slides with name - Hr Dashboard Snapshot Recruitment Performance Key Metrics. This is a four stage process. The stages in this process are Hr Dashboard, Human Resource Dashboard, Hr Kpi.
-
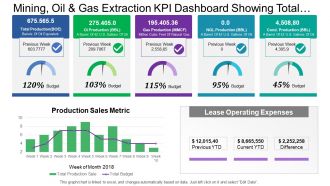 Mining oil and gas extraction kpi dashboard showing total production and budget
Presenting this set of slides with name - Mining Oil And Gas Extraction Kpi Dashboard Showing Total Production And Budget. This is a three stage process. The stages in this process are Mining, Oil And Gas Extraction, Refinery, Natural Gas.
-
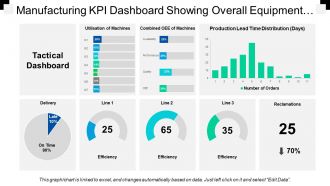 Manufacturing kpi dashboard showing overall equipment effectiveness
Presenting this set of slides with name - Manufacturing Kpi Dashboard Showing Overall Equipment Effectiveness. This is a eight stage process. The stages in this process are Manufacturing, Production, Manufacture.
-
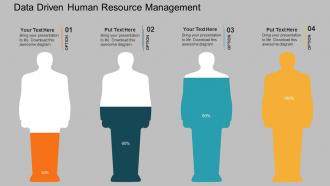 Data driven human resource management powerpoint slides
All images are 100% editable in the presentation design. Good quality images can be used to compliment message. Works well in Windows 7, 8, 10, XP, Vista and Citrix. Editing in presentation slide show can be done from anywhere by any device. Students, teachers, businessmen or industrial managers can put to use the PPT layout as per their requirement. Compatibility with Google slides. PPT graphic offers font size which can be read from a distance. High resolution is offered by the presentation slide show.
-
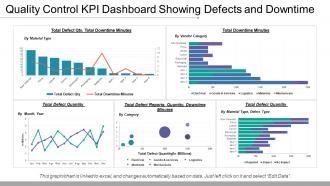 Quality control kpi dashboard showing defects and downtime
Presenting this set of slides with name - Quality Control Kpi Dashboard Showing Defects And Downtime. This is a five stage process. The stages in this process are Quality Management, Quality Control, Quality Assurance.
-
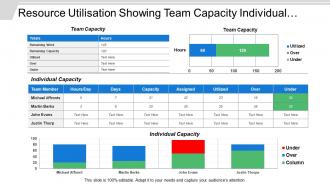 Resource utilisation showing team capacity individual capacity
Presenting this set of slides with name - Resource Utilisation Showing Team Capacity Individual Capacity. This is a four stage process. The stages in this process are Resource Management, Resource Utilization, Resource Allocation.
-
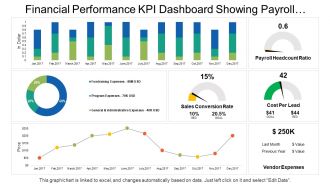 Financial performance kpi dashboard showing payroll headcount ratio cost per lead
Presenting this set of slides with name - Financial Performance Kpi Dashboard Showing Payroll Headcount Ratio Cost Per Lead. This is a seven stage process. The stages in this process are Financial Performance, Financial Report, Financial Review.
-
 Four key metrics donut chart with percentage
This key performance indicator presentation slide can easily be downloaded from our web page. The design is 100% editable; you can modify and customize the design according to your business needs. All the design elements such as font, type, color, size, images, shape, style, background is completely editable. Design is fully supported on standard and full screen view; no compromise with design quality on full screen view.
-
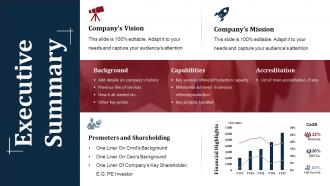 Executive summary powerpoint slide background image
Presenting executive summary powerpoint slide background image. • Tension free download possible. • Once downloaded, the presentation can be modified to any format like JPG, JPEG, PDF, etc • It’s also compatible with multiple software and Google slides. • The provided executive summary PPT presentation template can easily be used solely or as part your pre built presentation. • Be happy to customize and personalize the presentation with company specifications. • There is no hassle when any fact, figures or text is to be included or excluded in the presentation. • Picture quality compatible with wide screen exposure. • Much appreciated and used by business executives, professionals, students and teachers.
-
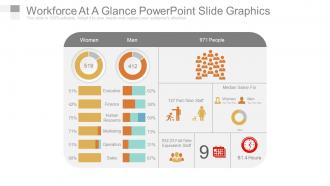 Workforce at a glance powerpoint slide graphics
Presenting this workforce analysis and planning PowerPoint presentation slide. The PPT slide is available in both widescreen size (16:9) and standard screen size (4:3). This template has been designed by our team of qualified designers and is editable in PowerPoint. You can change the font type, font size, font style, icons and background color of the slide as per your requirement. It is convenient to insert your company name and logo in the slide. You can remove the sample content in text placeholders and add your presentation’s content. The slide is fully compatible with Google slides and can be saved in JPG or PDF format easily. High resolution graphic image ensures that there is no deterioration in quality on enlarging the size of the image. You can download the slide quickly at the click of a button.
-
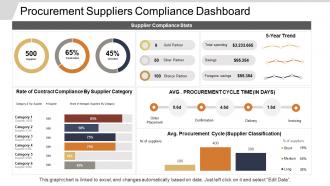 Procurement suppliers compliance dashboard
Presenting this set of slides with name - Procurement Suppliers Compliance Dashboard. This is a four stage process. The stages in this process are Purchase, Procurement, Buy.
-
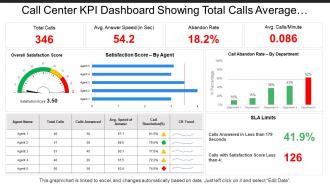 Call center kpi dashboard showing total calls average answer speed abandon rate
Presenting this set of slides with name - Call Center Kpi Dashboard Showing Total Calls Average Answer Speed Abandon Rate. This is a five stage process. The stages in this process are Call Center Agent, Customer Care, Client Support.
-
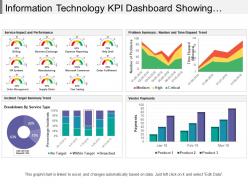 Information technology kpi dashboard showing incident target summary trend
Presenting this set of slides with name - Information Technology Kpi Dashboard Showing Incident Target Summary Trend. This is a five stage process. The stages in this process are Information Technology, It, Iot.
-
 Project name cost baseline portfolio dashboards
Presenting project name cost baseline portfolio dashboards PPT template. Download is quick and can be easily shared. Conveys a sense of change over time. Suitable for corporate leaders and business associates. Flexible PPT slide as can be used whenever required. PowerPoint design can be shared in Standard and Widescreen view. High quality graphics and visuals used in the PPT. Option to include business content i.e. name, logo and text. Effortless conversion into PDF/ JPG format. Can be easily merged with your ongoing presentation slides.
-
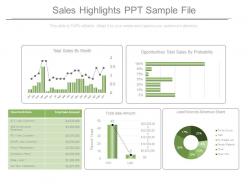 Sales highlights ppt sample file
Presenting sales highlights ppt sample file. This is a sales highlights ppt sample file. This is a five stage process. The stages in this process are total sales by month, opportunities total sales by probability, opportunity name amount, total sale amount, lead sources revenue share.
-
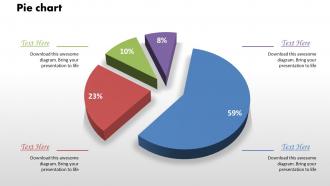 0414 business comparison pie chart powerpoint graph
Useful in business related presentations and professionals working in marketing agencies. No pixilation as the graphics are high end. Convertible into common format like JPEG and PDF. No space constraints when adding titles and sub-titles. Amendable in terms of color, font, text and design ensure pin-point control to the user. Does not occupy much space and is easy to download. Allows adding of company’s logo, name and trademark.
-
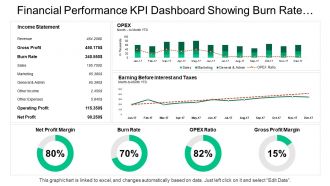 Financial performance kpi dashboard showing burn rate opex ratio gross profit
Presenting this set of slides with name - Financial Performance Kpi Dashboard Showing Burn Rate Opex Ratio Gross Profit. This is a four stage process. The stages in this process are Financial Performance, Financial Report, Financial Review.
-
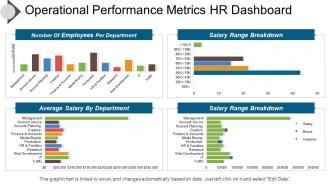 Operational performance metrics hr dashboard snapshot presentation images
Introducing operational performance metric HR PPT image. Fully regulated PowerPoint template quite reasonable for the HR and management professionals and business specialists. Extensive scope for reviving the dummy data and can add company logo, trademark etc. Reconvert able background PPT image, subject matter, designs, context etc. according to need. Versant with all Google Slides and other system applications. Can be easily projected over wide screen with exceptional picture quality.
-
 Progress bar chart example of ppt
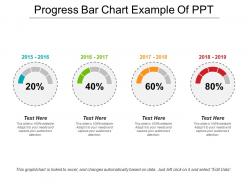
SlideTeam presents to you Progress Bar Chart Example Of PPT. This PowerPoint presentation can be saved in either PDF or JPG format easily. You can also view the slideshow in standard size display ratio of 4:3 or widescreen display ratio of 16:9. You can make any changes to the pre-designed PPT template, as it is highly customizable. You can also edit the font size, font color and the font style of the text used in the presentation. The slides are also compatible with Google slides.
-
 1214 colored coloum chart for result analysis powerpoint slide
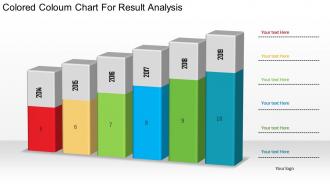
We are proud to present our 1214 colored coloum chart for result analysis powerpoint slide. Colored column chart has been used to craft this power point template. This PPT slide contains the concept of result analysis. Use this PPT slide for your finance and marketing related presentations.
-
 Kpi dashboard showing employee churn key metrics and open positions
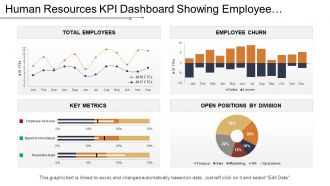
Presenting this set of slides with name - Kpi Dashboard Showing Employee Churn Key Metrics And Open Positions. This is a four stage process. The stages in this process are Human Resource, Hrm, Human Capital.
-
 Global market statistics pie chart with percentage powerpoint slides
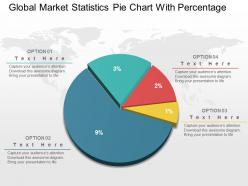
We are proud to present our global market statistics pie chart with percentage powerpoint slides. Explain the global market statistics with this power point template diagram. This PPT diagram contains the graphic of pie chart and percentage. Use this PPT diagram for global marketing and business related presentations.
-
 Progress bar example powerpoint graphics
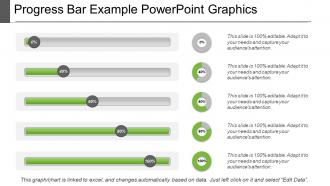
We brings to you the progress bar example PowerPoint graphics. You can download this PPT completely free of cost. You just have to edit the data in a pre-designed format and present it. You can insert pictures and new slides to this ready-made deck of slides. All these slides are fully compatible with Google Slides. This presentation can be downloaded in JPG and PDF formats. It can be viewed in the 16:9 ratio widescreen size and the ratio of 4:3 standard screen size.
-
 0414 business scale comparing column chart powerpoint graph
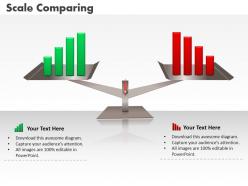
Equipped with numerous beneficial qualities required for a successful presentation. These can be easily tailored without putting much effort. Presentation slide comes in standard and widescreen view. Easily transformable into JPEG and PDF document. Creative and Innovative PowerPoint presentation design. Various other designs available with different charts. The quality is well appreciated by the high-profile businesses.
-
 0414 funnel sales bar chart illustration powerpoint graph
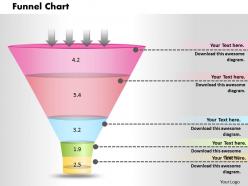
Easy to convert into JPG and PDF formats. Simple process to insert name, logo or sign. Adaptable design slide as can be appeared in widescreen see. PPT arrangements are absolutely extraordinary with Google slides. Comparable courses of action simple to get with various focus focuses and organizes. Expert and tranquil to recognize into sensible strategy. Simple to alter shading, content, printed style and even shape as these are 100% editable. Perfect for corporate affiliation pioneers, advertisers, brokers, sales representatives, promoters, business visionaries, business association experts and so o
-
 0514 vertical data driven bar graph powerpoint slides
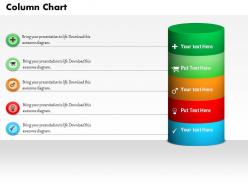
Completely compatible with Google slides. Picture graphics do not distort when projected on big screen. Quick downloading speed and change formats to other software like JPEG and PDF. High resolution based slide and does not alter after resizing. Easy customization editing options for fonts, colors and text. Beneficial for business, corporate and marketing people.
-
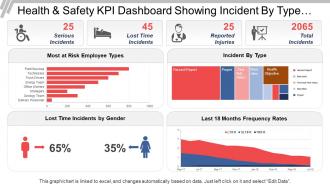 Health and safety kpi dashboard showing incident by type and frequency rates
Presenting the dashboard presentation slide. This KPI dashboard is fully editable and is designed by professionals looking for professional presentation design. You can edit the objects in the slide like font size and font color easily. This presentation slide is fully compatible with Google Slide and can be saved in JPG or PDF file format without any hassle. Click on the download button below.
-
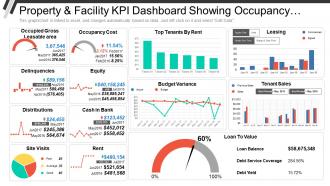 Property and facility kpi dashboard showing occupancy cost delinquencies and distributions
Presenting Property And Facility KPI Dashboard Showing Occupancy Cost Delinquencies And Distributions PPT slide. The Property And Facility KPI Dashboard PPT slide designed professionally by the team of SlideTeam to present the different parameters. These parameters have illustrated by different charts such as bar, line and pie chart, along with that the text in the KPI metric dashboard slide is customizable in PowerPoint. The logistics KPI dashboard template is compatible with Google Slide. A user can do alteration in the font size, font type, color and dimensions of the different figures as per the requirement.
-
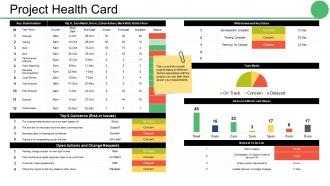 Project health card ppt gallery rules
Presenting health card PPT gallery rules. This layout is fully compatible with Google slides and data driven. User can edit the data in linked excel sheet and graphs and charts gets customized accordingly. Easy to put in company logo, trademark or name; accommodate words to support the key points. Images do no distort out even when they are projected on large screen. Adjust colors, text and fonts as per your business requirements
-
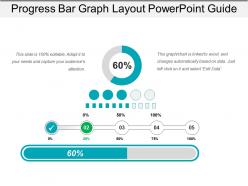 Progress bar graph layout powerpoint guide
Presenting a PPT slide named Progress Bar Graph Layout PowerPoint Guide. You can completely edit this slide as per your requirement. The font color, font size, font style, background color and the color of the diagram are all editable and can be changed. The dummy text in the slide can be rewritten. It’s a data-driven or Excel-linked template and hence can be customized accordingly. A collection of editable and high-quality icons ensures a better design for your presentation. The slide is compatible with Google Slides and can be saved in JPG, JPEG or PDF formats.
-
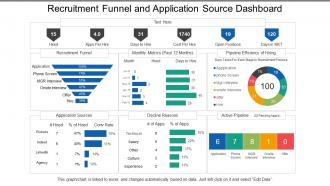 Recruitment funnel and application source dashboard
Presenting this set of slides with name - Recruitment Funnel And Application Source Dashboard. This is a three stage process. The stages in this process are Staffing Plan, Recruitment, Staff Management.
-
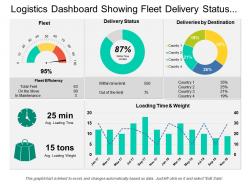 Logistics dashboard showing fleet delivery status and delivery by destination
Presenting this set of slides with name - Logistics Dashboard Showing Fleet Delivery Status And Delivery By Destination. This is a three stage process. The stages in this process are Logistics Dashboard, Logistics Kpis, Logistics Performance.
-
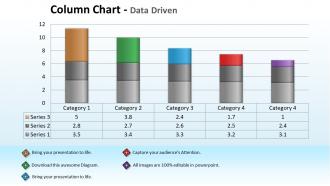 Data driven economic analysis with column chart powerpoint slides
We are proud to present our data driven economic analysis with column chart powerpoint slides. Raise A Toast With Our Data Driven Economic Analysis With Column Chart Powerpoint Slides Power Point Templates. Spread Good Cheer Amongst Your Audience. Press The Right Buttons With Our Data Driven Economic Analysis With Column Chart Powerpoint Slides Power Point Templates. They Will Take Your Ideas Down The Perfect Channel.
-
 Key design pie chart with idea generation process control powerpoint slides
Skillfully crafted Presentation layout. Completely modifiable PowerPoint visual as some elements are editable. Easiness of personalization with your company name and logo. PPT diagram can be downloaded easily and transform into JPG and PDF format. Choice to access similar designs with different stages. PowerPoint slide can be projected in standard and widescreen view. Awesome use of colors and innovatively designed.
-
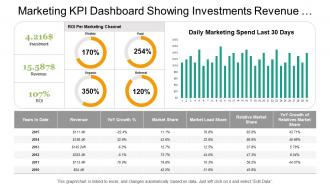 Marketing kpi dashboard showing investments revenue metrics details
Presenting marketing kpi dashboard showing investments revenue metrics details presentation template slide. The PPT template is very user friendly as it allows you to make numerous changes to the editable slides. You can amend the font size, font style and also the font color as per your requirements. Template slide can be downloaded quickly and cab be saved in format of PDF or JPG easily. The template slide after being downloaded can be viewed in large screen display ratio of 16:9 or standard size display ratio of 4:3.
-
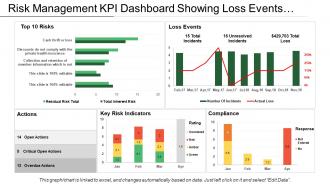 Risk management kpi dashboard showing loss events actions and compliance
Presenting this set of slides with name - Risk Management Kpi Dashboard Showing Loss Events Actions And Compliance. This is a four stage process. The stages in this process are Risk Management, Risk Assessment, Project Risk.
-
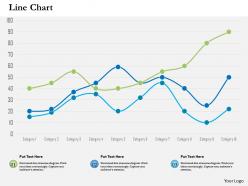 0514 data driven line chart diagram powerpoint slides
SlideTeam announces the 0514 data driven line chart diagram PowerPoint slides that help you in presenting the conclusion of a project. All these slides are fully compatible with Google slides. These slides can be edited at any time as and how you want. Our experts have been working on this slideshow since a long time and the result is going to be very fruitful for you. Now you can even view the presentation in 16:9 widescreen size instead of the old 4:3 standard screen size.
-
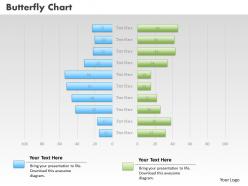 0414 butterfly bar chart business illustartion powerpoint graph
You can use slide fluently on all software. Rapid transformation to JPG and PDF formats. Highly compatible with Google slides for easy and shared information access. Widescreen viewing without PPT graphics pixelation. Add company logo, name and trademark for specificity. Editable layout with the option to alter features like font, text, color and design. High resolution PPT graphics for better clarity. Usable in businesses, small and large, startups, project management, strategic firms, quality assurance departments, government offices and educational institutes.
-
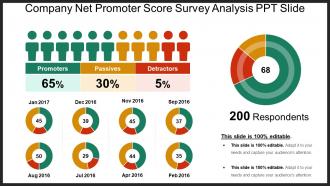 Company net promoter score survey analysis ppt slide
Presenting company net promoter score survey analysis PPT slide Powerpoint presentation which is 100% editable. This PPT template is excel linked i.e. data driven and can easily be customized which enables you to personalize it as per your own criteria. The presentation slide is fully compatible with Google slides, multiple format and software options. In case of any assistance, kindly take instructions from our presentation design services and it is easy to download in a very short span of time. The images, layouts, designs are of high quality and ensures quality in widescreen.
-
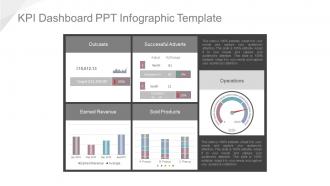 Kpi dashboard ppt infographic template
Presenting kpi dashboard ppt infographic template. This is a Kpi Dashboard Ppt Infographic Template. This is a four stage. The Stages in this process are outcasts, successful adverts, earned revenue, sold products, operations.
-
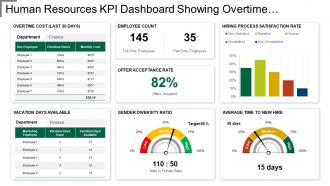 Kpi dashboard showing overtime cost gender diversity ratio
Presenting this set of slides with name - Kpi Dashboard Showing Overtime Cost Gender Diversity Ratio. This is a six stage process. The stages in this process are Human Resource, Hrm, Human Capital.
-
 Project name status schedule and management dashboard
Presenting project name status schedule and management dashboard PowerPoint template. Presentation slides are compatible with Google slides. Download is quick and can be easily shared. Conveys a sense of change over time. Suitable for corporate leaders and business associates. Flexible PPT slide as can be used whenever required. PowerPoint design can be shared in Standard and Widescreen view. High quality graphics and visuals used in the PPT. Option to include business content i.e. name, logo and text. Effortless conversion into PDF/ JPG format.
-
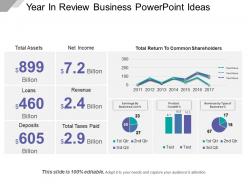 Year in review business powerpoint ideas
Presenting Year In Review Business PowerPoint Ideas. Get this Excel linked PPT slide and deliver quality presentations to your audience. You are free to make changes in any part of the slide. Modify the colors as per your choice, change the font type and font size and save this in JPG and PDF formats. This is entirely compatible with Google Slides and can be viewed on the standard screen and widescreen.
-
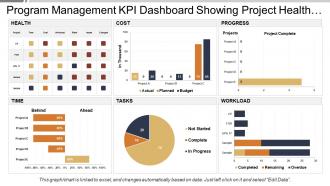 Program management kpi dashboard showing project health and progress
Presenting this set of slides with name - Program Management Kpi Dashboard Showing Project Health And Progress. This is a six stage process. The stages in this process are Program Development, Human Resource Management, Program Management.
-
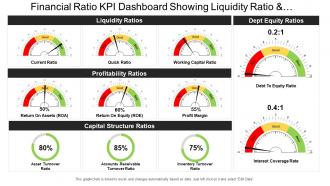 Financial ratio kpi dashboard snapshot showing liquidity ratio and profitability ratio
Presenting this set of slides with name - Financial Ratio Kpi Dashboard Snapshot Showing Liquidity Ratio And Profitability Ratio. This is a three stage process. The stages in this process are Accounting Ratio, Financial Statement, Financial Ratio.
-
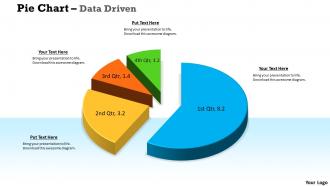 Data driven 3d data in segments pie chart powerpoint slides
We are proud to present our data driven 3d data in segments pie chart powerpoint slides. Whatever The Nuance You Want To Project. We Have A Data Driven 3D Data In Segments Pie Chart Powerpoint Slides Power Point Templates That Will Get It Across. Create A Connection With Your Audience Using Our Data Driven 3D Data In Segments Pie Chart Powerpoint Slides Power Point Templates. Transfer Your Depth Of Knowledge Clearly Across To Them.
-
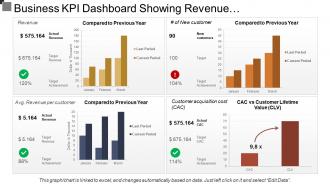 Business kpi dashboard showing revenue and customer lifetime value
Presenting this set of slides with name - Business Kpi Dashboard Showing Revenue And Customer Lifetime Value. This is a four stage process. The stages in this process are Business Dashboard, Business Kpi, Business Performance.
-
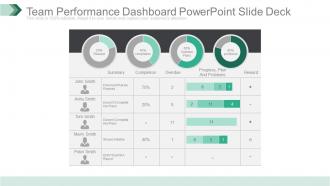 Team performance dashboard powerpoint slide deck
Presenting team performance dashboard powerpoint slide deck. This is a team performance dashboard powerpoint slide deck. This is a four stage process. The stages in this process are completion, overdue plans, problems, summary, completion, overdue, progress, plan and problems, reward.
-
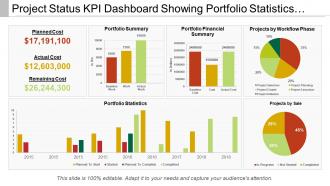 Project status kpi dashboard showing portfolio statistics and workflow phase
Presenting Project Status Kpi Dashboard Showing Portfolio Statistics And Workflow Phase PPT template. All around planned layout slide. This template slide is completely perfect with Google. Tend to upgrade the general effect of your introduction. Introduced to be spared in JPEG, JPG or PDF arrange whenever required. Space accessible to include your organization data as and when required. The format slide is famous and popular because of its simple utilize and openness. Basic and accommodating downloading by following clear advances. This slide keeps up the demonstrable skill of the introduction.
-
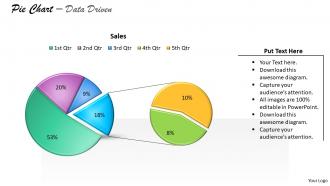 Data driven pie chart for business stratregy powerpoint slides
We are proud to present our data driven pie chart for business stratregy powerpoint slides. Use this diagram to show the steps as they actually occur in the process. Different color has been used in this diagram to represent each step which will help you to understand and depict the flow more accurately.
-
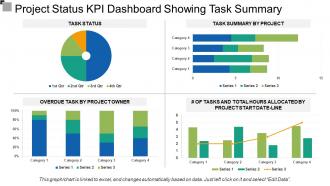 Project status kpi dashboard showing task summary
Presentation template is attainable in standard and widescreen view. Presentation slides created with high quality resolution design. Totally variable design as color, text and font can be edited with ease. PPT slide easy to download with different slides. Easy to transmute the presentation slide into JPEG and PDF document. Download is quick. PowerPoint slide helps you to save time and effort. Just enter the business information and share with your shareholders, clients, team etc. Professionally crafted with concept in mind.
-
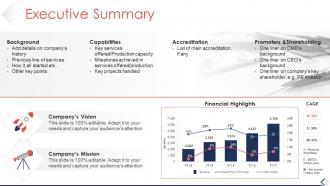 Executive summary powerpoint slide download
Presenting Executive Summary PowerPoint Slide Download template. You can include charts and graphs for a clear representation of facts. The PPT also supports the standard (4:3) and widescreen (16:9) aspect ratios. It is having compatibility with Google Slides. Save this into common images or document formats like JPEG, PNG, or PDF. High-quality graphics will ensure that picture quality does not deteriorate.


