- Sub Categories
-
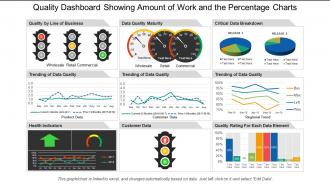 Quality dashboard snapshot showing customer product data with data quality
SlideTeam feels immense pleasure in presenting to you its 100% customizable and user-friendly quality dashboard snapshot showing customer data with data quality. The business slides can be viewed in widescreen display ratio of 16:9 or standard size display ratio of 4:3 after being downloaded. The PPT presentation lets you insert or remove any given feature from the redesigned set of slides. You can also save the slideshow in format of PDF or JPG and also it is compatible with Google Slides. So hit download, edit it and present it.
-
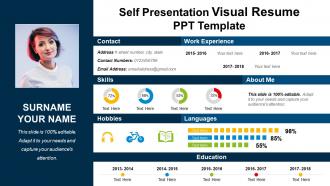 Self presentation visual resume ppt template
Highlighting self presentation visual resume PPT template. Hasty download and easily adapt into JPEG and PDF document. Preferences showcase presentation design in standard and widescreen display view. Availability alters the design with enterprise name, image, icon and picture. High quality PowerPoint layout comes with modification options as color, text and font and other elements can be edited. Presentation PPT template is available with different nodes and stages and can be merged with Google Slides.
-
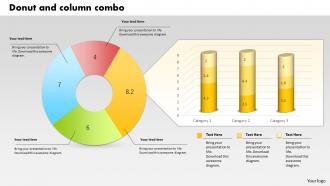 0414 Donut And Column Business Charts Powerpoint Graph
Entirely editable PowerPoint presentation slide. Adaptable with several software programs like JPEG and PDF. Preference to include and remove content as per the commerce need. Available in both standard as well as in widescreen slide. Gives a professional perspective to your PowerPoint slide. Personalization of PPT template is possible as per your requirement. Similar samples available with different nodes and stages.
-
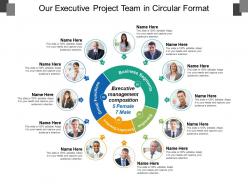 Our executive project team in circular format
• Impressive picture quality. • High resolution slide design. • Well crafted, aesthetically sound and professionally proficient. • Ease of download. • Ease of executing changes in the slide content. • Harmonious with multiple numbers of software options. • Harmonious with numerous slide design software. • Easy to customize and personalize with company specific name, logo and trademark. • Used by company professionals, teachers and students.
-
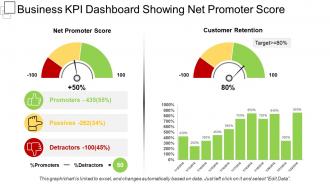 Business kpi dashboard snapshot showing net promoter score
Presenting this set of slides with name - Business Kpi Dashboard Snapshot Showing Net Promoter Score. This is a two stage process. The stages in this process are Business Dashboard, Business Kpi, Business Performance.
-
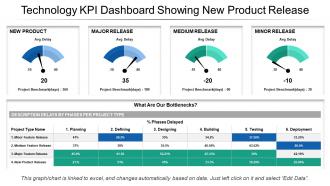 Technology kpi dashboard showing new product release
Delivering technology KPI dashboard new product release PowerPoint design. Presentation template goes well with Google slides. PPT slide is adaptable with maximum number of software i.e. JPG and PDF. Great picture quality PowerPoint graphic comes with high resolution picture as pixels never break even on wide screen. Choice includes business information such as name, logo and tagline. Fully amendable Presentation diagram comes with editable options. PPT design is easy to download and save for later use.
-
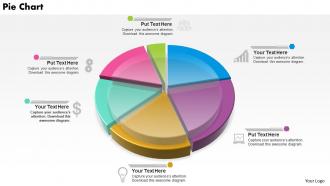 0514 multicolored data driven pie chart powerpoint slides
Perfect presentation slide for highlighting financial and sales data. Presentation slides are fully well-matched with Google slides. Convenient to be used on a wide screen view. No effect on the picture quality whatever be the size of your screen. High resolution quality PPT template designs. Simple to download and convert into JPEG or PDF document. PowerPoint template accessible with different pie slices composition. Reliable and accurate PPT slides.
-
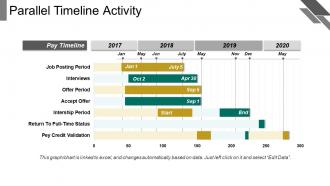 Parallel timeline activity
Presenting parallel timeline activity. This is a parallel timeline activity. This is a four stage process. The stages in this process are parallel timeline, parallel roadmap, parallel linear process.
-
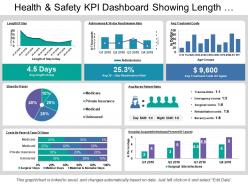 Health and safety kpi dashboard showing length of stay and treatment costs
Presenting this set of slides with name - Health And Safety Kpi Dashboard Showing Length Of Stay And Treatment Costs. This is a seven stage process. The stages in this process are Health And Safety, Health And Security, Health And Protection.
-
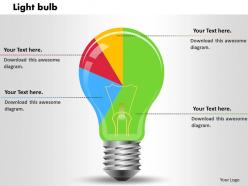 0414 light bulb shapes pie chart powerpoint graph
We are proud to present our 0414 light bulb shapes pie chart powerpoint graph. Dig in to our vast array of Light Bulb Shapes Pie Chart Powerpoint Graph Powerpoint Templates. Be sure to come with many that fit your need perfectly. Unleash the value of your experience with our Light Bulb Shapes Pie Chart Powerpoint Graph Powerpoint Templates. Educate your team with the knowledge you have gained.
-
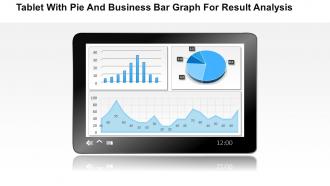 1214 tablet with pie and business bar graph for result analysis powerpoint slide
Exquisitely designed PowerPoint slide with great image quality. Editable images, icons, colors, text and layout as per the industry requisite. Alternative to add brand name and theme to customize. Presentation shape can be downloaded and save into JPG and PDF format. PPT design layout obtainable in standard and widescreen view. Fully flexible slide design with Google slides. Effortless to adjust and present when required. Innovatively designed to share the complex data in easy manner with graphs and charts. Easy to transmit any message effectively when shared even with large audience.
-
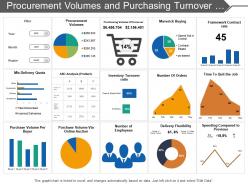 Procurement volumes and purchasing turnover dashboard
Presenting this set of slides with name - Procurement Volumes And Purchasing Turnover Dashboard. This is a four stage process. The stages in this process are Purchase, Procurement, Buy.
-
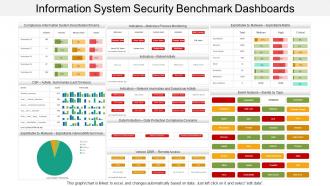 Information system security benchmark dashboards
Presenting this set of slides with name - Information System Security Benchmark Dashboards. This is a three stage process. The stages in this process are Information Security Strategy, Information Security Plan, Information Protection Strategy.
-
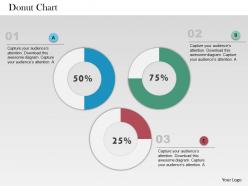 0514 data driven business donut chart powerpoint slides
We are proud to present our 0514 data driven business donut chart powerpoint slides. This Business power Point template is designed with unique donut chart. Enhance the beauty of your presentation with our unique template collection.
-
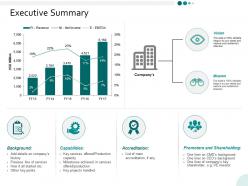 Executive summary ppt powerpoint presentation infographics deck
Presenting this set of slides with name - Executive Summary Ppt Powerpoint Presentation Infographics Deck. This is a six stages process. The stages in this process are Finance, Marketing, Management, Investment, Analysis.
-
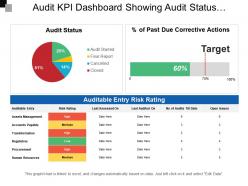 Audit kpi dashboard showing audit status auditable entry risk rating
Presenting this set of slides with name - Audit Kpi Dashboard Showing Audit Status Auditable Entry Risk Rating. This is a four stage process. The stages in this process are Audit, Examine, Survey.
-
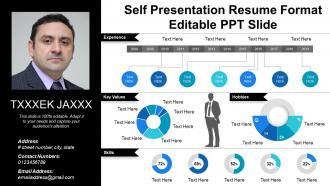 Self presentation resume format editable ppt slide
Presenting self presentation resume format editable PPT slide which is thoroughly editable, data driven i.e. excel linked and fast to download. The presenter can customize and personalize this PPT slide it to meet his / her own specifications. This presentation has been designed by plethora of professional expertise. This PowerPoint shape is fully compatible with Google Slides, multiple software and format options. This slideshow can be saved as JPG and / or in PDF. For your kind assistance, editing instructions are also provided.
-
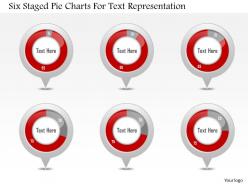 1214 six staged pie charts for text representation powerpoint slide
We are proud to present our 1214 six staged pie charts for text representation powerpoint slide. six staged pie charts are used to craft this power point template slide. This PPT slide contains the concept of process analysis. This analysis can be used for business and marketing related presentations.
-
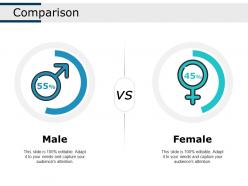 Comparison ppt show infographic template
Presenting this set of slides with name - Comparison Ppt Show Infographic Template. This is a two stage process. The stages in this process are Male, Female, Comparison.
-
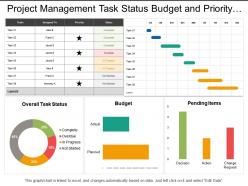 Project management task status budget and priority dashboard
Stunning project management task status budget and priority dashboard PowerPoint template. Choice to display PowerPoint template in standard and widescreen view. Presentation designs are well-suited with Google slides or MS Office PowerPoint programs. Can be transformed into JPG and PDF format. Trouble-free replacement of your company’s logo. Access to open on a big screen display. Perfect for business professionals, managers and industry leaders. Trustworthy and accurate PowerPoint slide show. Customize the fonts, colors, layout, etc.as per your requirements and business needs.
-
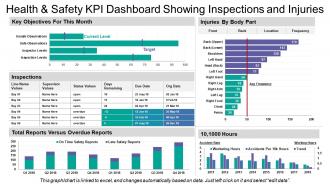 Health and safety kpi dashboard showing inspections and injuries
Presenting this set of slides with name - Health And Safety Kpi Dashboard Showing Inspections And Injuries. This is a five stage process. The stages in this process are Health And Safety, Health And Security, Health And Protection.
-
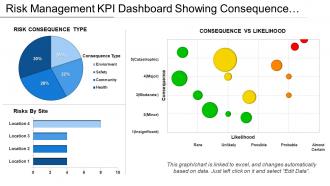 Risk Management Kpi Dashboard Showing Consequence Vs Likelihood
Presenting this set of slides with name - Risk Management Kpi Dashboard Showing Consequence Vs Likelihood. This is a three stage process. The stages in this process are Risk Management, Risk Assessment, Project Risk.
-
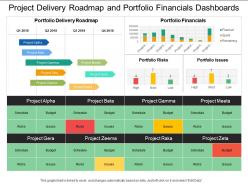 Project delivery roadmap and portfolio financials dashboards
Highlighting project delivery roadmap and portfolio financials dashboards PowerPoint presentation. Offer 100% access to change the size and style of the slides once downloaded and saved in the desired format. Beneficial for the business managers, marketing professionals and the strategy designers. Access to convert the presentation design into JPG and PDF. High quality images and visuals used in the designing process. Choice to get presentation slide in standard or in widescreen view. Easy to convert in JPEG and PDF document.
-
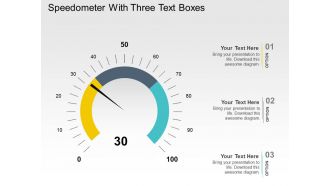 Speedometer with three text boxes powerpoint slides
Perfect balance of colors, shapes and stages in relation to presentation topic. High resolution and fine quality PowerPoint slides. Instant download and can be shared easily with large audience. Compatible with Google slides and easily convertible into JPEG and PDF. Guidance for executing the changes has been provided for assistance. Modify and personalize the presentation by including the company name and logo.
-
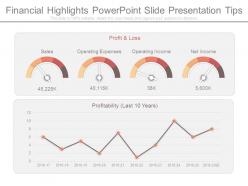 Financial highlights powerpoint slide presentation tips
Presenting financial highlights powerpoint slide presentation tips. This is a financial highlights powerpoint slide presentation tips. This is a four stage process. The stages in this process are sales, operating expenses, operating income, net income, profitability.
-
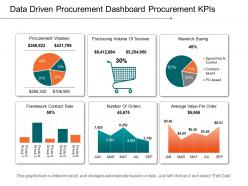 Data driven procurement dashboard snapshot procurement kpis example of ppt
Pre-designed data driven procurement dashboard for Kpis presentation template. Can be used for statistical data analysis. High-resolution PowerPoint presentation backgrounds for better clarity of the information displayed. Offers wide variety of options and colors to alter the appearance. Allows adding of enterprise personal details such as brand name, logo and much more. Enough space available to enter text and its related points in the PPT table. This PPT Slide is available in both Standard and Widescreen slide size. Compatible with multiple formats like JPEG, PDF and Google slides.
-
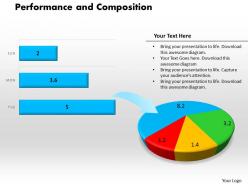 0414 performance and composition bar pie chart powerpoint graph
High resolution visuals. Ease of download. Compatible with numerous format options. Compatible with multiple online and offline software options. Thoroughly editable slide design background. Ease of inclusion and exclusion of slide content as per the need of an hour. Freedom to include the company specific name, logo and trademark, so as to personalize the presentation. Used by business professionals, finance students, marketing students, and teachers.
-
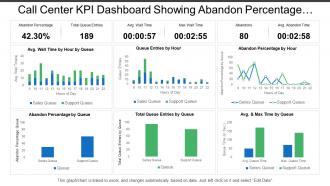 Call center kpi dashboard showing abandon percentage total queue entries
PowerPoint shape easy to amend as color, text, font etc are amendable. Notable quality presentation template. Well-adjusted online software programs such as JPG and PDF. Extra-ordinary picture quality as pixels don’t break when viewed in widescreen view. PPT design goes well with Google slides. Matching designs available with different nodes and stages. Handy presentation design saves you valuable time. Show the PowerPoint diagram with your corporate sign and title. Easy to download and can be saved for future reference.
-
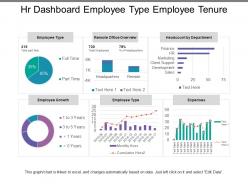 Hr dashboard employee type employee tenure
Presenting this set of slides with name - Hr Dashboard Employee Type Employee Tenure. This is a six stage process. The stages in this process are Hr Dashboard, Human Resource Dashboard, Hr Kpi.
-
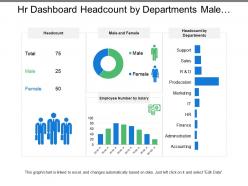 Hr dashboard headcount by departments male and female
Presenting this set of slides with name - Hr Dashboard Headcount By Departments Male And Female. This is a three stage process. The stages in this process are Hr Dashboard, Human Resource Dashboard, Hr Kpi.
-
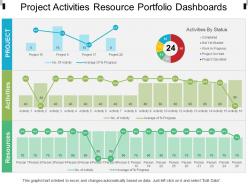 Project activities resource portfolio dashboards
Pre-designed project activities resource portfolio dashboards PPT template. Beneficial for managers, professors, marketers, etc. Flexible option for conversion in PDF or JPG formats. Available in Widescreen format also. Useful for making business plan and strategies. Can also be used with Google slides. Replace the images, text and the content in the slide design. Change the size, style and orientation of the slides. Use your company’s name or brand name to make it your own presentation template.
-
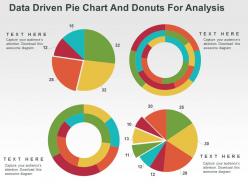 Data driven pie chart and donuts for analysis powerpoint slides
Presenting data driven pie chart and donuts for analysis PowerPoint template. High-resolution PowerPoint presentation backgrounds for better clarity of the information displayed. Offers wide variety of options and colors to alter the appearance. Allows adding of enterprise personal details such as brand name, logo and much more. Enough space available to enter text and its related points in the PPT table. This PPT Slide is available in both Standard and Widescreen slide size. Compatible with multiple formats like JPEG, PDF and Google slides.
-
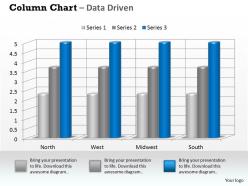 Data driven 3d business data on regular intervals powerpoint slides
We are proud to present our data driven 3d business data on regular intervals powerpoint slides. A bar graph is composed of discrete bars that represent different categories of data. The length or height of the bar is equal to the quantity within that category of data. Bar graphs are best used to compare values across categories.
-
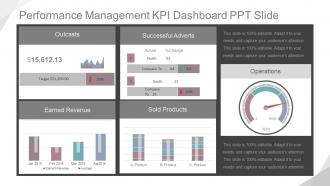 Performance Management Kpi Dashboard Snapshot Ppt Slide
Presenting performance management kpi dashboard snapshot ppt slide. This is a performance management kpi dashboard ppt slide. This is a five stage process. The stages in this process are product, sold products, compare to, south, north, actual, change, successful adverts, jan, feb, mar, apr, earned revenue, average, target, outcasts, operations.
-
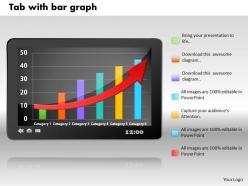 0414 tablate with bar graph column chart powerpoint graph
We are proud to present our 0414 tablate with bar graph column chart powerpoint graph. Our Tablate With Bar Graph Column Chart Powerpoint Graph Powerpoint Templates are the essential beat of your lilting melody. Adorn them with your tuneful thoughts and top the charts. Our Tablate With Bar Graph Column Chart Powerpoint Graph Powerpoint Templates give you a court to play on. Dribble your way along and score a goal.
-
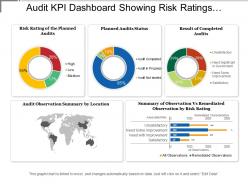 Audit kpi dashboard showing risk ratings planned audit status
Presenting this set of slides with name - Audit Kpi Dashboard Showing Risk Ratings Planned Audit Status. This is a five stage process. The stages in this process are Audit, Examine, Survey.
-
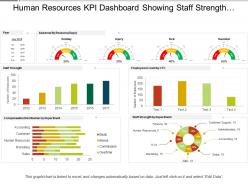 Human resources kpi dashboard showing staff strength compensation distribution
SlideTeam presenting Human Resources Kpi Dashboard Showing Staff Strength Compensation Distribution PPT. It will not only help you in knowing the exact strength of the staff but also about actual staff required in the organization. This slideshow is entirely editable and you can edit it whenever you want. All the slides in this presentation are compatible with Google slides. You can enter thousands of relatable icons of your own choice. You can also change from 4:3 standard screen size to 16:9 widescreen size.
-
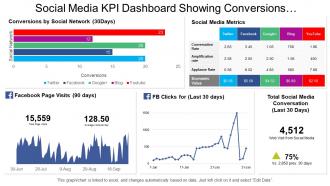 Social media kpi dashboard showing conversions by social network and metrics
Presenting this set of slides with name - Social Media Kpi Dashboard Showing Conversions By Social Network And Metrics. This is a five stage process. The stages in this process are Social Media, Digital Marketing, Social Marketing.
-
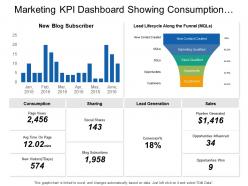 Marketing kpi dashboard showing consumption sharing sales lead generation
As this slideshow is 100% customizable you can easily add or remove anything from the pre-designed slides. You can change the font size, font color and the font style of the text used following instructions given in the sample templates. The orientation, size and the color of various graphical illustrations used in the PPT template are also adjustable. If you download this PPT slideshow you can view it in either standard size screen ratio of 4:3 or wide screen display ratio of 16:9. The PowerPoint presentation can be saved in PDF or JPG format. The slides are fully compatible with Google slides.
-
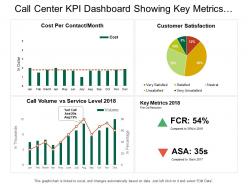 Call center kpi dashboard snapshot showing key metrics customer satisfaction
Introducing call center kpi dashboard snapshot showing key metrics customer satisfaction presentation template. Slide designs quality does not deflect when opened on a wide screen show. Inconvenience free fuse of tweaked shading, content and illustrations. Slide incorporates instructional slides to give direction to change the graphical substance. Spare the presentation graphics in JPG or PDF organize. Successfully valuable for the systems administration experts, mediators and the procedure architects, it administrators, data innovation firms. Format slide with various stages or hubs are accessible. Simplicity of download.
-
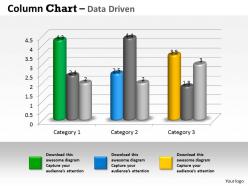 Data driven 3d business trend series chart powerpoint slides
We are proud to present our data driven 3d business trend series chart powerpoint slides. A bar graph is composed of discrete bars that represent different categories of data. The length or height of the bar is equal to the quantity within that category of data. Bar graphs are best used to compare values across categories.
-
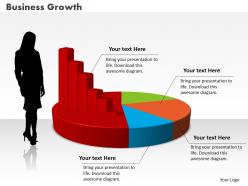 0414 business women with column pie chart powerpoint graph
Access to change the content or insert information. No concession with the quality, once opened on wide screen. Compatible with Microsoft office software and the Google slides. Modify and personalize the presentation by including the company name and logo. Guidance for executing the changes has been provided for assistance. Amendable presentation slide with pie chart. High resolution of diagrams and graphics.
-
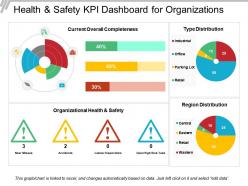 Health and safety kpi dashboard for organizations
Presenting this set of slides with name - Health And Safety Kpi Dashboard For Organizations. This is a four stage process. The stages in this process are Health And Safety, Health And Security, Health And Protection.
-
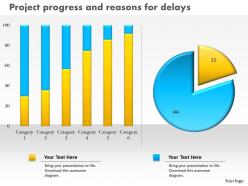 0414 project progress with column and pie chart powerpoint graph
Runs with all the softwares and is compatible with Google slides. Does not use much space and is easy to download. Provision to add name and logo of the company. Picture graphics never pixilate even if projected on bigger screens. Add titles and sub-titles as there is plenty of space. Changeable layout in terms of font text, color, design and orientation. Convertible into JPEG and PDF formats. Useful for business and progress related presentations.
-
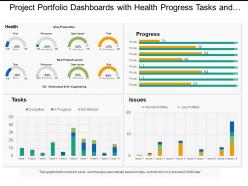 Project portfolio dashboards snapshot with health progress tasks and issues
Presenting, project portfolio dashboards snapshot with health progress tasks and issues. This PPT Template can be used by specialists for designing their project portfolio dashboards and health progress matters for data analysis. You can change the color of the components shown in the figure and also edit the text to write a short brief about your company's financial affairs. This PowerPoint template is also compatible with google slides and can be projected to a widescreen for business meetings without pixelating.
-
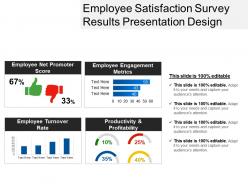 Employee satisfaction survey results presentation design
Presenting Employee Satisfaction Survey Results Presentation Design. The slide is completely customizable and can be downloaded in various formats like JPG, PNG, and JPEG. It goes well with the Google Slides and the major Microsoft versions. Also, you are free to change the colors, font type and the font size of the slide. The background of the template can also be altered. The template can be viewed on two screen sizes i.e. standard screen (4:3) and widescreen (16:9).
-
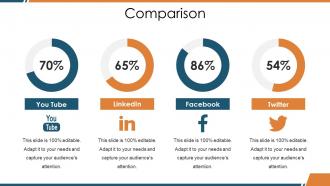 Comparison ppt introduction
Presenting this set of slides with name - Comparison Ppt Introduction. This is a four stage process. The stages in this process are You Tube, LinkedIn, Facebook, Twitter, Comparison.
-
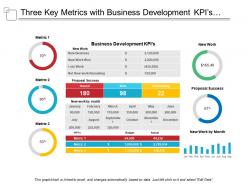 Three key metrics with business development kpis and proposal success
Presenting this set of slides with name - Three Key Metrics With Business Development Kpis And Proposal Success. This is a three stage process. The stages in this process are Key Metrics, Key Performance Indicator, Kpi.
-
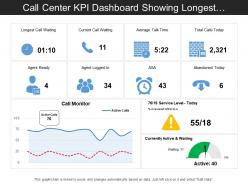 Call center kpi dashboard showing longest call waiting and average talk time
Presenting this set of slides with name - Call Center Kpi Dashboard Showing Longest Call Waiting And Average Talk Time. This is a three stage process. The stages in this process are Call Center Agent, Customer Care, Client Support.
-
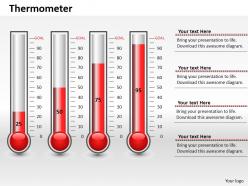 0414 business growth thermometer chart powerpoint graph
Thoroughly editable predesigned slides. Ease of inclusion and exclusion of content as per the need. Compatibility with number of online and offline software options. Compatibility with numerous format options. Impressive image quality. The visuals do not deter in quality when projected on wide screen. Freedom to personalize the content with company name and logo. Used by marketers, professionals of various departments, students and educators.
-
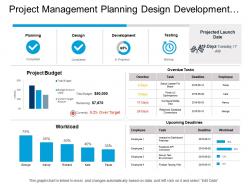 Project management planning design development and testing dashboard
Easy get with different nodes and stages as required. Amendable presentation design comes with amazing picture quality. Modification is possible with color, text, font and shape. Prompt download and can be changed in JPEG and PDF format. Gives specialized effect to your Presentation template. PowerPoint slide exhibited in standard and widescreen view. Alternate to customize the design by adding business name, icon and symbol. PPT slide can be shared with Google slides as works merge well with them.
-
 Business development statistics results slide powerpoint templates
Presenting business development statistics results slide powerpoint templates. This is a business development statistics results slide powerpoint templates. This is a five stage process. The stages in this process are results, output, deliverables, goals.
-
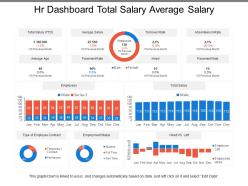 Hr dashboard total salary average salary
Presenting this set of slides with name - Hr Dashboard Total Salary Average Salary. This is a three stage process. The stages in this process are Hr Dashboard, Human Resource Dashboard, Hr Kpi.
-
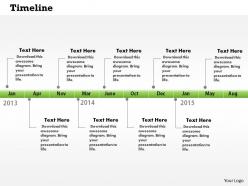 0514 monthly target growth time line diagram powerpoint slides
Useful for businessmen, sales and marketing team, teachers and stock brokers. Orientation of any graphic can be changed. PPT diagram can be viewed in 4: 3 standard screen size or 16:9 wide screen size. 100% compatible with Google slide. Freely edit the color, size and orientation in PowerPoint slide. Compatible with Microsoft 2010 and 2013 versions
-
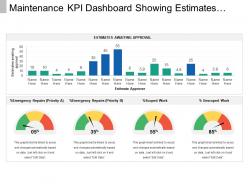 Maintenance kpi dashboard snapshot showing estimates awaiting approval
Presenting maintenance KPI dashboard snapshot showing estimates awaiting approval PPT slide. This layout is fully compatible with Google slides and data driven. User can edit the data in linked excel sheet and the design will change accordingly. Easy to put in company logo, trademark or name; accommodate words to support the key points. Images do no distort out even when they are projected on large screen. Adjust colors, text and fonts as per your business requirements.
-
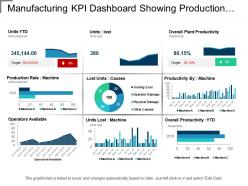 Manufacturing kpi dashboard showing production rate and lost units
Presenting manufacturing KPI dashboard showing production rate and lost units. This layout is compatible with Google slides and data can be updated with excel linked file. Easy to put in company logo, trademark or name; accommodate words to support the key points. Images do no blur out even when they are projected on large screen.PPT template can be utilized by sales and marketing teams and business managers. Instantly downloadable slide and supports formats like JPEG and PDF.
-
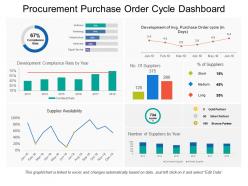 Procurement purchase order cycle dashboard
Presenting this set of slides with name - Procurement Purchase Order Cycle Dashboard. This is a seven stage process. The stages in this process are Purchase, Procurement, Buy.
-
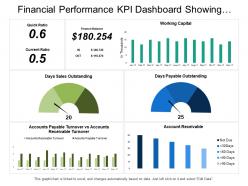 Financial performance kpi dashboard showing quick ratio current ratio working capital
Presenting this set of slides with name - Financial Performance Kpi Dashboard Showing Quick Ratio Current Ratio Working Capital. This is a three stage process. The stages in this process are Financial Performance, Financial Report, Financial Review.
-
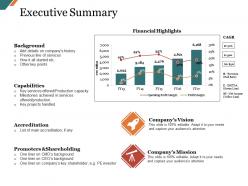 Executive summary ppt slide
Presenting this set of slides with name - Executive Summary Ppt Slide. This is a two stage process. The stages in this process are Background, Capabilities, Accreditation, Promoters And Shareholding, Company Vision.
-
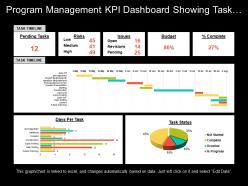 Program management kpi dashboard showing task timeline risks and budget
Presenting Program Management KPI Dashboard Showing Task Timeline Risks And Budget PPT slide. The task timeline dashboard PowerPoint template designed professionally by the team of SlideTeam to present the values over time. The different icons such as pie chart, line chart, as well as other figures and text in the Graphical Chart KPI dashboard slide are customizable in PowerPoint. A user can illustrate the desired numerical information because the graphical management dashboard template gets linked with Excel Sheet. The management dashboard slide is compatible with Google Slide. You may edit the font size, font type, color and dimensions of the different chart to present the desired numerical information.


