- Sub Categories
-
 Budget forecast showing income of the various months and savings
Presenting this set of slides with name - Budget Forecast Showing Income Of The Various Months And Savings. This is a three stage process. The stages in this process are Budget Forecast, Forecast Vs Actual Budget, Plan Vs Forecast.
-
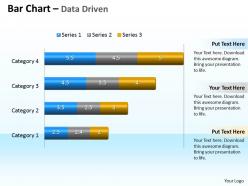 Data driven 3d bar chart to compare categories powerpoint slides
We are proud to present our data driven 3d bar chart to compare categories powerpoint slides. You can present your opinions using this impressive template. It helps your team to align their arrows to consistently be accurate. Use this slide to highlight your thought process.
-
 1214 battery with empty sign for power generation powerpoint slide
We are proud to present our 1214 battery with empty sign for power generation powerpoint slide. This Power point template slide has been crafted with graphic of battery with empty sign. This PPT slide contains the concept of power generation. This PPT slide is usable for power related presentations.
-
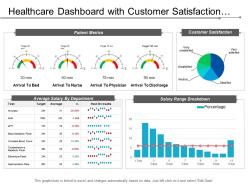 Healthcare dashboard with customer satisfaction and patient metrics
Presenting this set of slides with name - Healthcare Dashboard With Customer Satisfaction And Patient Metrics. This is a four stage process. The stages in this process are Healthcare, Health Improvement, Medical Care.
-
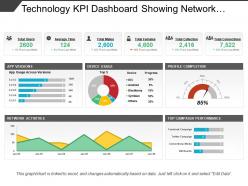 Technology kpi dashboard showing network activities and device usage
Introducing Technology KPI dashboard showing network activities PPT design. Quick download and simple to convert into JPEG and PDF document. High quality presentation slide comes with editing options as color, text and font can be edited at any stage. Preference to display PowerPoint template in standard and widescreen display view. Presentation graphic is accessible with different nodes and stages. Easy to present with large audience. Amend the design with corporate name and icon.
-
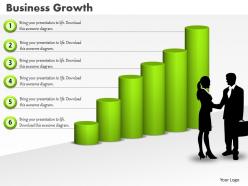 0414 column chart business deal illustration powerpoint graph
This PPT template completely supported with Google slides. Formats can easily be changed into other software’s applications like PDF and JPEG. Simple to input company logo, brand name or name. The quality of presentation image does not blur even when your project it on full-size screen. Adjust PowerPoint design slides font, text, color and design as per your technique. Best suited for entrepreneurs and large business organization.
-
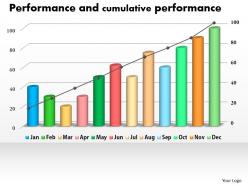 0414 column line chart for cumulative performance powerpoint graph
Incredible quality Presentation visual design with better display. Easy to include personalized content corporate logo or emblem. Contents of slide background are 100% editable to the extent. Multiple options like JPG and PDF for saving the presentation visual. PPT background downloadable with different nodes and stages. The PowerPoint illustration presentable in standard and widescreen view. Impeccable use of vectors which can be customized as per your requirement.
-
 Self presentation powerpoint template visual resume
Presenting self presentation PowerPoint template visual resume PPT template. You can download this template and save into another format such as JPG and PDF and can also display in standard and widescreen view. You can alter the slide such as color, text, font type, font size and aspect ratio. The template gets synced with Google Slides and customizable in PowerPoint. You may share this slide with large segment because it has great pixel quality. You can insert the relevant content in text placeholder of this template.
-
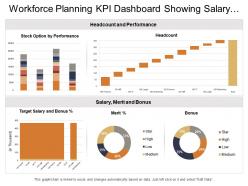 Workforce planning kpi dashboard showing salary merit bonus headcount and performance
Presenting this set of slides with name - Workforce Planning Kpi Dashboard Showing Salary Merit Bonus Headcount And Performance. This is a five stage process. The stages in this process are Staff, Personnel, Workforce.
-
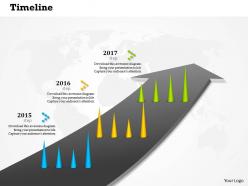 0514 linear progressive time line diagram powerpoint slides
We are proud to present our 0514 linear progressive time line diagram powerpoint slides. A linear progressive time line diagram is used in this Business Power Point template. Show all kind of result analysis in any presentation by using this template.
-
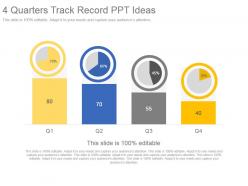 4 quarters track record ppt ideas
Presenting 4 quarters track record PPT template. Beneficial for the business managers, marketing professionals and the strategy designers. Access to convert the presentation design into JPG and PDF. Offer 100% access to change the size and style of the slides once downloaded and saved in the desired format. Choice to get presentation slide in standard or in widescreen view. Easy to convert in JPEG and PDF document. Compatible with Google slides. Easy and hassle-free downloading process.
-
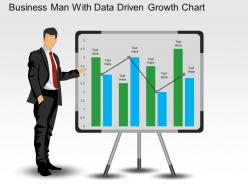 Business man with data driven growth chart powerpoint slides
Downloads instantaneously without unnecessary steps. High resolution PPT images with fully modifiable size and orientation. Fully editable text sans length constraints on titles and subtitles. Insert your company name, brand name, tagline or watermark. Convert easily into PDF or JPG formats and run with any software. Impressive addition to presentations by project managers, sales executives, marketers etc.
-
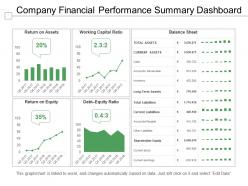 Company financial performance summary dashboard presentation slides
Introducing company financial performance summary dashboard PPT slide. Promptly conformable PPT design which saves time with an instant downloading option. Reinstate able PPT image, Restyle able subject matter, designs, context etc. Versant with Google Slides and other applications. Perfectly standardized PowerPoint template quite handy for the trade specialists from diverse areas. Easily convertible into different file arrangements such as PDF or JPG.
-
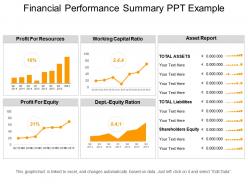 Financial performance summary ppt example
Presenting Financial Performance Summary PPT Example. It is professionally designed and 100% editable. You can alter the color, font, font size and font types of the slide. This template is easily adaptable with Google Slides which makes it easily accessible at once. Can be converted into various formats like JPG, PDF and PNG. It is available in both standard and widescreen.
-
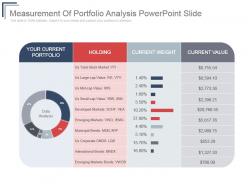 Measurement of portfolio analysis powerpoint slide
Presenting measurement of portfolio analysis PowerPoint slide. This layout is Compatible with Google slides. Easy to put in company logo, trademark or name; accommodate words to support the key points. Images do no blur out even when they are projected on large screen.PPT template can be utilized by sales and marketing teams and business managers. Instantly downloadable slide and supports formats like JPEG and PDF. Adjust colors, text and fonts as per your business requirements.
-
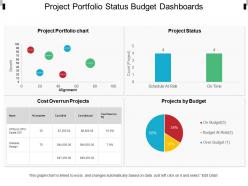 Project portfolio status budget dashboards
Presenting, project portfolio status budget dashboards. This PPT slide believes in delivering a pleasant and great experience to the customers and can be picked by professionals for a great experience. The color of the pie chart sections and text areas can easily be edited according to your need. This PPT slide is also agreeable with google slides and accessible in Fullscreen version. Offhand conversion into PDF/ JPG format. Simple insertion of company trade name/logo.
-
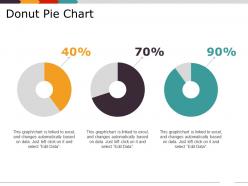 Donut pie chart presentation design
Presenting Donut Pie Chart Presentation Design PowerPoint slide. Easy to download PPT layout and can be saved in different formats like JPG, PDF and PNG. This PowerPoint slide is completely editable so you can modify, font type, font color, shape and image according to your requirements. This Google Slides compatible PPT is available in 4:3 and 16:9 aspect ratios.
-
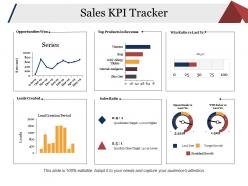 Sales kpi tracker presentation examples
Presenting this set of slides with name - Sales Kpi Tracker Presentation Examples. This is a six stage process. The stages in this process are Opportunities Won, Top Products In Revenue, Win Ratio Vs Last, Leads Created, Sales Ratio.
-
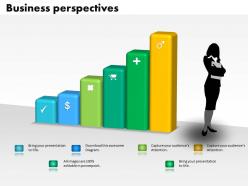 0514 data driven business prespective bar graph powerpoint slides
We are proud to present our 0514 data driven business prespective bar graph powerpoint slides. This Business Power Point template is designed with graphic of donut chart with data driven analysis. Show all kind of business perspectives with our unique graphic templates.
-
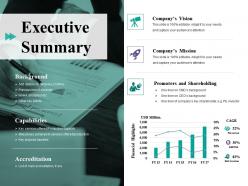 Executive summary ppt file elements
Presenting this set of slides with name - Executive Summary Ppt File Elements. This is a five stage process. The stages in this process are Company Vision, Promoters And Shareholding, Background, Capabilities, Accreditation.
-
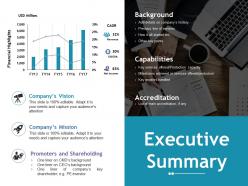 Executive summary ppt file example topics
Presenting this set of slides with name - Executive Summary Ppt File Example Topics. This is a five stage process. The stages in this process are Company Vision, Promoters And Shareholding, Background, Capabilities, Accreditation.
-
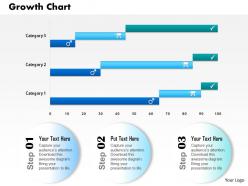 0514 3d financial growth updation chart powerpoint slides
Picture quality does not deter when opened on a big screen display. Trouble-free incorporation of customized content or graphics. Provided guidance to modify the graphical content. Save the presentation visual in JPG or PDF format. Compatible with the online as well as offline PowerPoint softwares. Effectively useful for the Marketing professionals, finance and account professionals.
-
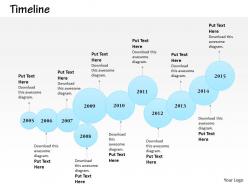 0514 unique way data driven time line diagram powerpoint slides
Presentation slide is beneficial for staff, clients, managers and event planners. Flexible action button available to perform operations easily. Shapes can be interconnected using connectors and connection pointers. PowerPoint presentation supports filling background in a different color from the text. Presentation icon supports changing the color, size and orientation of any icon to your liking.
-
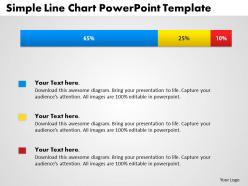 0414 simple bar chart with percentage powerpoint graph
Absolutely editable color scheme and values of PPT graphs. Add your company name, logo, brand-name etc. to personalize. Modify the size and orientation of presentation visuals to suit your requirement. Quick and simple download at your convenience. Original resolution of PPT visuals unaffected after editing. Presentation slide accessible in Standard 4:3 and Widescreen 16:9 view.
-
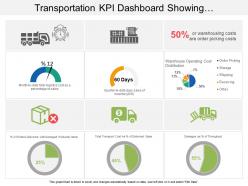 Transportation kpi dashboard snapshot showing warehouse operating cost distribution
Presenting transportation KPI dashboard snapshot showing warehouse operating cost distribution PPT slide. Simple data input like company logo, name or trademark. User can edit the data in linked excel sheet and graphs and charts gets customized accordingly. Picture quality of these slides does not change even when project on large screen. Fast downloading speed and formats can be easily changed to JPEG and PDF applications. This template is suitable for marketing, sales persons, business managers and entrepreneurs.
-
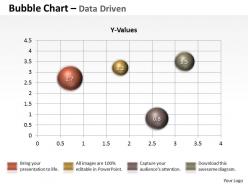 Data driven 3d graphical presentation of data powerpoint slides
We are proud to present our data driven 3d graphical presentation of data powerpoint slides. Our Data Driven 3D Graphical Presentation Of Data Powerpoint Slides Power Point Templates Give You That Extra Zing. Add Your Views And Make Your Audience Sing. Our Pretty Data Driven 3D Graphical Presentation Of Data Powerpoint Slides Power Point Templates Are Like Snowflakes That Fall. Gather Them Together And Have A Ball. Put Your Wondrously Glowing Ideas Into Them. Bind Them Together And Create Mayhem.
-
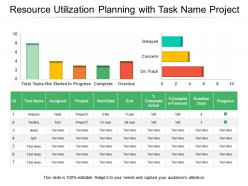 Resource utilization planning with task name project
Presenting this set of slides with name - Resource Utilization Planning With Task Name Project. This is a three stage process. The stages in this process are Resource Management, Resource Utilization, Resource Allocation.
-
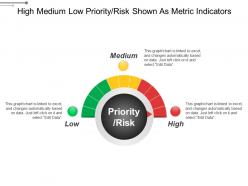 High medium low priority risk shown as metric indicators
Presenting this set of slides with name - High Medium Low Priority Risk Shown As Metric Indicators. This is a three stage process. The stages in this process are High Medium Low, High Moderate Low, Top Medium Low.
-
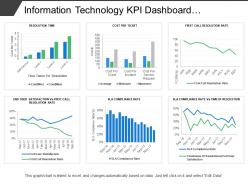 Information technology kpi dashboard showing cost per ticket sla compliance rate
Presenting this set of slides with name - Information Technology Kpi Dashboard Showing Cost Per Ticket Sla Compliance Rate. This is a six stage process. The stages in this process are Information Technology, It, Iot.
-
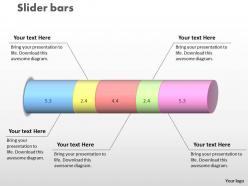 0414 interactive data driven bar chart powerpoint graph
We are proud to present our 0414 interactive data driven bar chart powerpoint graph. Our Interactive Data Driven Bar Chart Powerpoint Graph Powerpoint Templates provide the links in your chain of thought. Once intertwined they enhance the strength of your words. Our Interactive Data Driven Bar Chart Powerpoint Graph Powerpoint Templates are like ingredients in your recipe of sucess. Stir them together and get people licking their lips.
-
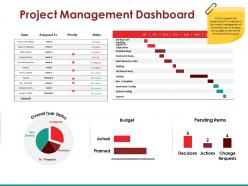 Project management dashboard powerpoint slide ideas
Presenting this set of slides with name - Project Management Dashboard Powerpoint Slide Ideas. This is a four stage process. The stages in this process are Overall Task Status, Budget, Pending Items, Decisions.
-
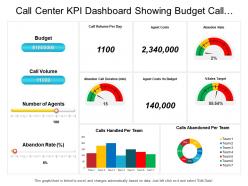 Call center kpi dashboard showing budget call volume agent costs percentage sales target
Presenting this set of slides with name - Call Center Kpi Dashboard Showing Budget Call Volume Agent Costs Percentage Sales Target. This is a four stage process. The stages in this process are Call Center Agent, Customer Care, Client Support.
-
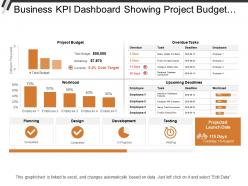 Business kpi dashboard showing project budget overdue tasks and workload
Presenting this set of slides with name - Business Kpi Dashboard Showing Project Budget Overdue Tasks And Workload. This is a two stage process. The stages in this process are Business Dashboard, Business Kpi, Business Performance.
-
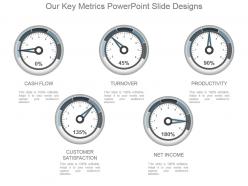 Our key metrics powerpoint slide designs
Presenting our key metrics PowerPoint slide designs. This power point slide offers you plenty of space to put in titles and sub titles. High resolution-based presentation layout does not change the image even after resizing. This presentation icon is fully compatible with Google slides. Quick downloading speed and simple editing options in color text and fonts.PPT icons can easily be changed into JPEG and PDF applications. This diagram has been designed for entrepreneurs, corporate and business managers.
-
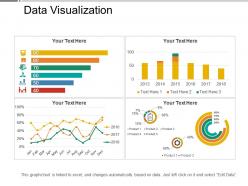 Data visualization
Presenting this Data Visualization PowerPoint slide. This PPT presentation is Google Slides compatible hence it is easily accessible. You can download and save this PowerPoint layout in different formats like PDF, PNG, and JPG. This PPT theme is available in both 4:3 and 16:9 aspect ratios. As this PowerPoint template is 100% editable, you can modify color, font size, font type, and shapes as per your requirements.
-
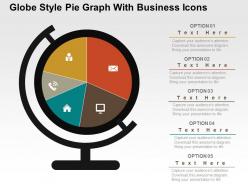 Globe style pie graph with business icons powerpoint slides
We are proud to present our globe style pie graph with business icons powerpoint slides. Graphic of globe style pie graph with business icons has been used to design this power point template diagram. This data driven bar graph can be used to show business data. Use this PPT diagram for business and marketing related presentations.
-
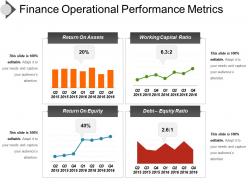 Finance operational performance metrics ppt daigram
Introducing finance operational performance metrics PPT diagram. Exquisitely coordinated PPT design template beneficial for various business professionals. Easily resizable shapes, patterns, and matters etc. Genuine and admissible PPT Image with pliant data options. Adequately compatible with all operating softwares and all Google Slides. Easily convertible to other file formats such as PDF or JPG. Adequate space available to add headings and subheadings. Unaffected high resolution PPT graphic when projected on huge screen.
-
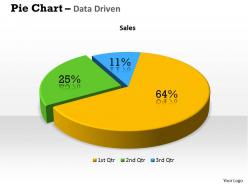 Data driven 3d percentage ratio pie chart powerpoint slides
We are proud to present our data driven 3d percentage ratio pie chart powerpoint slides. You Have All The Ingredients To Create The Taste Of Success. Garnish Your Recipe With Our Data Driven 3D Percentage Ratio Pie Chart Powerpoint Slides Power Point Templates And Enhance Its Flavor. Our Data Driven 3D Percentage Ratio Pie Chart Powerpoint Slides Power Point Templates Are Created By Innovative Young Minds. Guaranteed To Fit Presentations Of All Kinds.
-
 0414 business team bar chart graphics powerpoint graph
PPT template can be watched in Standard and Widescreen view. Presentation slides are compatible with Google slides. Immediate download and sharing. PowerPoint design can be easily modified such as colors, visuals, text, etc. Adaptable template slide as can be converted into JPEG and PDF document. Perfect for marketing managers, sales executives, directors, teachers, etc.
-
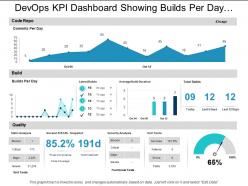 Devops kpi dashboard showing builds per day and code repo
Presenting this set of slides with name - Devops Kpi Dashboard Showing Builds Per Day And Code Repo. This is a three stage process. The stages in this process are Development And Operations, Devops.
-
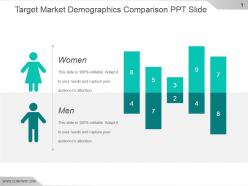 Target market demographics comparison ppt slide
Presenting target market demographics comparison ppt slide. This is a target market demographics comparison ppt slide. This is a two stage process. The stages in this process are women, men.
-
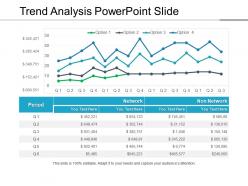 Trend analysis powerpoint slide
Presenting trend analysis PowerPoint template. Access to edit the content, style, size and orientation of the PPT slides. Extremely spacious to cover all the aspects of the company profile. High resolution images do not pixelate when projected on wide screen. Personalize the PPT with your company name and logo. Modify the presentation elements as per the need of an hour. Compatible with numerous software and format options. Used by entrepreneurs, marketers, managerial department, stakeholders and students. Self-explanatory and intellectual slide charts.
-
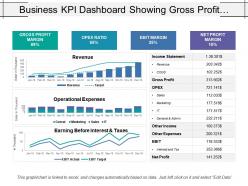 Business kpi dashboard showing gross profit margin opex ratio and ebit margin
Presenting this set of slides with name - Business Kpi Dashboard Showing Gross Profit Margin Opex Ratio And Ebit Margin. This is a three stage process. The stages in this process are Business Dashboard, Business Kpi, Business Performance.
-
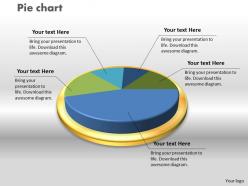 0414 pie chart business design layout powerpoint graph
Widely acceptable PowerPoint by business professionals, students and teachers. Ease of download and thoroughly compatible with formats. Compatible with multiple online and offline software options. High resolution PPT visuals. No fear of hazy visuals when they are stretched on wide screen. Impactful editable slide design. Ease of inclusion and exclusion of content at sole discretion. Freedom to personalize the presentation with company specific name, logo and trademark.
-
 1214 green battery cell with full charging symbol powerpoint slide
We are proud to present our 1214 green battery cell with full charging symbol powerpoint slide. This power point template slide has been designed with graphic of green battery cell with full charging symbol. This PPT slide contains the concept of power technology and energy conservation. Use this PPT slide for your technology related presentations.
-
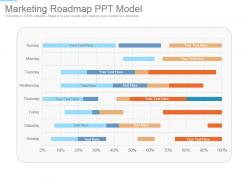 Marketing roadmap ppt model
Presenting, marketing roadmap PPT model PowerPoint Presentation. This is an appealing plan for data presentation and analysis related PowerPoint presentation. This PPT layout can be practiced by professionals from diverse background to present their ideas in a smart way. This slide is compatible with Google slides and can be saved in JPG/PDF formats, after downloading you can use it in full version and incorporate your company's logo for your best experience.
-
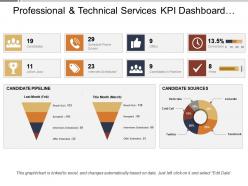 Professional and technical services kpi dashboard showing recruitment and hiring
Presenting this set of slides with name - Professional And Technical Services Kpi Dashboard Showing Recruitment And Hiring. This is a four stage process. The stages in this process are Professional And Technical Services, Services Management, Technical Management.
-
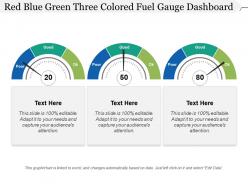 Red blue green three colored fuel gauge dashboard
Presenting this set of slides with name - Red Blue Green Three Colored Fuel Gauge Dashboard. This is a three stage process. The stages in this process are Fuel Gauge, Gas Gauge, Fuel Containers.
-
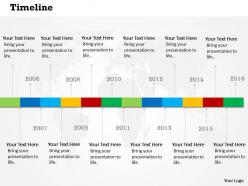 0514 creative business time line diagram powerpoint slides
We are proud to present our 0514 creative business time line diagram powerpoint slides. A creative business time line diagram is used in this Business Power Point template. Show all kind of result analysis in any presentation by using this template.
-
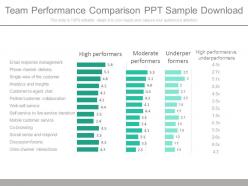 Team performance comparison ppt sample download
Presenting team performance comparison PPT slide. Access to download and save in the JPG or PDF format. Convenient to be used on a wide screen view. No effect on the picture quality whatever be the size of your screen. Useful for industry professionals, managers, executives, researchers, sales people, etc. Edit the size, style and orientation of the visuals and shapes. Follow given instructions to modify the slide template. The slide offers easy and effortless modification. Compatible with Google slides also.
-
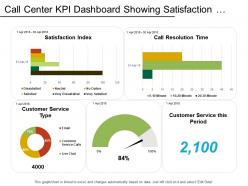 Call center kpi dashboard showing satisfaction index customer retention
Presenting this set of slides with name - Call Center Kpi Dashboard Showing Satisfaction Index Customer Retention. This is a five stage process. The stages in this process are Call Center Agent, Customer Care, Client Support.
-
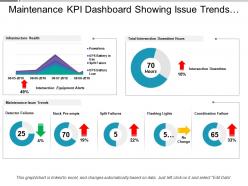 Maintenance kpi dashboard showing issue trends and infrastructure health
Presenting this set of slides with name - Maintenance Kpi Dashboard Showing Issue Trends And Infrastructure Health. This is a three stage process. The stages in this process are Maintenance, Preservation, Conservation.
-
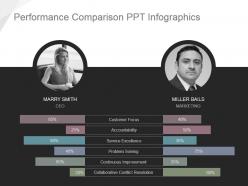 Performance comparison ppt infographics
Presenting performance comparison ppt infographics. This is a performance comparison ppt infographics. This is a two stage. The Stages in this process are customer focus, accountability, service excellence, problem solving, continuous improvement, collaborative conflict resolution.
-
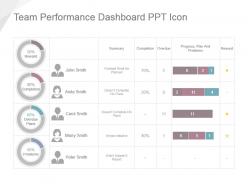 Team performance dashboard snapshot ppt icon
Presenting team performance dashboard ppt icon. This is a team performance dashboard snapshot ppt icon. This is a four stage. The Stages in this process are john smith, anita smith, carol smith, marry smith, peter smith, reward, completion, overdue plans, problems, summary, finished what he planned, doesn?t complete his plans, doesnt complete his plans, shows initiative, didnt submit a report, completion, overdue, progress, plan and problems, reward.
-
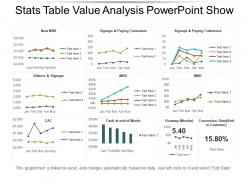 Stats table value analysis powerpoint show
Presenting stats table value analysis PowerPoint show. This layout offers you plenty of space to put in titles and sub titles. High resolution-based layout, does not change the image even after resizing. This presentation icon is fully compatible with Google slides. Quick downloading speed and simple editing options in color text and fonts.PPT icons can easily be changed into JPEG and PDF applications. This diagram has been designed for entrepreneurs, corporate and business managers. Easy to use, edit and you can design attractive slides within few minutes.
-
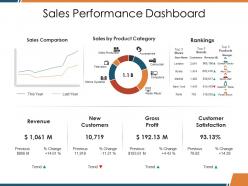 Sales performance dashboard snapshot ppt deck
Presenting this set of slides with name - Sales Performance Dashboard Snapshot Ppt Deck. This is a two stage process. The stages in this process are Revenue, New Customers, Gross, Profit, Customer Satisfaction, Sales Comparison.
-
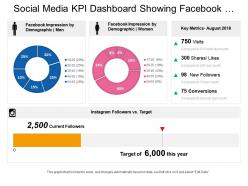 Social media kpi dashboard showing facebook impression by demographic instagram key metrics
Presenting this set of slides with name - Social Media Kpi Dashboard Showing Facebook Impression By Demographic Instagram Key Metrics. This is a four stage process. The stages in this process are Social Media, Digital Marketing, Social Marketing.
-
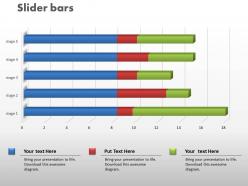 0414 slider time series bar chart powerpoint graph
We are proud to present our 0414 slider time series bar chart powerpoint graph. Our Slider Time Series Bar Chart Powerpoint Graph Powerpoint Templates give you the basic framework of your talk. Give it the shape you desire with your wonderful views. Our Slider Time Series Bar Chart Powerpoint Graph Powerpoint Templates are the lungs of your talk. Fill them with the oxygen of your indepth thought process.
-
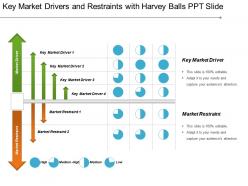 Key market drivers and restraints with harvey balls ppt slide
Presenting key market drivers and restraints with harvey balls PPT slide which is completely editable. This presentation is data driven, it can be customized and personalized. It is compatible with Google Slides and numerous format options. The graphics and icons used in this PPT slides are of high quality, definition and the visuals do not pixelate when projected on a wide screen and the editing instructions are also provided for your kind assistance.
-
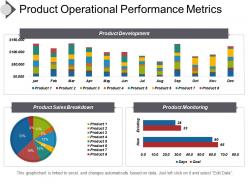 Product operational performance metrics presentation visuals
Easily editable as color, text and layout are editable as required. Presentation template is accessible in similar designs with different nodes and stages. PowerPoint slide is attainable in standard and widescreen view. Precise download and can be easily integrate in the presentation. PPT design is downloadable with different nodes and stages. Presentation graphic is designed with high quality resolution design. Presentation diagram is well familiar with Google slides and can be merged with them.


