0414 slider bar chart for visual analysis powerpoint graph
Put your wonderful verbal artistry on display. Our 0414 Slider Bar Chart For Visual Analysis Powerpoint Graph will provide you the necessary glam and glitter.
- Google Slides is a new FREE Presentation software from Google.
- All our content is 100% compatible with Google Slides.
- Just download our designs, and upload them to Google Slides and they will work automatically.
- Amaze your audience with SlideTeam and Google Slides.
-
Want Changes to This PPT Slide? Check out our Presentation Design Services
- WideScreen Aspect ratio is becoming a very popular format. When you download this product, the downloaded ZIP will contain this product in both standard and widescreen format.
-

- Some older products that we have may only be in standard format, but they can easily be converted to widescreen.
- To do this, please open the SlideTeam product in Powerpoint, and go to
- Design ( On the top bar) -> Page Setup -> and select "On-screen Show (16:9)” in the drop down for "Slides Sized for".
- The slide or theme will change to widescreen, and all graphics will adjust automatically. You can similarly convert our content to any other desired screen aspect ratio.
Compatible With Google Slides

Get This In WideScreen
You must be logged in to download this presentation.
PowerPoint presentation slides
We are proud to present our 0414 slider bar chart for visual analysis powerpoint graph. Our great team has conjured up a web of Slider Bar Chart For Visual Analysis Powerpoint Graph Powerpoint Templates. Use them to string together your glistening ideas. Think of it and be sure we have it. Our Slider Bar Chart For Visual Analysis Powerpoint Graph Powerpoint Templates offer you the widest possible range of options.
People who downloaded this PowerPoint presentation also viewed the following :
Content of this Powerpoint Presentation
Description:
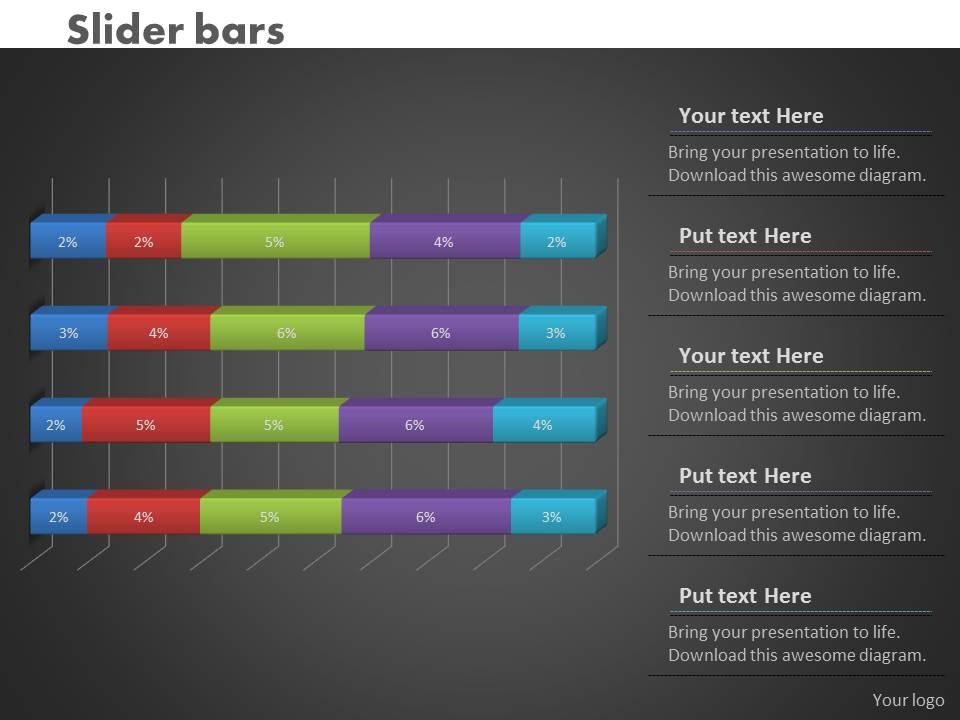
This image is a PowerPoint slide featuring a horizontal slider bar chart, designed for visual analysis. It contains four sets of color-coded slider bars with percentage values, indicating different quantities or metrics. Each bar has a placeholder for text, suggesting that the template can be customized to represent specific data points or categories. The right side of the slide has additional text boxes for descriptive content, providing context to the presented data. The bottom of the slide has a placeholder for a logo, making it suitable for brand-specific presentations.
Use Cases:
This type of slide is versatile and can be employed in a variety of industries for data representation and analysis.
1. Finance:
Use: Displaying budget allocation or financial forecasting.
Presenter: Financial Analyst.
Audience: Management, investors.
2. Sales:
Use: Illustrating sales distribution across regions or products.
Presenter: Sales Manager.
Audience: Sales team, stakeholders.
3. Healthcare:
Use: Showing patient demographics or treatment efficacy rates.
Presenter: Healthcare Administrator.
Audience: Medical staff, policy makers.
4. Retail:
Use: Comparing store performance or category sales percentages.
Presenter: Retail Analyst.
Audience: Store managers, marketing team.
5. Education:
Use: Visualizing student performance metrics or departmental funding.
Presenter: Academic Researcher.
Audience: Educators, administration.
6. Marketing:
Use: Presenting campaign reach or engagement levels across channels.
Presenter: Marketing Director.
Audience: Marketing department, clients.
7. Human Resources:
Use: Analyzing workforce distribution or departmental headcounts.
Presenter: HR Manager.
Audience: HR team, executive leadership.
0414 slider bar chart for visual analysis powerpoint graph with all 3 slides:
Handle team dynamics with our 0414 Slider Bar Chart For Visual Analysis Powerpoint Graph. Get everyone to function efficiently.
-
Informative presentations that are easily editable.
-
Design layout is very impressive.


