Dashboard PowerPoint Slides, KPi Dashboard PPT Templates
- Sub Categories
-
- 30 60 90 Day Plan
- About Us Company Details
- Action Plan
- Agenda
- Annual Report
- Audit Reports
- Balance Scorecard
- Brand Equity
- Business Case Study
- Business Communication Skills
- Business Plan Development
- Business Problem Solving
- Business Review
- Capital Budgeting
- Career Planning
- Change Management
- Color Palettes
- Communication Process
- Company Location
- Company Vision
- Compare
- Competitive Analysis
- Corporate Governance
- Cost Reduction Strategies
- Custom Business Slides
- Customer Service
- Dashboard
- Data Management
- Decision Making
- Digital Marketing Strategy
- Digital Transformation
- Disaster Management
- Diversity
- Equity Investment
- Financial Analysis
- Financial Services
- Financials
- Growth Hacking Strategy
- Human Resource Management
- Innovation Management
- Interview Process
- Knowledge Management
- Leadership
- Lean Manufacturing
- Legal Law Order
- Management
- Market Segmentation
- Marketing
- Media and Communication
- Meeting Planner
- Mergers and Acquisitions
- Metaverse
- Newspapers
- Operations and Logistics
- Organizational Structure
- Our Goals
- Performance Management
- Pitch Decks
- Pricing Strategies
- Process Management
- Product Development
- Product Launch Ideas
- Product Portfolio
- Project Management
- Purchasing Process
- Quality Assurance
- Quotes and Testimonials
- Real Estate
- Risk Management
- Sales Performance Plan
- Sales Review
- SEO
- Service Offering
- Six Sigma
- Social Media and Network
- Software Development
- Solution Architecture
- Stock Portfolio
- Strategic Management
- Strategic Planning
- Supply Chain Management
- Swimlanes
- System Architecture
- Team Introduction
- Testing and Validation
- Thanks-FAQ
- Time Management
- Timelines Roadmaps
- Value Chain Analysis
- Value Stream Mapping
- Workplace Ethic
-
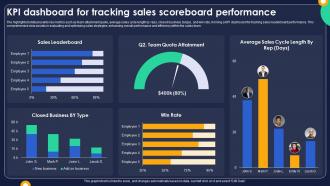 KPI Dashboard For Tracking Sales Scoreboard Performance
The highlighted slide presents key metrics such as team attainment quote, average sales cycle length by reps, closed business by type, and win rate, forming a KPI dashboard for tracking sales leaderboard performance. This comprehensive view assists in evaluating and optimizing sales strategies, enhancing overall performance and efficiency within the sales team. Presenting our well structured KPI Dashboard For Tracking Sales Scoreboard Performance. The topics discussed in this slide are Tracking, Sales, Performance. This is an instantly available PowerPoint presentation that can be edited conveniently. Download it right away and captivate your audience.
-
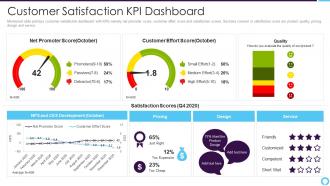 Partner relationship management customer satisfaction kpi dashboard
Mentioned slide portrays customer satisfaction dashboard with KPIs namely net promoter score, customer effort score and satisfaction scores. Sections covered in satisfaction score are product quality, pricing, design and service. Deliver an outstanding presentation on the topic using this Partner Relationship Management Customer Satisfaction Kpi Dashboard. Dispense information and present a thorough explanation of Customer Satisfaction Kpi Dashboard using the slides given. This template can be altered and personalized to fit your needs. It is also available for immediate download. So grab it now.
-
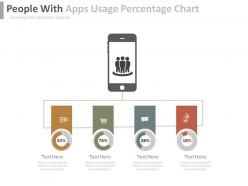 Phone with apps usage percentage chart powerpoint slides
Useful for start-ups in the app business. Potential for use as a marketing device. PPT icons highly alterable. Change icon colors and size at your will and according to target audience. Aesthetic Infographics with proportionate placement of elements. Ability to view Presentation slides in widescreen. Straightforward conversion to JPG and PDF formats. Slides compatible with google slides.
-
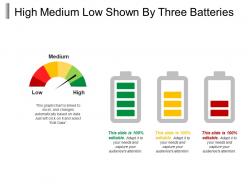 High medium low shown by three batteries
Presenting this set of slides with name - High Medium Low Shown By Three Batteries. This is a two stage process. The stages in this process are High Medium Low, High Moderate Low, Top Medium Low.
-
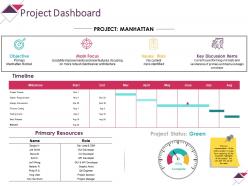 Project dashboard powerpoint slide influencers
Presenting this set of slides with name - Project Dashboard Powerpoint Slide Influencers. This is a four stage process. The stages in this process are Main Focus, Objective, Issues Risks, Key Discussion Items, Dashboard.
-
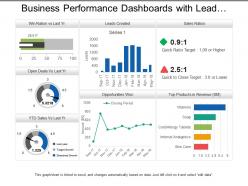 Business performance dashboards with lead creation and sales ratios
Presenting, business performance dashboards with lead creation and sales ratios for cost efficiency and performance indication PPT presentation. Bright and informative PowerPoint presentation slides. Gives regulations to achieve business success and targets. Produces error-free execution. Acts as a model for planning future assignments for marketing capabilities. Fully editable by any user at any point in time. Performs a clarity of marketing and presentation objectives without creating any confusions and misconceptions. Simple to be projected to widescreen without degradation in quality.
-
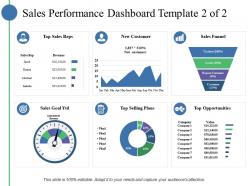 Sales performance dashboard top sales reps new customer
Introducing sales performance dashboard top sales reps new customer PowerPoint template. Presentation slides are crafted with high quality resolution designs. PPT templates comes in standard and widescreen view. Instant download and can be converted into other formats i.e. JPEG and PDF. Perfect for business management experts and research development team. Replace the watermark with your company’s logo. Possess time saving qualities. Presentation slides are well-matched with Google slides. Fast download and effortlessly inclusion in your presentation.
-
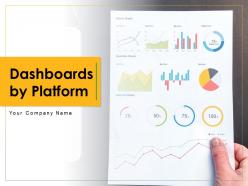 Dashboards Snapshot By Platform Powerpoint Presentation Slides
Introducing Dashboards Snapshot By Platform PowerPoint Presentation Slides. This is a complete PPT deck that comprises 27 professionally designed slides. You can edit them as per your convenience as they are 100% customizable. This PowerPoint slideshow is compatible with Google Slides. You may also convert and save the PPT in PDF, PNG, and JPG formats. Moreover, this presentation features a dual-screen aspect ratio and is a perfect fit for standard and widescreen.
-
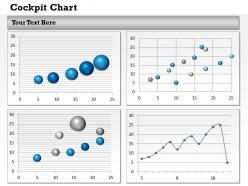 0314 performance dashboards for business
Professionally crafted PowerPoint designs. Ease to share the Presentation slide in standard and widescreen view. PPT slides are wholly compatible with Google slides. Include or exclude business name, logo and icon possible. Beneficial for business professionals, students, teachers, scientists, business analysts and strategists. Can be easily merged with ongoing presentations. Compatible with Google slides as well.
-
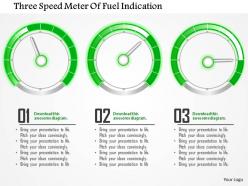 0115 three speed meter of fuel indication powerpoint template
Extremely beneficial for professionals working in mechanical or technological field. The format of the slide can be easily changed into PDF or JPEG. Great compatibility with Google slides and other softwares. Easily customisable in terms of color, font and size allowing user to have pin-point control. High definition graphics do not pixelate when projected on bigger screen. Company logo or trademark can be easily introduced within the template.
-
 Hospitality Management KPI And Dashboard Powerpoint Presentation Slides
This complete deck focuses on Hospitality Management KPI And Dashboard Powerpoint Presentation Slides and consists of professionally designed templates with suitable graphics and appropriate content. Our designers have created customizable templates for your convenience. You can make the required changes in the templates like color, text and font size. Other than this, content can be added or deleted from the slide as per the requirement. The templates are compatible with Google Slides so it can be easily accessible. It can be saved into various file formats like PDF, JPG. And PNG. It is available in both standard and widescreen formats.
-
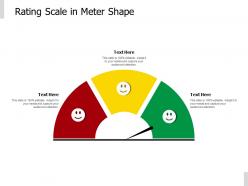 Rating scale in meter shape
Presenting this set of slides with name Rating Scale In Meter Shape. This is a three stage process. The stages in this process are Product Improvement, Rating Scale, Product Quality. This is a completely editable PowerPoint presentation and is available for immediate download. Download now and impress your audience.
-
 Rating meter monitoring performance risk assessment credit score
If you require a professional template with great design, then this Rating Meter Monitoring Performance Risk Assessment Credit Score is an ideal fit for you. Deploy it to enthrall your audience and increase your presentation threshold with the right graphics, images, and structure. Portray your ideas and vision using twelve slides included in this complete deck. This template is suitable for expert discussion meetings presenting your views on the topic. With a variety of slides having the same thematic representation, this template can be regarded as a complete package. It employs some of the best design practices, so everything is well-structured. Not only this, it responds to all your needs and requirements by quickly adapting itself to the changes you make. This PPT slideshow is available for immediate download in PNG, JPG, and PDF formats, further enhancing its usability. Grab it by clicking the download button.
-
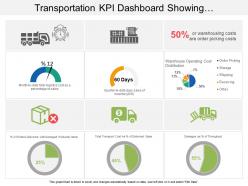 Transportation kpi dashboard snapshot showing warehouse operating cost distribution
Presenting transportation KPI dashboard snapshot showing warehouse operating cost distribution PPT slide. Simple data input like company logo, name or trademark. User can edit the data in linked excel sheet and graphs and charts gets customized accordingly. Picture quality of these slides does not change even when project on large screen. Fast downloading speed and formats can be easily changed to JPEG and PDF applications. This template is suitable for marketing, sales persons, business managers and entrepreneurs.
-
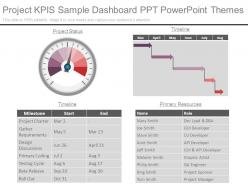 Project kpis sample dashboard snapshot ppt powerpoint themes
Fully editable project KPIs sample dashboard snapshot PPT template. Creates an eye-opening effect of the viewers. Easy and convenient downloading. Editable visuals, icons, colors and text. Privilege of insertion of logo and trademarks for more personalization. Easy to download and save. Easy to edit and customize as per your needs. Beneficial for industry professionals, technologists, managers, executives, researchers, sales people, etc. Flexible presentation designs can be presented in standard and widescreen view. They have a futuristic and realistic approach.
-
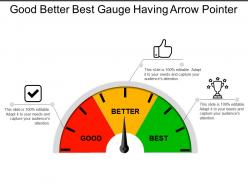 Good better best gauge having arrow pointer
Presenting this set of slides with name - Good Better Best Gauge Having Arrow Pointer. This is a three stage process. The stages in this process are Good Better Best, Good Great Superb, Good Great Excellent.
-
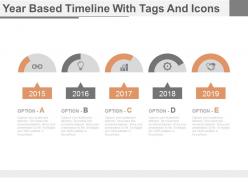 Year based timeline with tags and icons powerpoint slides
Highly customizable slides catering to businessmen and working professionals alike. Easily compatible with google slides for ease of access. PPT templates available in widescreen for different viewing platforms. Facility to convert the slides into PDF or JPG formats. To the point data with appropriate use of highly stylized tags and icons. Neat presentation visuals depicting year by year progress.
-
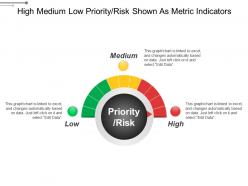 High medium low priority risk shown as metric indicators
Presenting this set of slides with name - High Medium Low Priority Risk Shown As Metric Indicators. This is a three stage process. The stages in this process are High Medium Low, High Moderate Low, Top Medium Low.
-
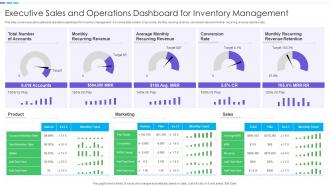 Executive Sales And Operations Dashboard Snapshot For Inventory Management
This slide covers executive sales and operations dashboard snapshot for inventory management. It involves total number of accounts, monthly recuring revenue, conversion rate and monthly recurring revenue retention rate. Introducing our Executive Sales And Operations Dashboard For Inventory Management set of slides. The topics discussed in these slides are Monthly Recurring Revenue, Conversion Rate, Recurring Revenue Retention. This is an immediately available PowerPoint presentation that can be conveniently customized. Download it and convince your audience.
-
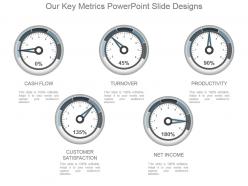 Our key metrics powerpoint slide designs
Presenting our key metrics PowerPoint slide designs. This power point slide offers you plenty of space to put in titles and sub titles. High resolution-based presentation layout does not change the image even after resizing. This presentation icon is fully compatible with Google slides. Quick downloading speed and simple editing options in color text and fonts.PPT icons can easily be changed into JPEG and PDF applications. This diagram has been designed for entrepreneurs, corporate and business managers.
-
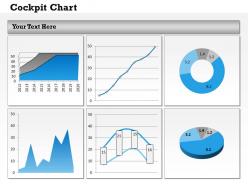 0314 organize business data in dashboard
Results and data oriented slides. Slide can be easily inserted in an ongoing presentation. These are compatible with Google framework. These do not need much time and effort for their operation. Choice to get presentation design in Standard and Widescreen view. Useful for business and corporate houses. Inclusion or exclusion of desired data and text. PowerPoint template has extraordinary quality to impose a long-lasting impression.
-
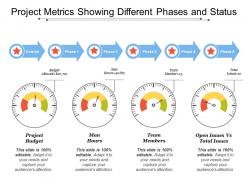 Project metrics showing different phases and status
Presenting this set of slides with name - Project Metrics Showing Different Phases And Status. This is a four stage process. The stages in this process are Project Kpis, Project Dashboard, Project Metrics.
-
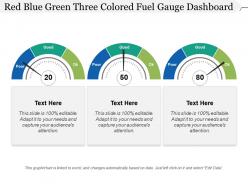 Red blue green three colored fuel gauge dashboard
Presenting this set of slides with name - Red Blue Green Three Colored Fuel Gauge Dashboard. This is a three stage process. The stages in this process are Fuel Gauge, Gas Gauge, Fuel Containers.
-
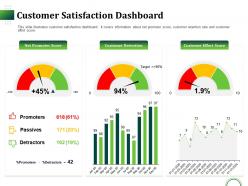 Customer satisfaction dashboard snapshot ppt powerpoint presentation show
This slide illustrates customer satisfaction dashboard. It covers information about net promoter score customer retention rate and customer effort score. Presenting this set of slides with name Customer Satisfaction Dashboard Snapshot Ppt Powerpoint Presentation Show. This is a three stage process. The stages in this process are Net Promoter Score, Customer Retention, Customer Effort Score. This is a completely editable PowerPoint presentation and is available for immediate download. Download now and impress your audience.
-
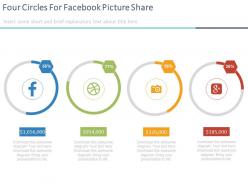 Four circles for facebook picture share google plus services powerpoint slides
Very useful for small and large businesses. Highly impactful and Customizable text, color, images and infographics. Crisp PPT Presentation examples giving you the ability to amend its features for specific use. PPT example slides fully compatible with google slides. Easy to comprehend, user friendly Infographics for impact. Option to view PPT sample slide in widescreen. Convert slides to JPG and PDF easily.
-
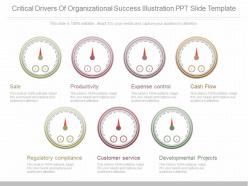 Use critical drivers of organizational success illustration ppt slide template
Presenting use critical drivers of organizational success illustration PPT slide template. The template has been professionally outlined and is fully editable in PowerPoint. You can alter the font type, font dimension, colors of the graphics. Individualize the slide by inserting your brand logo, name or signature. The dummy content in text placeholders can be replaced with your presentation information. The template is fully flexible with Google Slides and other online applications. High-quality graphics and symbols ensure that there is no deteriorating in quality on expending their size. A quick download of the template.
-
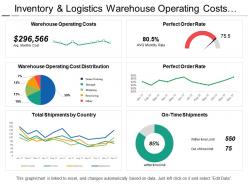 Inventory and logistics warehouse operating costs dashboard
Presenting inventory and logistics warehouse operating costs dashboard PPT slideshow. Editable charts, visuals, colors and text. Presentable and easy to comprehend info graphic format. The presentation template can be downloaded and saved in any desired format. Privilege of insertion of logo and trademarks for more personalization. Adaptable to wide screen view without the problem of pixilation. Can be used with Google slides. Easy to edit and customize as per your needs. Beneficial for industry professionals, managers, executives, researchers, sales people, etc.
-
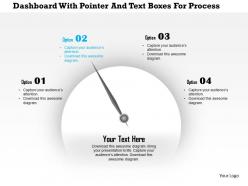 1214 dashboard with pointer and text boxes for process control powerpoint presentation
Adaptable PPT slides as compatible with Google slides. Choice to view PowerPoint design in standard and widescreen view. Fully editable Presentation diagrams that can be edited as needed. Easy to download and insert in the ongoing presentation. Convertible into Jpeg and Pdf document. Suitable for managers, leaders, sales and marketing people, analysts, etc.
-
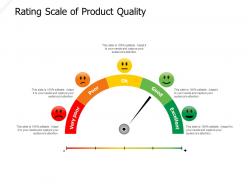 Rating scale of product quality
Presenting this set of slides with name Rating Scale Of Product Quality. This is a five stage process. The stages in this process are Product Improvement, Rating Scale, Product Quality. This is a completely editable PowerPoint presentation and is available for immediate download. Download now and impress your audience.
-
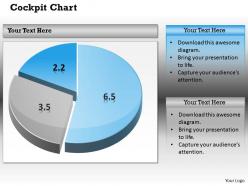 0314 pie chart dashborad design
Makes the information clear in the mind of the audience. Editable visuals, colors and text. Easy to edit and customize as per your needs. Beneficial for industry professionals, technologists, managers, executives, researchers, sales people, etc. Flexible presentation designs can be presented in standard and widescreen view. Has a futuristic and realistic approach. Privilege of insertion of logo and trademarks for more personalization.
-
 Meter design for segmentation strategy powerpoint slides
Customized Presentation design which can be employed in business meetings and other occasions where strategic decisions are involved. Easy compatibility with google slides for more presentation access. PPT templates available in widescreen for numerous viewing platforms. Provision for conversion of slides into PDF or JPG formats. Well-ordered presentation with options to edit slide elements like icon color, shape and size.
-
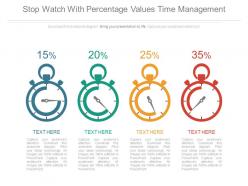 Four stop watches with percentage values time management powerpoint slides
PPT slides are well-matched with Google slides. Multiple display options i.e. standard and widescreen view. 100% editable PowerPoint templates changing color, text and font is possible. Quick to download and share. Flexibility to convert into JPEG and PDF document. Perfect for business professionals, managers, executives, students etc.
-
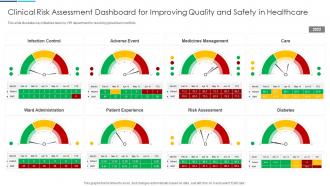 Clinical Risk Assessment Dashboard For Improving Quality And Safety In Healthcare
This slide illustrates key initiatives taken by HR department for resolving global team conflicts. Introducing our Clinical Risk Assessment Dashboard For Improving Quality And Safety In Healthcare set of slides. The topics discussed in these slides are Clinical Risk Assessment Dashboard For Improving Quality And Safety In Healthcare. This is an immediately available PowerPoint presentation that can be conveniently customized. Download it and convince your audience.
-
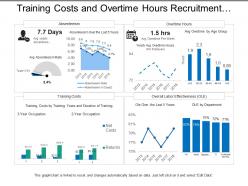 Training costs and overtime hours recruitment dashboard
Presenting this set of slides with name - Training Costs And Overtime Hours Recruitment Dashboard. This is a four stage process. The stages in this process are Staffing Plan, Recruitment, Staff Management.
-
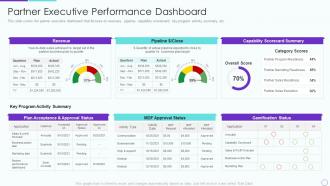 Partner relationship management prm partner executive performance dashboard
This slide covers the partner executive dashboard that focuses on revenues, pipeline, capability scoreboard, key program activity summary, etc. Present the topic in a bit more detail with this Partner Relationship Management PRM Partner Executive Performance Dashboard. Use it as a tool for discussion and navigation on Key Program Activity Summary, Capability Scorecard Summary, Gamification Status, Mdf Approval Status, Revenue. This template is free to edit as deemed fit for your organization. Therefore download it now.
-
 See transform your business ppt presentation
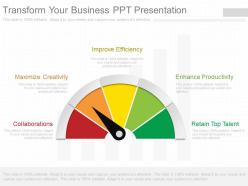
Presentation icon supports the use of color, size and orientation according to one’s requirement. PPT design is in tune with 32 or 64 bit windows and MAC OS. Predesigned symbols and text holders well braced by PPT graphic. Friendly design used by businessmen and professionals. No additional software, application or Photoshop required for editing the PPT slide.The stages in this process are collaborations, maximize creativity, improve efficiency, enhance productivity, retain top talent.
-
 KPI Dashboard To Evaluate Effectiveness Achieving Higher ROI With Brand Development
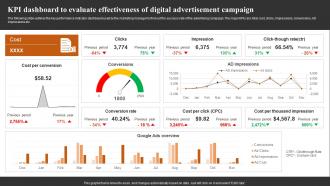
The following slide outlines the key performance indicator dashboard used by the marketing manager to find out the success rate of the advertising campaign. The major KPIs are total cost, clicks, impressions, conversions, AD impressions etc. Present the topic in a bit more detail with this KPI Dashboard To Evaluate Effectiveness Achieving Higher ROI With Brand Development. Use it as a tool for discussion and navigation on Clicks, Impression, Click Though Rate. This template is free to edit as deemed fit for your organization. Therefore download it now.
-
 Sales dashboard snapshot ppt inspiration
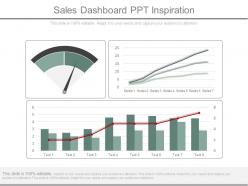
Presenting sales dashboard ppt inspiration. This is a sales dashboard snapshot ppt inspiration. This is a three stage process. The stages in this process are sales, dashboard, business, management, strategy.
-
 0314 mind dashboard solution concept
Useful for advertising companies and professionals working in marketing departments. Runs efficiently with softwares and is compatible with Google slides. No space constraints for adding titles and sub-titles. Amendable PPT layout with respect to orientation. Customisable font text, design and color schemes. Easily convertible into JPEG and PDF formats. Does not occupy much space and is quick to download. High resolution picture graphics never pixilate on bigger screens.
-
 Partner executive performance dashboard managing strategic partnerships
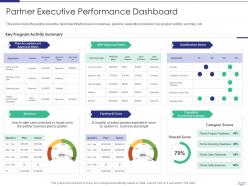
This slide covers the partner executive dashboard that focuses on revenues, pipeline, capability scoreboard, key program activity summary, etc. Present the topic in a bit more detail with this Partner Executive Performance Dashboard Managing Strategic Partnerships. Use it as a tool for discussion and navigation on Revenue, Pipeline Dollar Close, Capability Scorecard Summary, Gamification Status. This template is free to edit as deemed fit for your organization. Therefore download it now.
-
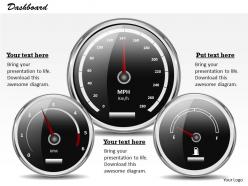 0314 dashboard design to communicate effectively
Businessmen, finance, sales, retailing, accounting and service sector departments can quickly put to use the PPT visual. Can be optimized and seen in tablets, phone, widescreen monitors, and projector covers. Congenial with Google slides. Reformation into PDF or JPG formats is very easy and helpful in PowerPoint presentation. PPT slide is harmonious with google slide. High resolution is delivered by presentation slide show when seen on large screen projectors.
-
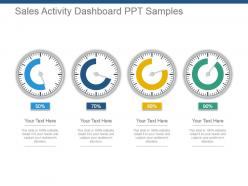 Sales activity dashboard snapshot ppt samples
Presenting sales activity dashboard snapshot ppt samples. This is a sales activity dashboard ppt samples. This is a four stage process. The stages in this process are sales, activity, dashboard, financial, strategy.
-
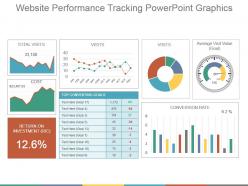 Website performance tracking powerpoint graphics
Presenting website performance tracking powerpoint graphics. This is a website performance tracking powerpoint graphics. This is a three stage process. The stages in this process are total visits, conversion rate, return on investment, average visit value.
-
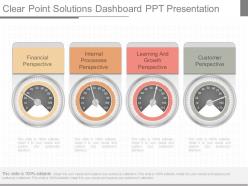 One clear point solutions dashboard snapshot ppt presentation
Adjust the substance at your own solace and need. Customize it with your organization name and logo. Download and spare the introduction in wanted organization. Perfect with wide assortment of on the web and disconnected programming choices. Plenty of professionally made slides. Completely editable PowerPoint introduction. Material by human asset branch of a few associations alongside business people and administrative understudies.The stages in this process are financial perspective, internal processes perspective, learning and growth perspective, customer perspective.
-
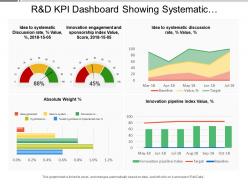 R and d kpi dashboard showing systematic discussion rate innovation engagement and sponsorship index
Presenting this set of slides with name - R And D Kpi Dashboard Showing Systematic Discussion Rate Innovation Engagement And Sponsorship Index. This is a four stage process. The stages in this process are R And D, Research And Development, Research And Technological Development.
-
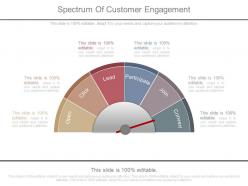 Spectrum of customer engagement ppt presentation
Presenting spectrum of customer engagement ppt presentation. This is a spectrum of customer engagement ppt presentation. This is a six stage process. The stages in this process are open, click, lead, participate, join, convert.
-
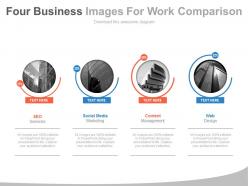 Four business images for work comparison powerpoint slides
Completely editable PowerPoint slides including fonts, text, colors. Presentation design can be displayed in standard and widescreen view. PPT template is fully editable to allow customization. Simple to download and convert into PDF format. Suitable for small and large scale organizations. Compatible with number of software options. Personalize the presentation with individual company name and logo. Excellence in picture quality. Suitable for research and development team, business planners, corporate team leaders and managers.
-
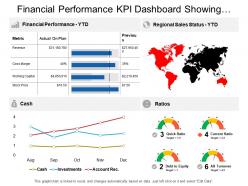 Financial performance kpi dashboard showing regional sales status cash and ratios
Presenting this set of slides with name - Financial Performance Kpi Dashboard Showing Regional Sales Status Cash And Ratios. This is a four stage process. The stages in this process are Financial Performance, Financial Report, Financial Review.
-
 Project Schedule And Time Management Icon
Introducing our premium set of slides with Project Schedule And Time Management Icon. Elucidate the three stages and present information using this PPT slide. This is a completely adaptable PowerPoint template design that can be used to interpret topics like Project Schedule, Time Management, Icon. So download instantly and tailor it with your information.
-
 Rating scale of credit score
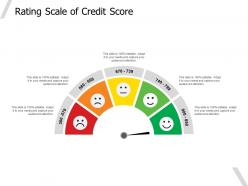
Presenting this set of slides with name Rating Scale Of Credit Score. This is a five stage process. The stages in this process are Product Improvement, Rating Scale, Product Quality. This is a completely editable PowerPoint presentation and is available for immediate download. Download now and impress your audience.
-
 Digital Marketing Report With Performance Rate
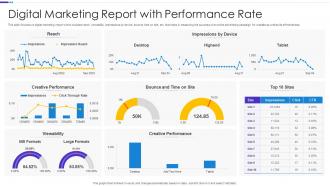
This slide focuses on digital marketing report which includes reach, viewability, impressions by device, bounce ,time on site, etc. that helps in measuring the success of an online advertising campaign for website as well as its effectiveness. Introducing our Digital Marketing Report With Performance Rate set of slides. The topics discussed in these slides are Impressions, Bounce And Time On Site, Creative Performance. This is an immediately available PowerPoint presentation that can be conveniently customized. Download it and convince your audience.
-
 0115 graphic of speedometer with year 2015 powerpoint template
Thoroughly editable PowerPoint slide design. Impressive depiction of speedometer visual. Ease of addition and exclusion of content as per individual preference. Freedom to personalize the slide content with company specific name, logo or trademark. Harmonious set of slides with multiple format options. Harmonious with multiple software options. High resolution visual do not get blurred when projected on wide screen.
-
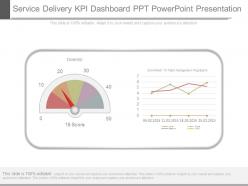 Service delivery kpi dashboard snapshot ppt powerpoint presentation
Presenting service delivery kpi dashboard snapshot ppt powerpoint presentation. This is a service delivery kpi dashboard ppt powerpoint presentation. This is a two stage process. The stages in this process are diversity, commitment to talent management progress.
-
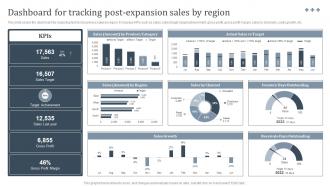 Dashboard For Tracking International Strategy To Expand Global Strategy SS V
This slide covers the dashboard for analyzing fast food business sales by region. It includes KPIs such as sales, sales target, target achievement, gross profit, gross profit margin, sales by channels, sales growth, etc. Deliver an outstanding presentation on the topic using this Dashboard For Tracking International Strategy To Expand Global Strategy SS V. Dispense information and present a thorough explanation of Tracking, Sales, Actual using the slides given. This template can be altered and personalized to fit your needs. It is also available for immediate download. So grab it now.
-
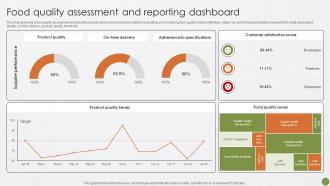 Food Quality Assessment And Reporting Food Quality Best Practices For Food Quality And Safety Management
This slide presents a food quality assessment and reporting dashboard to present real-time data for evaluating and monitoring food quality metrics effectively. Major key performance indicators covered in the slide are product, quality, on time, delivery, product, quality, trends etc. Present the topic in a bit more detail with this Food Quality Assessment And Reporting Food Quality Best Practices For Food Quality And Safety Management. Use it as a tool for discussion and navigation on Product Quality Trends, Customer Satisfaction Score, Food Quality Issues. This template is free to edit as deemed fit for your organization. Therefore download it now.
-
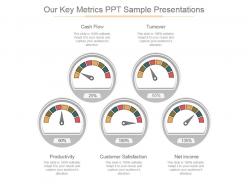 Our key metrics ppt sample presentations
Presenting our key metrics ppt sample presentations. This is a our key metrics ppt sample presentations. This is a five stage process. The stages in this process are cash flow, turnover, net income, customer satisfaction, productivity.
-
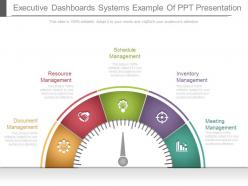 Executive dashboards systems example of ppt presentation
Presenting executive dashboards systems example of ppt presentation. This is a executive dashboards systems example of ppt presentation. This is a five stage process. The stages in this process are document management, resource management, schedule management, inventory management, meeting management.
-
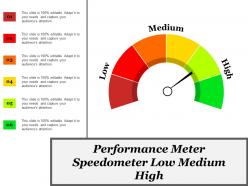 Performance meter speedometer low medium high
Presenting, the performance meter speedometer PowerPoint Presentation Slide. This Presentation has been designed professionally and is fully editable. You can personalize font size, font type, colors, and even the background. This Template is obedient with Google Slide and can be saved in JPG or PDF format without any hassle. Fast download at the click of the button.
-
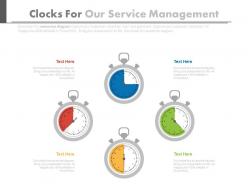 Four clocks for our service management powerpoint slides
Well-crafted and professionally equipped PowerPoint visual. Ease of editing every component of the PPT template. Guidance for executing the changes has been provided for assistance. Modify and personalize the presentation by including the company name and logo. Compatible with varied number of format options. Compatible with multiple software options available both online and offline. Perfect for business strategists, sales and marketing team, customer service team and entrepreneurs.
-
 Financial ratio kpi dashboard showing liquidity ratio analysis current ratio and quick ratio
Presenting this set of slides with name - Financial Ratio Kpi Dashboard Showing Liquidity Ratio Analysis Current Ratio And Quick Ratio. This is a three stage process. The stages in this process are Accounting Ratio, Financial Statement, Financial Ratio.


