Dashboard PowerPoint Slides, KPi Dashboard PPT Templates
- Sub Categories
-
- 30 60 90 Day Plan
- About Us Company Details
- Action Plan
- Agenda
- Annual Report
- Audit Reports
- Balance Scorecard
- Brand Equity
- Business Case Study
- Business Communication Skills
- Business Plan Development
- Business Problem Solving
- Business Review
- Capital Budgeting
- Career Planning
- Change Management
- Color Palettes
- Communication Process
- Company Location
- Company Vision
- Compare
- Competitive Analysis
- Corporate Governance
- Cost Reduction Strategies
- Custom Business Slides
- Customer Service
- Dashboard
- Data Management
- Decision Making
- Digital Marketing Strategy
- Digital Transformation
- Disaster Management
- Diversity
- Equity Investment
- Financial Analysis
- Financial Services
- Financials
- Growth Hacking Strategy
- Human Resource Management
- Innovation Management
- Interview Process
- Knowledge Management
- Leadership
- Lean Manufacturing
- Legal Law Order
- Management
- Market Segmentation
- Marketing
- Media and Communication
- Meeting Planner
- Mergers and Acquisitions
- Metaverse
- Newspapers
- Operations and Logistics
- Organizational Structure
- Our Goals
- Performance Management
- Pitch Decks
- Pricing Strategies
- Process Management
- Product Development
- Product Launch Ideas
- Product Portfolio
- Project Management
- Purchasing Process
- Quality Assurance
- Quotes and Testimonials
- Real Estate
- Risk Management
- Sales Performance Plan
- Sales Review
- SEO
- Service Offering
- Six Sigma
- Social Media and Network
- Software Development
- Solution Architecture
- Stock Portfolio
- Strategic Management
- Strategic Planning
- Supply Chain Management
- Swimlanes
- System Architecture
- Team Introduction
- Testing and Validation
- Thanks-FAQ
- Time Management
- Timelines Roadmaps
- Value Chain Analysis
- Value Stream Mapping
- Workplace Ethic
-
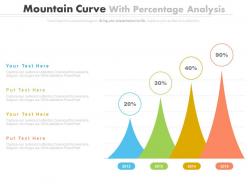 Mountain curves with percentage analysis powerpoint slides
Great tool for various purposes especially businesses having strategic goals. Handy in Schools, Universities and other professional organisation. Hassle free PPT design templates. View in widescreen for maximum benefit. Compatible with google slides. Convert slide to JPG and PDF formats. Make use of icons library to change icons according to your needs. Change aspects like colors, Icon shape and size etc.
-
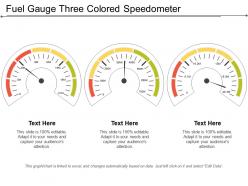 Fuel gauge three colored speedometer
Presenting this set of slides with name - Fuel Gauge Three Colored Speedometer. This is a three stage process. The stages in this process are Fuel Gauge, Gas Gauge, Fuel Containers.
-
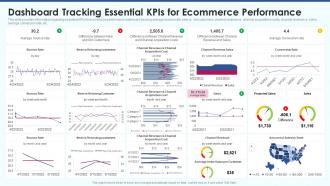 Ecommerce strategy playbook dashboard tracking essential kpis for ecommerce performance
This slide provides information regarding essential KPIs for ecommerce performance dashboard tracking average bounce rate, new vs. old customers, channel revenue vs. channel acquisitions costs, channel revenue vs. sales, average conversion rate, etc. Deliver an outstanding presentation on the topic using this Ecommerce Strategy Playbook Dashboard Tracking Essential KPIS For Ecommerce Performance. Dispense information and present a thorough explanation of Bounce Rate, Retuning Customer, Channel Revenue, Projected Sales using the slides given. This template can be altered and personalized to fit your needs. It is also available for immediate download. So grab it now.
-
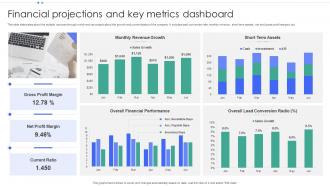 Financial Projections And Key Metrics Dashboard
This slide elaborates about the multiple sources through which one can project about the growth and current status of the company. It includes lead conversion rate, monthly revenue , short term assets , net and gross profit margins, etc. Presenting our well structured Financial Projections And Key Metrics Dashboard. The topics discussed in this slide are Gross Profit Margin, Net Profit Margin, Current Ratio. This is an instantly available PowerPoint presentation that can be edited conveniently. Download it right away and captivate your audience.
-
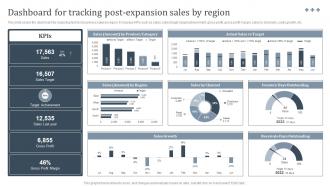 Dashboard For Tracking International Strategy To Expand Global Strategy SS V
This slide covers the dashboard for analyzing fast food business sales by region. It includes KPIs such as sales, sales target, target achievement, gross profit, gross profit margin, sales by channels, sales growth, etc. Deliver an outstanding presentation on the topic using this Dashboard For Tracking International Strategy To Expand Global Strategy SS V. Dispense information and present a thorough explanation of Tracking, Sales, Actual using the slides given. This template can be altered and personalized to fit your needs. It is also available for immediate download. So grab it now.
-
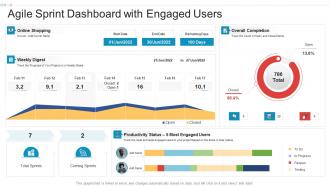 Agile sprint dashboard with engaged users
Introducing our Agile Sprint Dashboard With Engaged Users set of slides. The topics discussed in these slides are Agile Sprint Dashboard With Engaged Users. This is an immediately available PowerPoint presentation that can be conveniently customized. Download it and convince your audience.
-
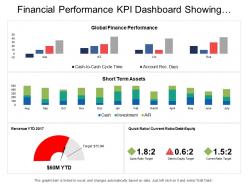 Financial performance kpi dashboard showing revenue quick ratio short term assets
Presenting this set of slides with name - Financial Performance Kpi Dashboard Showing Revenue Quick Ratio Short Term Assets. This is a four stage process. The stages in this process are Financial Performance, Financial Report, Financial Review.
-
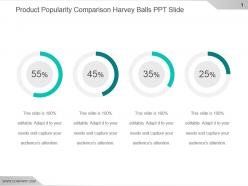 Product popularity comparison harvey balls ppt slide
Presenting product popularity comparison harvey balls ppt slide. This is a product popularity comparison harvey balls ppt slide. This is a four stage process. The stages in this process are business, percentage, finance, marketing, strategy, success.
-
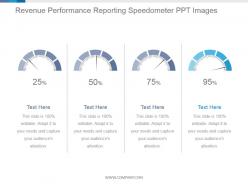 Revenue performance reporting speedometer ppt images
Presenting revenue performance reporting speedometer ppt images. This is a revenue performance reporting speedometer ppt images. This is a four stage process. The stages in this process are dashboard, measure, percentage, business, marketing.
-
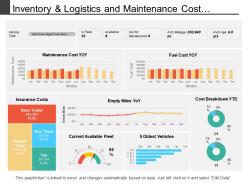 Inventory and logistics and maintenance cost dashboard
Presenting this set of slides with name - Inventory And Logistics And Maintenance Cost Dashboard. This is a three stage process. The stages in this process are Inventory And Logistics, Inventory Management, Warehousing And Inventory Management.
-
 Essential Construction Activities Management Dashboard Construction Playbook
This slide provides information regarding essential construction activities management dashboard with details about site inspection, rework costs, safety meetings, etc. Deliver an outstanding presentation on the topic using this Essential Construction Activities Management Dashboard Construction Playbook. Dispense information and present a thorough explanation of Customer Satisfaction Ratio, Project Type, Net Promoter Score, Customer Complaints using the slides given. This template can be altered and personalized to fit your needs. It is also available for immediate download. So grab it now
-
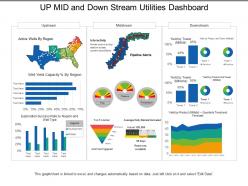 Up mid and down stream utilities dashboard
Presenting this set of slides with name - Up Mid And Down Stream Utilities Dashboard. This is a three stage process. The stages in this process are Utilities, Use, Advantage.
-
 Dashboards for investors powerpoint presentation slides
Presenting Dashboards For Investors PowerPoint Presentation Slides. Get access to 7 entirely editable PPT slides by downloading this complete deck. Our professionally designed PowerPoint templates can be converted into formats like PDF, PNG, and JPG. You can use Google Slides to access them. They also work well with widescreen and standard screen aspect ratios. You can edit the font, text, shapes, patterns, colors, and background of all the templates as per your choice.
-
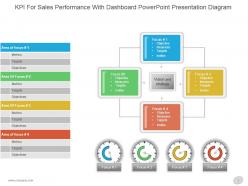 Kpi for sales performance with dashboard powerpoint presentation diagram
Presenting kpi for sales performance with dashboard powerpoint presentation diagram. This is a kpi for sales performance with dashboard powerpoint presentation diagram. This is a four stage process. The stages in this process are area of focus, metrics, objectives, focus, objective, measures, targets, invites, vision and strategy.
-
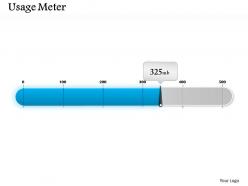 0314 usage meter dashboard design
Access to edit the content, style, size and orientation of the PPT slides. Use of high resolution images and the graphics. Convertible into numerous format options like JPEG, JPG or PDF. User friendly structure of the slides. Replace the watermark with your company’s name or logo. Ease to share the presentation slide in standard and widescreen view. PPT slide for representing flowcharts. Has attractive and error free inclusion of visuals.
-
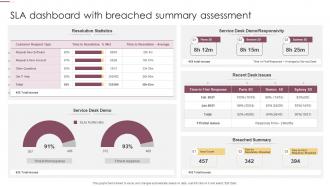 SLA Dashboard With Breached Summary Assessment
Presenting our well structured SLA Dashboard With Breached Summary Assessment. The topics discussed in this slide are Resolution Statistics, Service Desk Demo, Recent Desk Issues. This is an instantly available PowerPoint presentation that can be edited conveniently. Download it right away and captivate your audience.
-
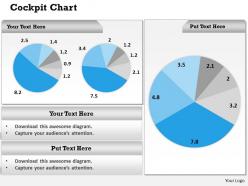 0314 business data link in dashboards snapshot
One of a kind PPT presentation diagrams. Possess high quality and unique patterns and icons to impress the viewers. Allows the information flow smoothly without any errors or interference. Beneficial to the enterprises, investors, customers and clients. Entirely amendable layouts to alter the appearance as per the business needs. Makes the entire concept clear in the mind of the viewers.
-
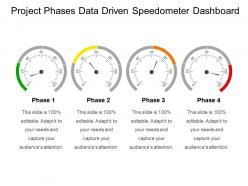 Project phases data driven speedometer dashboard snapshot
Presenting project phases data driven speedometer dashboard. This is a project phases data driven speedometer dashboard snapshot. This is a four stage process. The stages in this process are project phases templates, project steps, project methods.
-
 Kpi icons powerpoint layout
Presenting this set of slides with name - Kpi Icons Powerpoint Layout. This is a eight stage process. The stages in this process are Kpi Icon, Metircs Icon, Dashboard Icon.
-
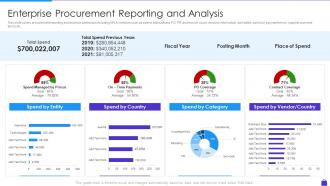 Enterprise Procurement Reporting And Analysis Purchasing Analytics Tools And Techniques
This slide covers procurement reporting and analysis dashboard including KPI and metrices such as spend, transactions, PO, PR and invoice count, invoices information, due dates, spend by payment terms, supplier payment terms etc. Deliver an outstanding presentation on the topic using this Enterprise Procurement Reporting And Analysis Purchasing Analytics Tools And Techniques. Dispense information and present a thorough explanation of On Time Payments, PO Coverage, Contract Coverage using the slides given. This template can be altered and personalized to fit your needs. It is also available for immediate download. So grab it now.
-
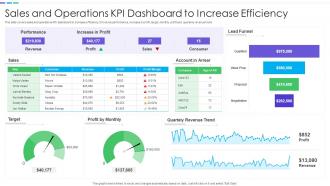 Sales And Operations KPI Dashboard To Increase Efficiency
This slide covers sales and operations KPI dashboard to increase efficiency. It involves performance, increase in profit, target, monthly profit and quarterly revenue trend. Introducing our Sales And Operations KPI Dashboard To Increase Efficiency set of slides. The topics discussed in these slides are Increase In Profit, Quartely Revenue Trend, Account In Arrear. This is an immediately available PowerPoint presentation that can be conveniently customized. Download it and convince your audience.
-
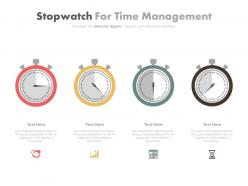 Four stopwatch for time management powerpoint slides
Presenting four stopwatch for time management powerpoint slides. This Power Point template diagram slide has been crafted with graphic of four stopwatches. This PPT diagram contains the concept of time management representation. Use this PPT diagram for business and management related presentations.
-
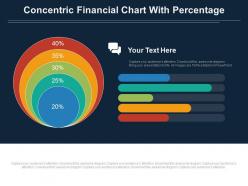 Five staged concentric financial chart with percentage powerpoint slides
The graphics present a flamboyant projection delivering utmost clarity. The slides are compatible with the Google Slides and the multiple file formats are available to save the template post downloading. Explore the wide range of customization of its colors, orientation, and size scheme. Remove the watermark of Slide Team and insert the desired text, watermark and logo at few clicks.
-
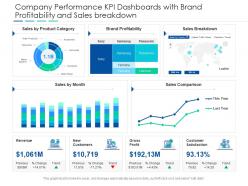 Company performance kpi dashboards with brand profitability and sales breakdown powerpoint template
This is a Company Performance KPI Dashboards With Brand Profitability And Sales Breakdown Powerpoint Template that you can use to present real-time information about your business. With a variety of graphical representations that are in-line with the current trends, this is a great way to display quantified data and stats. This is also a great PowerPoint slide to make informed decisions based on the data and results depicted. Since this template can accommodate a lot of statistical information in one-go it can be put to use by different department heads of the organization. This PPT slide can also be used to present a thorough discussion on various KPIs, all excel-linked and susceptible to innumerable changes. Thus helping in the portrayal of calculative data in a highly professional format. Not only this, but it can also be reproduced in JPG, PNG, and PDF formats. Therefore, reinvent the wheel by downloading this PPT slide now.
-
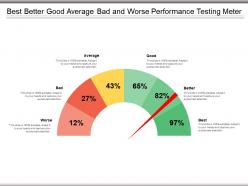 Best better good average bad and worse performance testing meter
Presenting this set of slides with name - Best Better Good Average Bad And Worse Performance Testing Meter. This is a six stage process. The stages in this process are Performance Testing, Performance Analysis, Performance Monitoring.
-
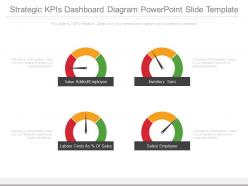 Strategic kpis dashboard snapshot diagram powerpoint slide template
Presenting strategic kpis dashboard snapshot diagram powerpoint slide template. This is a strategic kpis dashboard diagram powerpoint slide template. This is a four stage process. The stages in this process are value added employee, inventory turn, sales employee, labour costs as of sales.
-
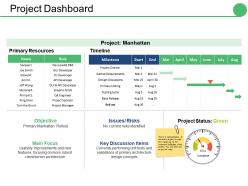 Project dashboard ppt gallery slides
Presenting this set of slides with name - Project Dashboard Ppt Gallery Slides. This is a two stage process. The stages in this process are Milestone, Project, Objective, Main Focus, Key Discussion Items.
-
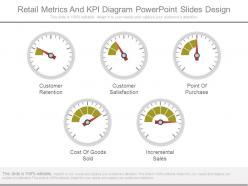 Retail metrics and kpi diagram powerpoint slides design
Presenting retail metrics and kpi diagram powerpoint slides design. This is a retail metrics and kpi diagram powerpoint slides design. This is a five stage process. The stages in this process are customer retention, customer satisfaction, point of purchase, cost of goods sold, incremental sales.
-
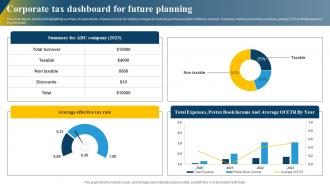 Corporate Tax Dashboard For Future Planning
This slide depicts dashboard highlighting summary of corporate tax of particular year for helping company to make proper financial plan in future to save tax. It involves metrics such as tax summary, average ETR and total expense income graph. Introducing our Corporate Tax Dashboard For Future Planning set of slides. The topics discussed in these slides are Average, Income, Planning. This is an immediately available PowerPoint presentation that can be conveniently customized. Download it and convince your audience.
-
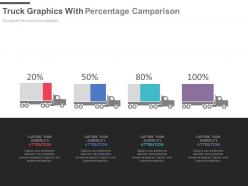 Four trucks graphics with percentage comparison powerpoint slides
The slides transmit a powerful display quality impacting an everlasting impression. Download the slide info graphics in various file formats (JPEG, JPG, PDF.) Play the slides in Google slides as a convenient measure. Transform the slide as per your own suitability in terms of colour and size adjustment. Position the graphics accordingly to recast its outlook. The watermark of Slide Team is easily removable.
-
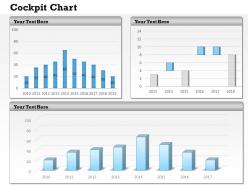 0314 business intelligence dashboard design
Can be used to display complex information in a simple manner. Integrated with a dashboard chart to analyse the business performance and create awareness among the viewers. Possess time-saving capabilities. Helps in the process of decision making and forming effective strategies. Enables widescreen view without distorting the image quality. Runs smoothly with all software’s.
-
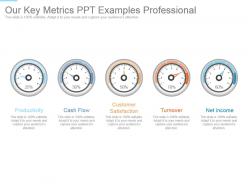 Our key metrics ppt examples professional
Presenting our key metrics ppt examples professional. This is a our key metrics ppt examples professional. This is a five stage process. The stages in this process are productivity, cash flow, customer satisfaction, turnover, net income.
-
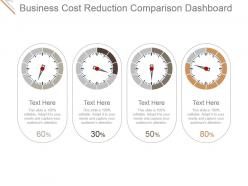 Business cost reduction comparison dashboard snapshot ppt ideas
Presenting business cost reduction comparison dashboard ppt ideas. This is a business cost reduction comparison dashboard snapshot ppt ideas. This is a four stage process. The stages in this process are business, meter, measure, reduction, cost.
-
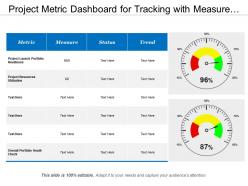 Project metric dashboard for tracking with measure status trend
Presenting this set of slides with name - Project Metric Dashboard For Tracking With Measure Status Trend. This is a two stage process. The stages in this process are Project Kpis, Project Dashboard, Project Metrics.
-
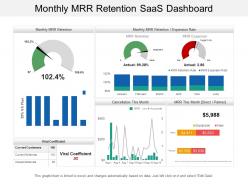 Monthly mrr retention saas dashboard
Offering monthly MRR retention Saas dashboard PPT template. Access to convert the presentation design into JPG and PDF. Offer 100% access to change the values, size and style of the slides once downloaded and saved in the desired format. High quality charts, images and visuals used in the designing process. Choice to get presentation slide in standard or in widescreen view. Easy to convert in JPEG and PDF document. Compatible with Google slides. Easy and hassle free downloading process.
-
 Odometer icon with full speed and speedometer
Presenting this set of slides with name Odometer Icon With Full Speed And Speedometer. This is a three stage process. The stages in this process are Odometer Icon, Full Speed, Speedometer. This is a completely editable PowerPoint presentation and is available for immediate download. Download now and impress your audience.
-
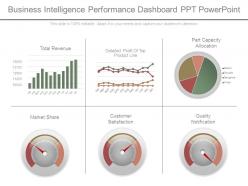 Business intelligence performance dashboard snapshot ppt powerpoint
Presenting business intelligence performance dashboard snapshot ppt powerpoint. This is a business intelligence performance dashboard ppt powerpoint. This is a six stage process. The stages in this process are total revenue, detailed profit of top product line, part capacity allocation, market share, customer satisfaction, quality notification.
-
 Media kpi development sales funnel ppt slide
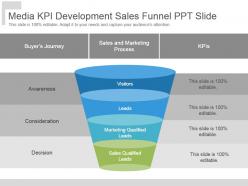
Presenting media kpi development sales funnel ppt slide. This is a media kpi development sales funnel ppt slide. This is a four stage process. The stages in this process are visitors, leads, marketing qualified leads, sales qualified leads, decision, consideration, awareness.
-
 Average absenteeism rate recruitment dashboard
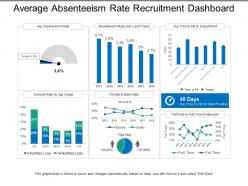
Presenting this set of slides with name - Average Absenteeism Rate Recruitment Dashboard. This is a six stage process. The stages in this process are Staffing Plan, Recruitment, Staff Management.
-
 Economic impact of covid 19 on different sectors of india ppt powerpoint presentation icon
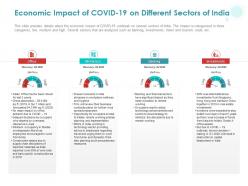
This slide provides details about the economic impact of COVID 19 outbreak on several sectors of India. The impact is categorized in three categories, low, medium and high. Several sectors that are analyzed such as banking, investments, travel and tourism, retail, etc. Presenting this set of slides with name Economic Impact Of COVID 19 On Different Sectors Of India Ppt Powerpoint Presentation Icon. This is a four stage process. The stages in this process are Office, Workplace, Banking, Investments. This is a completely editable PowerPoint presentation and is available for immediate download. Download now and impress your audience.
-
 0314 dashboard design for business
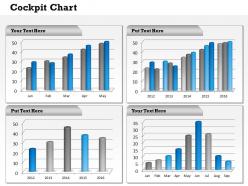
Quality graphics and images are used in the slide template. It is easy to download, save and then edit while using the online or offline Microsoft office software. Customizable style, background and orientation of the template. Follow how to change the icons or graphics information provided in the slide template. A must have for the human resource and management staff in a company.
-
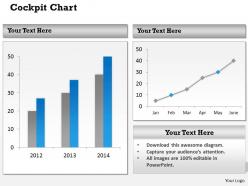 0314 dashboard snapshot design with data structure
The graphics, background, style and the entire layout can be modified as per user’s requirement. The PPT template fits well with the Microsoft office software or even online presentation templates Provided instruction to customize make it easier for the user to make its proper use. Easy to download. Fit to be used by the marketers, professional business owners and the students.
-
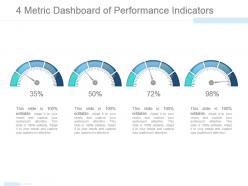 4 metric dashboard of performance indicators example of ppt
Presenting 4 metric dashboard of performance indicators example of ppt. This is a 4 metric dashboard of performance indicators example of ppt. This is a four stage process. The stages in this process are dashboard, finance, percentage, business, marketing.
-
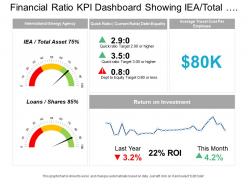 Financial ratio kpi dashboard showing iea total assets and return on investment
Presenting this set of slides with name - Financial Ratio Kpi Dashboard Showing Iea Total Assets And Return On Investment. This is a three stage process. The stages in this process are Accounting Ratio, Financial Statement, Financial Ratio.
-
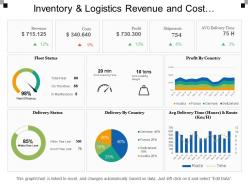 Inventory and logistics revenue and cost dashboards
Presenting this set of slides with name - Inventory And Logistics Revenue And Cost Dashboards. This is a three stage process. The stages in this process are Inventory And Logistics, Inventory Management, Warehousing And Inventory Management.
-
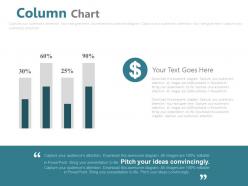 Column chart for financial analysis powerpoint slides
This PPT Template can be used by any employees for representing business and finance related presentations. All these icons and elements used here are 100% editable in terms of color, size, and orientation of the elements mentioned in the slides. These PPT slides are compatible with Google slides and can be edited in any PowerPoint software.
-
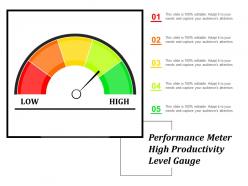 Performance meter high productivity level gauge
Presenting, the performance meter PowerPoint Presentation Slide. This Presentation has been designed professionally and is fully editable. You can customize the font size, font type, colors, and even the background. This Template is obedient with Google Slide and can be saved in JPG or PDF format without any hassle. Fast download at the click of the button.
-
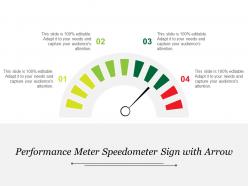 Performance meter speedometer sign with arrow
This highly versatile, innovative design is completely editable; you can modify the design the way you want. Slides are fully compatible with Google Slides and MS PowerPoint software. Instant and quick downloading available; you can save the design into your system into various formats such as JPEG or PDF. Both standard and wide screen view are available; no effect on design quality when opened on wide screen view.
-
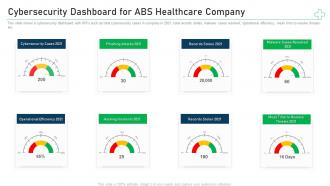 Cybersecurity dashboard for abs minimize cybersecurity threats in healthcare company
This slide shows a cybersecurity dashboard with KPIs such as total cybersecurity cases in company in 2021, total records stoles, malware cases resolved, operational efficiency, mean time to resolve threats etc. Deliver an outstanding presentation on the topic using this Cybersecurity Dashboard For Abs Minimize Cybersecurity Threats In Healthcare Company. Dispense information and present a thorough explanation of Cybersecurity Cases, Phishing Attacks, Records Stolen, Operational Efficiency, Hacking Incidents using the slides given. This template can be altered and personalized to fit your needs. It is also available for immediate download. So grab it now.
-
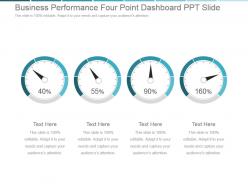 Business performance four point dashboard snapshot ppt slide
Presenting business performance four point dashboard snapshot ppt slide. This is a business performance four point dashboard ppt slide. This is a four stage process. The stages in this process are business, success, dashboard, finance, strategy.
-
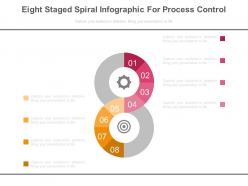 Eight staged spiral infographics for process control powerpoint slides
Compatible with numerous format options like JPEG or PDF. Ease of modifying PowerPoint colors, shades and orientation. Freedom to customize it with company name and logo. Access to inclusion and exclusion of contents as per specific needs of any business. High resolution with splendid picture quality. Zero issue of blur image, when projected on wide screen. Compatible with multiple software options. Valuable for business management team, leaders, administrators and supervisors.
-
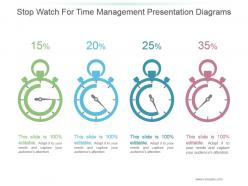 Stop watch for time management presentation diagrams
Presenting stop watch for time management presentation diagrams. This is a stop watch for time management presentation diagrams. This is a four stage process. The stages in this process are business, marketing, stopwatch, management, presentation.
-
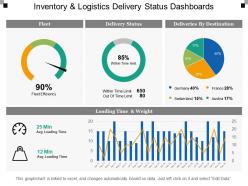 Inventory and logistics delivery status dashboards
Presenting this set of slides with name - Inventory And Logistics Delivery Status Dashboards. This is a four stage process. The stages in this process are Inventory And Logistics, Inventory Management, Warehousing And Inventory Management.
-
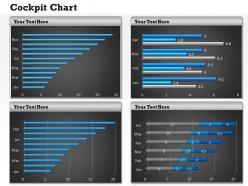 0314 visual design of dashboard
Hugely adapted to all software for smooth running. Simple process to convert to JPG and PDF formats for easy viewing. Quite compatible with Google slides for information access on multiple viewing platforms. Crisp widescreen viewing with no PPT graphics pixilation. Append company logo, name and trademark for specific purposes. Alterable layout including font, text, color and design. High resolution PPT graphics for crispness.
-
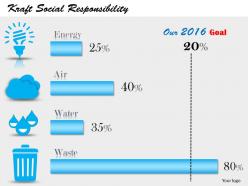 0514 dashboard chart for progress of social effort to stop wastage
Must have presentation for NGO’s trying to save energy and natural resources. High resolution graphics never pixilate and project beautifully on bigger screens. Changeable color, font, text size and orientation gives pin-point control to the user. No space constraints while adding sub-titles or titles. Compatible with Google slides and runs with other softwares. No problem in adding company’s name or logo. Does not occupy much space and easy to download.
-
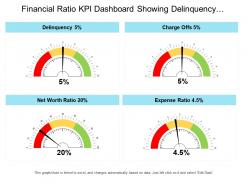 Financial ratio kpi dashboard snapshot showing delinquency charge offs and net worth ratio
Presenting this set of slides with name - Financial Ratio Kpi Dashboard Snapshot Showing Delinquency Charge Offs And Net Worth Ratio. This is a four stage process. The stages in this process are Accounting Ratio, Financial Statement, Financial Ratio.
-
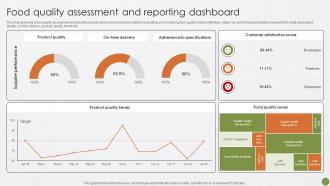 Food Quality Assessment And Reporting Food Quality Best Practices For Food Quality And Safety Management
This slide presents a food quality assessment and reporting dashboard to present real-time data for evaluating and monitoring food quality metrics effectively. Major key performance indicators covered in the slide are product, quality, on time, delivery, product, quality, trends etc. Present the topic in a bit more detail with this Food Quality Assessment And Reporting Food Quality Best Practices For Food Quality And Safety Management. Use it as a tool for discussion and navigation on Product Quality Trends, Customer Satisfaction Score, Food Quality Issues. This template is free to edit as deemed fit for your organization. Therefore download it now.
-
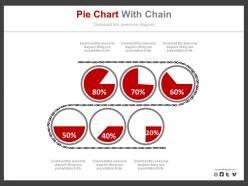 Six pie charts and percentage analysis powerpoint slides
Pixel friendly images and slide icons. 100% customization allowed. Easy to download. Save in the wide variety of formats. Customize the background, style and orientation. Attune well with the Google slides. Useful for the business entrepreneurs, marketing professionals and students.
-
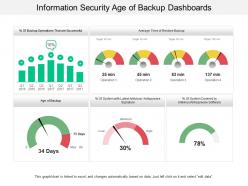 Information security age of backup dashboards
Presenting this set of slides with name - Information Security Age Of Backup Dashboards. This is a five stage process. The stages in this process are Information Security Strategy, Information Security Plan, Information Protection Strategy.
-
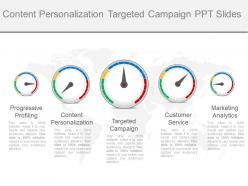 Content personalization targeted campaign ppt slides
Presenting content personalization targeted campaign ppt slides. Presenting content personalization targeted campaign ppt slides. This is a content personalization targeted campaign ppt slides. This is a five stage process. The stages in this process are progressive profiling, content personalization, targeted campaign, customer service, marketing analytics.


