Finance PowerPoint Templates, Presentation Slide Diagrams & PPT Graphics
- Sub Categories
-
- 30 60 90 Day Plan
- Advertising
- Agile Development
- Aims and Objectives
- Arrows
- Before and After
- Blockchain Bitcoin
- Boxes
- Business
- Calender
- Case Study
- Celebrations
- Certificates
- Challenges Opportunities
- Channel Distribution
- Children
- Communication
- Competitive Landscape
- Computer
- Concepts
- Construction Management
- Corporate
- Crowdfunding
- Current State Future State
- Custom PowerPoint Diagrams
- Digital Transformation
- Dos and Donts
- Economics
- Education
- Environment
- Events
- Festival
- Finance
- Financials
- Food
- Game
- Gap Analysis
- Generic
- Geographical
- Health
- Heatmaps
- Holidays
- Icons
- Input Process Output
- Internet
- Key Messages
- Key Wins
- Ladder
- Leadership
- Lists
- Lucky Draw
- Management
- Marketing
- Measuring
- Medical
- Music
- News
- Next Steps
- People Process Technology
- Pillars
- Planning
- Post-it-Notes
- Problem Statement
- Process
- Proposal Management
- Pros and Cons
- Puzzle
- Puzzles
- Recruitment Strategy
- Religion
- Research and Development
- Risk Mitigation Strategies
- Roadmap
- Selling
- Shapes
- Short Term Long Term
- Social
- Stairs
- Start Stop Continue
- Strategy
- Symbol
- Technology
- Thesis Defense Dissertation
- Timelines
- Traffic
- Transition Plan
- Transportation
- Vehicles
- Venture Capital Funding
- Warning
- Winners
- Word Cloud
-
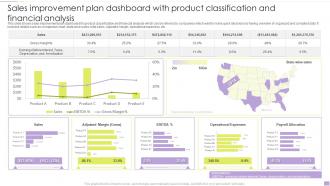 Sales Improvement Plan Dashboard With Product Classification And Financial Analysis
This slide shows sales improvement plan dashboard for product classification and financial analysis which can be referred by companies which want to make quick decisions by having overview of organized and compiled data. It includes details such as comparison chart, state wise sales, total sales, adjusted margin, operational expenses, etc.. Introducing our Sales Improvement Plan Dashboard With Product Classification And Financial Analysis set of slides. The topics discussed in these slides are Sales Improvement Plan, Dashboard, Product Classification, Financial Analysis. This is an immediately available PowerPoint presentation that can be conveniently customized. Download it and convince your audience.
-
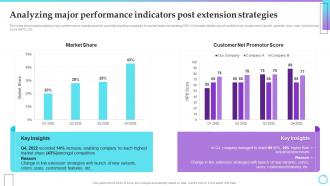 Analyzing Major Performance Indicators Post Brand Extension Strategy Implementation For Gainin
This slide showcases analyzing major performance indicators which can help branding managers to assess extension strategy KPIs. It provides details about market share, product line, launch, variants, color, size, net promotor score NPS, etc. Deliver an outstanding presentation on the topic using this Analyzing Major Performance Indicators Post Brand Extension Strategy Implementation For Gainin. Dispense information and present a thorough explanation of Market Share, Customer, Net Promotor Score, Key Insights using the slides given. This template can be altered and personalized to fit your needs. It is also available for immediate download. So grab it now.
-
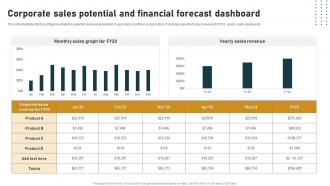 Corporate Sales Potential And Financial Forecast Dashboard
This slide illustrates facts and figures related to expected revenue generation in upcoming months in a corporation. It includes expected sales revenue for FY23, yearly sales revenue etc. Introducing our Corporate Sales Potential And Financial Forecast Dashboard set of slides. The topics discussed in these slides are Monthly Sales Graph, Revenue, Corporate Sales. This is an immediately available PowerPoint presentation that can be conveniently customized. Download it and convince your audience.
-
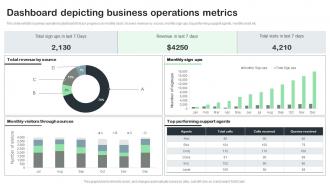 Dashboard Depicting Business Operations Metrics
This slide exhibits business operations dashboard to track progress on monthly basis. It covers revenue by source, monthly sign ups, top performing support agents, monthly visits etc. Introducing our Dashboard Depicting Business Operations Metrics set of slides. The topics discussed in these slides are Dashboard Depicting, Business Operations Metrics. This is an immediately available PowerPoint presentation that can be conveniently customized. Download it and convince your audience.
-
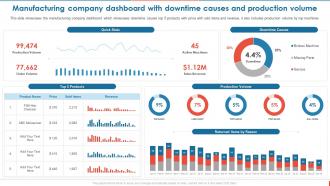 Manufacturing Company Dashboard With Downtime Causes Consumer Goods Manufacturing
This slide showcases the manufacturing company dashboard which showcases downtime causes top 5 products with price with sold items and revenue, it also includes production volume by top machines. Present the topic in a bit more detail with this Manufacturing Company Dashboard With Downtime Causes Consumer Goods Manufacturing. Use it as a tool for discussion and navigation on Manufacturing, Dashboard, Downtime Causes, Production Volume. This template is free to edit as deemed fit for your organization. Therefore download it now.
-
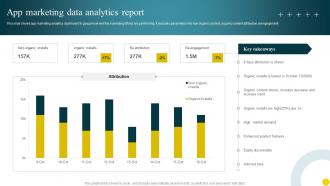 App Marketing Data Analytics Report
This slide shows app marketing analytics dashboard to gauge how well the marketing efforts are performing. It includes parameters like non organic content, organic content attribution, reengegement. Introducing our App Marketing Data Analytics Report set of slides. The topics discussed in these slides are App Marketing, Data Analytics Report, Organic Installs. This is an immediately available PowerPoint presentation that can be conveniently customized. Download it and convince your audience.
-
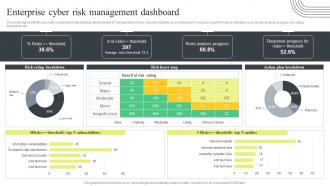 Cyber Security Attacks Response Plan Enterprise Cyber Risk Management Dashboard
This slide represents the key metrics dashboard representing details related to management of cyber security incidents by an enterprise. It includes key performance indicators such as risk analysis progress, risk rating breakdown etc. Deliver an outstanding presentation on the topic using this Cyber Security Attacks Response Plan Enterprise Cyber Risk Management Dashboard. Dispense information and present a thorough explanation of Enterprise Cyber, Risk Management, Dashboard, Action Plan Breakdown using the slides given. This template can be altered and personalized to fit your needs. It is also available for immediate download. So grab it now.
-
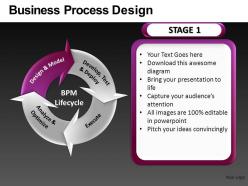 Business process design powerpoint presentation slides db
These high quality, editable pre-designed powerpoint slides have been carefully created by our professional team to help you impress your audience. Each graphic in every slide is vector based and is 100% editable in powerpoint. Each and every property of any slide - color, size, shading etc can be modified to build an effective powerpoint presentation. Use these slides to convey complex business concepts in a simplified manner. Any text can be entered at any point in the powerpoint slide. Simply DOWNLOAD, TYPE and PRESENT!
-
 20 pieces 5x4 rectangular jigsaw puzzle matrix powerpoint templates 0812
This template is skillfully designed and is completely editable to suit all the needs and requirements of the user. The color of the font, its size, style, and all other elements can be customized according to the user's desire The text in the PPT placeholder can be replaced with the desired information making this template highly flexible and adaptable as well. This template is also compatible with various Microsoft versions and formats like Google Slides, JPG, PDF, etc so the user will face no issue in saving it in the format of his choice.
-
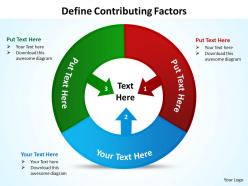 Define contributing factors powerpoint diagrams presentation slides graphics 0912
These Diagrams can be used to interact visually and logically with audiences
-
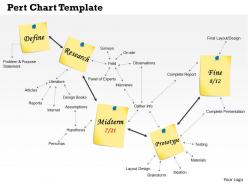 0514 pert chart template diagram powerpoint presentation
We are proud to present our 0514 pert chart template diagram powerpoint presentation. PERT is all about management probabilities. Therefore, PERT involves in many simple statistical methods as well. Adjust the above Pert Chart into your Presentations to visually support your contents. Create captivating presentations to deliver comparative and weighted arguments.
-
 0514 presentation sample bullet points powerpoint presentation
PowerPoint slide outline with bullets option. Template graphic slides are versatile with Google slides. Access to change the images, tints or the style of the slides according to the business necessity. No bargain with the quality notwithstanding when shared on a wide screen show see. Modify the introduction picture as a few components are editable. Immediate download and adaptable in the JPG or PDF. Easy to understand and highly appealing template.
-
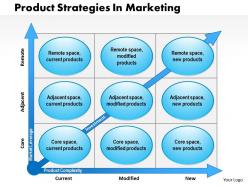 0514 product strategies in marketing powerpoint presentation
Pliable template images as can be redone according to your necessity. Stupendous quality template visuals with awesome show. Contents of slide outline totally amendable to the degree. Numerous alternatives like JPG and PDF for sparing the introduction outline. Easy expansion or expulsion of undesirable components according to your benefit. PPT outline downloadable with various hubs and stages. Slide designs are perceptible in standard and widescreen see.
-
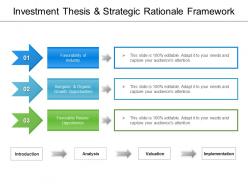 Investment thesis and strategic rationale framework
Presenting investment thesis and strategic rationale framework. This is a investment thesis and strategic rationale framework. This is a three stage process. The stages in this process are investment thesis, investment strategy, investment objectives.
-
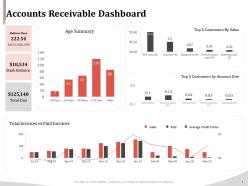 Accounts receivable dashboard ppt powerpoint presentation gallery
Presenting this set of slides with name Accounts Receivable Dashboard Ppt Powerpoint Presentation Gallery. The topics discussed in these slides are Accounts Receivable Dashboard. This is a completely editable PowerPoint presentation and is available for immediate download. Download now and impress your audience.
-
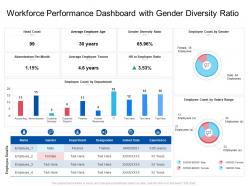 Workforce performance dashboard with gender diversity ratio
Presenting our well structured Workforce Performance Dashboard With Gender Diversity Ratio. The topics discussed in this slide are Average Employee, Salary Range, Employee Ratio. This is an instantly available PowerPoint presentation that can be edited conveniently. Download it right away and captivate your audience.
-
 Dashboards by function customer service and support team dashboard
Deliver an outstanding presentation on the topic using this Dashboards By Function Customer Service And Support Team Dashboard. Dispense information and present a thorough explanation of Customer Service And Support Team Dashboard using the slides given. This template can be altered and personalized to fit your needs. It is also available for immediate download. So grab it now.
-
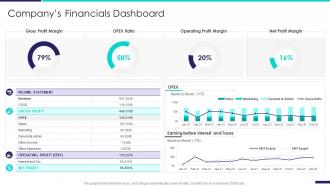 Company profile information technology companys financials dashboard snapshot
This graph or chart is linked to excel, and changes automatically based on data. Just left click on it and select Edit Data. Present the topic in a bit more detail with this Company Profile Information Technology Companys Financials Dashboard snapshot. Use it as a tool for discussion and navigation on Gross Profit Margin, OPEX Ratio, Operating Profit Margin, Net Profit Margin. This template is free to edit as deemed fit for your organization. Therefore download it now.
-
 Corporate Risk KPI And Control Dashboard Snapshot With Expenditure
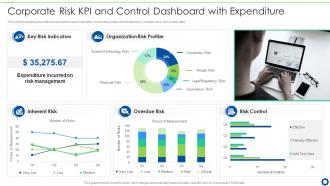
This slide illustrates corporate risk key performance indicators. It includes graphs of inherent risks, overdue risks, risk control data. Introducing our Corporate Risk KPI And Control Dashboard Snapshot With Expenditure set of slides. The topics discussed in these slides are Key Risk Indicators, Organization Risk Profiler, Overdue Risk, Risk Control, Inherent Risk. This is an immediately available PowerPoint presentation that can be conveniently customized. Download it and convince your audience.
-
 Company Management KPI Dashboard Snapshot With Marketing Program Report
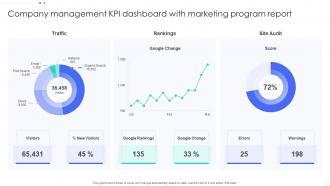
This graph or chart is linked to excel, and changes automatically based on data. Just left click on it and select Edit Data. Introducing our Company Management KPI Dashboard Snapshot With Marketing Program Report set of slides. The topics discussed in these slides are Rankings, Site Audit, Traffic. This is an immediately available PowerPoint presentation that can be conveniently customized. Download it and convince your audience.
-
 Comparative Health And Safety Key Performance Indicator Dashboard
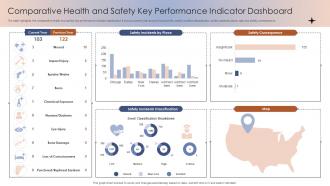
The slide highlights the comparative health and safety key performance indicator dashboard. It shows current year and previous events, safety incident classification, safety cases by place, map and safety consequence Introducing our Comparative Health And Safety Key Performance Indicator Dashboard set of slides. The topics discussed in these slides are Comparative Health, Safety, Key Performance Indicator, Dashboard. This is an immediately available PowerPoint presentation that can be conveniently customized. Download it and convince your audience.
-
 KPIs To Manage Company Cash Flow
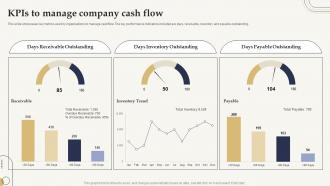
This slide showcases key metrics used by organizations to manage cashflow. The key performance indicators included are days, receivable, inventory and payable outstanding. Presenting our well-structured KPIs To Manage Company Cash Flow. The topics discussed in this slide are Days Receivable Outstanding, Days Inventory Outstanding, Days Payable Outstanding. This is an instantly available PowerPoint presentation that can be edited conveniently. Download it right away and captivate your audience.
-
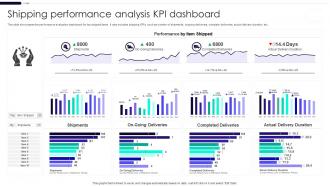 Shipping Performance Analysis KPI Dashboard
This slide showcases the performance evaluation dashboard for top shipped items. It also includes shipping KPIs such as number of shipments, ongoing deliveries, complete deliveries, actual delivery duration, etc. Introducing our Shipping Performance Analysis KPI Dashboard set of slides. The topics discussed in these slides are Completed Deliveries, Actual Delivery Duration, On Going Deliveries, Shipments. This is an immediately available PowerPoint presentation that can be conveniently customized. Download it and convince your audience.
-
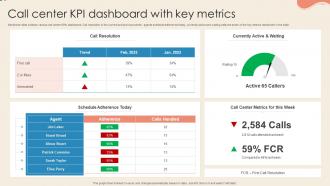 Call Center KPI Dashboard With Key Metrics
Mentioned slide outlines various call center KPIs dashboard. Call resolution in the current and previous month, agents schedule adherence today, currently active and waiting calls are some of the key metrics mentioned in the slide. Presenting our well structured Call Center KPI Dashboard With Key Metrics. The topics discussed in this slide are Call Resolution, Currently Active, Agent. This is an instantly available PowerPoint presentation that can be edited conveniently. Download it right away and captivate your audience.
-
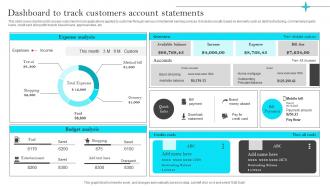 Omnichannel Strategies For Digital Dashboard To Track Customers Account Statements
This slide covers dashboard to assess outcomes for loan applications applied by customer through various omnichannel banking services. It includes results based on elements such as debt restructuring, commercial property loans, credit card along with branch based loans, approval rates, etc. Present the topic in a bit more detail with this Omnichannel Strategies For Digital Dashboard To Track Customers Account Statements. Use it as a tool for discussion and navigation on Dashboard, Track Customers, Account Statements, Omnichannel Banking Services. This template is free to edit as deemed fit for your organization. Therefore download it now.
-
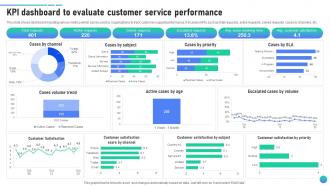 KPI Dashboard To Evaluate Customer Service Client Assistance Plan To Solve Issues Strategy SS V
This slide shows dashboard including various metrics which can be used by organizations to track customer support performance. It includes KPIs such as total requests, active requests, solved requests, cases by channels, etc. Present the topic in a bit more detail with this KPI Dashboard To Evaluate Customer Service Client Assistance Plan To Solve Issues Strategy SS V. Use it as a tool for discussion and navigation on Active Requests, Solved Requests. This template is free to edit as deemed fit for your organization. Therefore download it now.
-
 Financial Projection Business Model Of Zoom Ppt Icon Graphic Images BMC SS
This slide presents the financial projections showcasing company anticipated revenue growth. The projections are based on comprehensive market analysis and historical performance. Deliver an outstanding presentation on the topic using this Financial Projection Business Model Of Zoom Ppt Icon Graphic Images BMC SS. Dispense information and present a thorough explanation of Financial Projection, Historical Performance, Comprehensive Market Analysis using the slides given. This template can be altered and personalized to fit your needs. It is also available for immediate download. So grab it now.
-
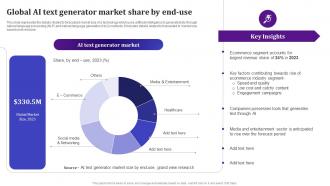 Global AI Text Generator Market Share By End Use AI Text To Voice Convertor Tools AI SS V
This slide represents the details related to forecasted market size of a technology which uses artificial intelligence to generate texts through natural language processing NLP and natural language generation NLG methods. It includes details related to forecasted AI market size based on its end use. Deliver an outstanding presentation on the topic using this Global AI Text Generator Market Share By End Use AI Text To Voice Convertor Tools AI SS V. Dispense information and present a thorough explanation of Media And Entertainment, Healthcare, E Commerce using the slides given. This template can be altered and personalized to fit your needs. It is also available for immediate download. So grab it now.
-
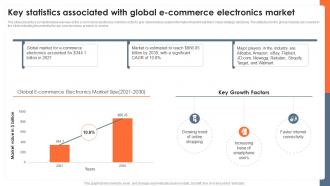 Key Statistics Associated With Global E Commerce Global Consumer Electronics Outlook IR SS
The slide presents a comprehensive overview of the e-commerce electronics market in order to give stakeholders useful information that will help them make strategic decisions. The statistics for the global markets are covered in the slide indicating the potential for any new business, product, or service. Present the topic in a bit more detail with this Key Statistics Associated With Global E Commerce Global Consumer Electronics Outlook IR SS. Use it as a tool for discussion and navigation on Global Market, E Commerce, Electronics Accounted. This template is free to edit as deemed fit for your organization. Therefore download it now.
-
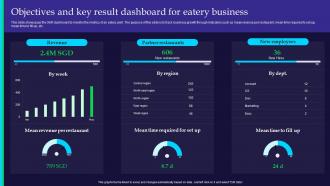 Objectives And Key Result Dashboard For Eatery Business
This slide showcases the OKR dashboard to monitor the metrics of an eatery joint. The purpose of this slide is to track business growth through indicators such as mean revenue per restaurant, mean time required to set up, mean time to fill up, etc. Presenting our well structured Objectives And Key Result Dashboard For Eatery Business The topics discussed in this slide are Revenue, Partner Restaurants, New Employees This is an instantly available PowerPoint presentation that can be edited conveniently. Download it right away and captivate your audience.
-
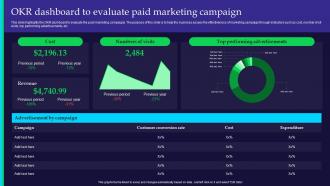 OKR Dashboard To Evaluate Paid Marketing Campaign
This slide highlights the OKR dashboard to evaluate the paid marketing campaigns. The purpose of this slide is to help the business assess the effectiveness of marketing campaign through indicators such as cost, number of sit visits, top performing advertisements, etc. Presenting our well structured OKR Dashboard To Evaluate Paid Marketing Campaign The topics discussed in this slide are Advertisement By Campaign, Performing Advertisements This is an instantly available PowerPoint presentation that can be edited conveniently. Download it right away and captivate your audience.
-
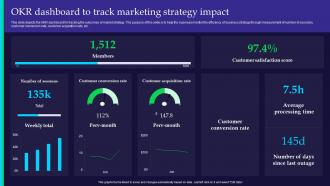 OKR Dashboard To Track Marketing Strategy Impact
This slide depicts the OKR dashboard for tracking the outcomes of market strategy. The purpose of this slide is to help the business monitor the efficiency of business strategy through measurement of number of sessions, customer conversion rate, customer acquisition rate, etc. Presenting our well structured OKR Dashboard To Track Marketing Strategy Impact The topics discussed in this slide are Customer Conversion, Customer Acquisition, Customer Satisfaction This is an instantly available PowerPoint presentation that can be edited conveniently. Download it right away and captivate your audience.
-
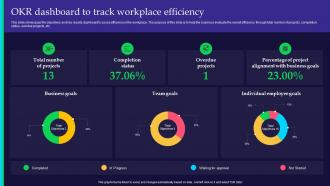 OKR Dashboard To Track Workplace Efficiency
This slide showcases the objectives and key results dashboard to asses efficiency in the workplace. The purpose of this slide is to help the business evaluate the overall efficiency through total number of projects, completion status, overdue projects, etc. Introducing our OKR Dashboard To Track Workplace Efficiency set of slides. The topics discussed in these slides are Completion Status, Overdue Projects, Business Goals This is an immediately available PowerPoint presentation that can be conveniently customized. Download it and convince your audience.
-
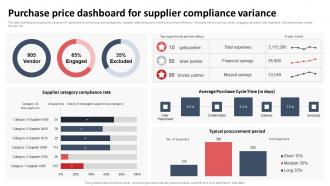 Purchase Price Dashboard For Supplier Compliance Variance
This slide illustrates purchase price variance KPI dashboard for enhancing cost management, supplier relationships and overall procurement efficiency. It includes metrics such as vendor, engaged, excluded, total expenses, financial savings, missed savings, etc. Introducing our Purchase Price Dashboard For Supplier Compliance Variance set of slides. The topics discussed in these slides are Supplier Category, Typical Procurement Period This is an immediately available PowerPoint presentation that can be conveniently customized. Download it and convince your audience.
-
 0414 business consulting diagram 3d icons for hand concept powerpoint slide template
We are proud to present our 0414 business consulting diagram 3d icons for hand concept powerpoint slide template. Our Business consulting diagram 3d icons for hand concept PowerPoint slide template Powerpoint Templates provide you with a vast range of viable options. Select the appropriate ones and just fill in your text. Subscribe to our Business consulting diagram 3d icons for hand concept PowerPoint slide template Powerpoint Templates and receive great value for your money. Be assured of finding the best projection to highlight your words.
-
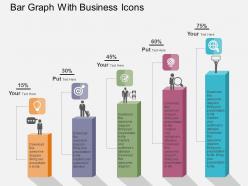 Bar graph with business icons flat powerpoint design
We are proud to present our bar graph with business icons flat powerpoint design. This power point template diagram has been crafted with graphic of bar graph and business icons. This PPT diagram contains the concept of result analysis and business process representation. Use this PPT diagram for business and finance related presentations.
-
 Laptop with six arrows for business icons flat powerpoint design
We are proud to present our laptop with six arrows for business icons flat powerpoint design. Graphic of laptop and six arrows with business icons has been used to craft this power point template diagram. This PPT diagram contains the concept of technology application .Use this PPT diagram for business and technology related presentations.
-
 Six infographics with sales and marketing icons flat powerpoint design
We are proud to present our six infographics with sales and marketing icons flat powerpoint design. This power point template diagram has been crafted with graphic of six info graphics and icons. This PPT diagram contains the concept of marketing strategy and sales strategy. Use this PPT diagram for business and marketing related presentations.
-
 Bl magnifier with dollar search financial analysis flat powerpoint design
Presenting bl magnifier with dollar search financial analysis flat powerpoint design. This Power Point template diagram has been crafted with graphic of magnifier and dollar .This PPT diagram contains the concept of financial analysis. Use this PPT diagram for business and finance related presentations.
-
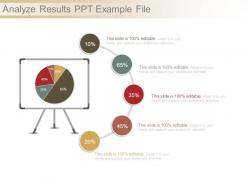 Analyze results ppt example file
Presenting analyze results ppt example file. This is a analyze results ppt example file. This is five stage process. The stages in this process are business, pie chart, finance, strategy, success, analysis.
-
 Financial technology target wallet briefcase dollar icon image
Presenting this set of slides with name - Financial Technology Target Wallet Briefcase Dollar Icon Image. This is a ten stage process. The stages in this process are Financial Technology, Fintech, Financial Services.
-
 Mobile banking icon powerpoint
Presenting this set of slides with name - Mobile Banking Icon Powerpoint. This is a one stage process. The stages in this process are Mobile Banking, Online Banking, Mobile Payment.
-
 Sponsorship roadmap template project team sponsors employees
Presenting this set of slides with name - Sponsorship Roadmap Template Project Team Sponsors Employees. This is a five stage process. The stages in this process are Sponsorship Roadmap Template, Sponsorship Timeline Template, Sponsorship Linear Process Template.
-
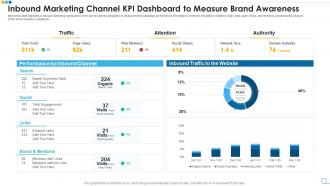 Inbound marketing channel kpi dashboard to measure brand awareness
Presenting our well structured Inbound Marketing Channel KPI Dashboard To Measure Brand Awareness. The topics discussed in this slide are Inbound Marketing Channel KPI Dashboard To Measure Brand Awareness. This is an instantly available PowerPoint presentation that can be edited conveniently. Download it right away and captivate your audience.
-
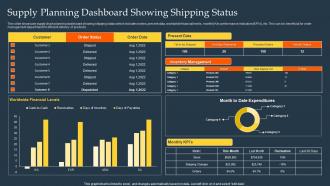 Supply Planning Dashboard Snapshot Showing Shipping Status
This slide showcase supply chain planning dashboard snapshot showing shipping status which includes orders, present data, worldwide financial levels, monthly Key performance indicators KPIs, etc. This can be beneficial for order management department for efficient delivery of products. Introducing our Supply Planning Dashboard Showing Shipping Status set of slides. The topics discussed in these slides are Supply Planning, Dashboard Showing Shipping, Status. This is an immediately available PowerPoint presentation that can be conveniently customized. Download it and convince your audience.
-
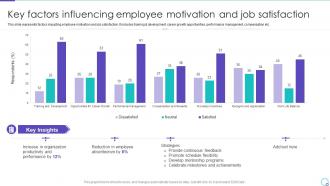 Key Factors Influencing Employee Motivation And Job Satisfaction Ppt Inspiration
This slide represents factors impacting employee motivation and job satisfaction. It includes training and development, career growth opportunities, performance management, compensation etc. Deliver an outstanding presentation on the topic using this Key Factors Influencing Employee Motivation And Job Satisfaction Ppt Inspiration. Dispense information and present a thorough explanation of Organization Productivity, Strategies, Continuous Feedback using the slides given. This template can be altered and personalized to fit your needs. It is also available for immediate download. So grab it now.
-
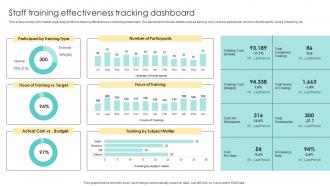 Staff Training Effectiveness Tracking Dashboard Devising Essential Business Strategy
This slide provides information regarding workforce training effectiveness monitoring dashboard. The dashboard includes details such as training cost, cost per participant, number of participants, hours of training, etc. Present the topic in a bit more detail with this Staff Training Effectiveness Tracking Dashboard Devising Essential Business Strategy. Use it as a tool for discussion and navigation on Staff Training, Effectiveness, Tracking Dashboard. This template is free to edit as deemed fit for your organization. Therefore download it now.
-
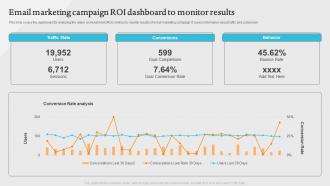 Email Marketing Campaign Roi Dashboard To Monitor Results
This slide covers the dashboard for analyzing the return on investment ROI metrics to monitor results of email marketing campaign. It covers information about traffic and conversion. Presenting our well structured Email Marketing Campaign Roi Dashboard To Monitor Results. The topics discussed in this slide are Traffic Stats, Conversions, Behavior, Monitor Results. This is an instantly available PowerPoint presentation that can be edited conveniently. Download it right away and captivate your audience.
-
 Human Resource Monthly Diversity Report Of Large Enterprise
This slide represents the diversity report of the organization prepared by the human resource department of the organization. It includes details related to starters, headcount all types, leavers, promotions and headcount-activity by grade etc. Presenting our well structured Human Resource Monthly Diversity Report Of Large Enterprise. The topics discussed in this slide are Human Resource, Large Enterprise, Monthly Diversity Report. This is an instantly available PowerPoint presentation that can be edited conveniently. Download it right away and captivate your audience.
-
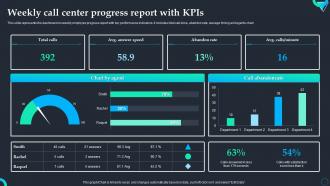 Weekly Call Center Progress Report With KPIs
This slide represents the dashboard on weekly employee progress report with key performance indicators. It includes total call done, abandon rate, average timing and agents chart. Presenting our well structured Weekly Call Center Progress Report With KPIs. The topics discussed in this slide are Total Calls, Answer Speed, Abandon Rate, Progress Report. This is an instantly available PowerPoint presentation that can be edited conveniently. Download it right away and captivate your audience.
-
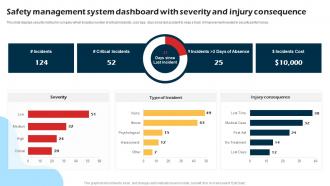 Safety Management System Dashboard With Severity And Injury Consequence
This slide displays security metrics for company which includes number of critical incidents, cost, type, days since last accident to keep a track of Improvement needed in security performance. Introducing our Safety Management System Dashboard With Severity And Injury Consequence set of slides. The topics discussed in these slides are Safety Management System, Dashboard Severity, Injury Consequence. This is an immediately available PowerPoint presentation that can be conveniently customized. Download it and convince your audience.
-
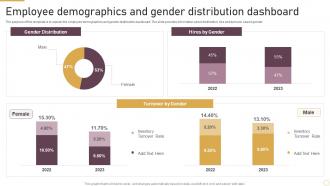 Employee Demographics And Gender Distribution Dashboard
The purpose of this template is to explain the employee demographics and gender distribution dashboard. The slide provides information about distribution, hire and turnover based gender. Presenting our well structured Employee Demographics And Gender Distribution Dashboard. The topics discussed in this slide are Gender Distribution, Hires By Gender, Turnover By Gender. This is an instantly available PowerPoint presentation that can be edited conveniently. Download it right away and captivate your audience.
-
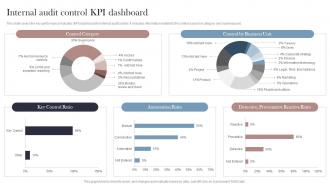 Internal Audit Control KPI Dashboard
This slide covers the key performance indicator KPI dashboard for internal audit control. It includes information related to the control based on category and business unit. Introducing our Internal Audit Control KPI Dashboard set of slides. The topics discussed in these slides are Control Category, Key Control Ratio, Automation Ratio. This is an immediately available PowerPoint presentation that can be conveniently customized. Download it and convince your audience.
-
 Office Team Compliance KPI Dashboard
This slide shows various key indicators for compliance of employee performance in different areas. It include indicators like increase in success areas, number of emergency changes and completion of audit plan etc Presenting our well structured Office Team Compliance KPI Dashboard. The topics discussed in this slide are Members, Compliance, Team. This is an instantly available PowerPoint presentation that can be edited conveniently. Download it right away and captivate your audience.
-
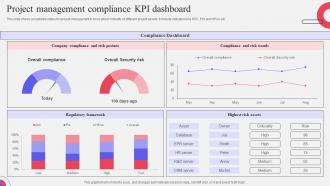 Project Management Compliance KPI Dashboard
This slide shows compliance status for project management to know about criticality of different project assets. It Include indicators like SOX, PCI and HPAA etc Presenting our well structured Project Management Compliance KPI Dashboard. The topics discussed in this slide are Management, Project, Compliance. This is an instantly available PowerPoint presentation that can be edited conveniently. Download it right away and captivate your audience.
-
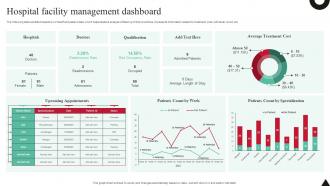 Hospital Facility Management Dashboard
The following slide exhibits breakdown of staff and patient data which helps leaders analyse efficiency of their practices. It presents information related to treatment cost, individual count, etc. Introducing our Hospital Facility Management Dashboard set of slides. The topics discussed in these slides are Hospitals, Qualification. This is an immediately available PowerPoint presentation that can be conveniently customized. Download it and convince your audience.
-
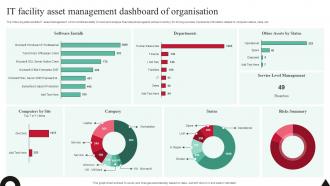 It Facility Asset Management Dashboard Of Organisation
The following slide exhibits IT asset management which combines ability to track and analyse financial pieces against actual inventory for driving success. It presents information related to computer status, risks, etc. Presenting our well structured It Facility Asset Management Dashboard Of Organisation. The topics discussed in this slide are Software Installs, Departments.This is an instantly available PowerPoint presentation that can be edited conveniently. Download it right away and captivate your audience.
-
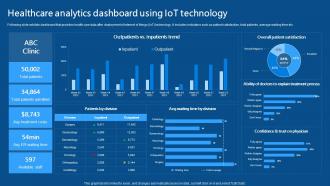 Healthcare Analytics Dashboard Using IoT Technology IoMT Applications In Medical Industry IoT SS V
Following slide exhibits dashboard that provides health care data after deployment of internet of things IoT technology. It includes indicators such as patient satisfaction, total patients, average waiting time etc. Deliver an outstanding presentation on the topic using this Healthcare Analytics Dashboard Using IoT Technology IoMT Applications In Medical Industry IoT SS V. Dispense information and present a thorough explanation of Overall Patient Satisfaction, Patients By Division using the slides given. This template can be altered and personalized to fit your needs. It is also available for immediate download. So grab it now.
-
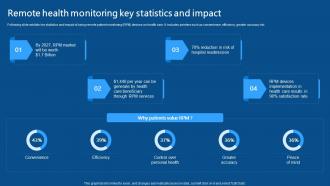 Remote Health Monitoring Key Statistics And Impact IoMT Applications In Medical Industry IoT SS V
Following slide exhibits key statistics and impact of using remote patient monitoring RPM devices on health care. It includes pointers such as convenience, efficiency, greater accuracy etc. Present the topic in a bit more detail with this Remote Health Monitoring Key Statistics And Impact IoMT Applications In Medical Industry IoT SS V. Use it as a tool for discussion and navigation on Convenience, Efficiency, Greater Accuracy. This template is free to edit as deemed fit for your organization. Therefore download it now.
-
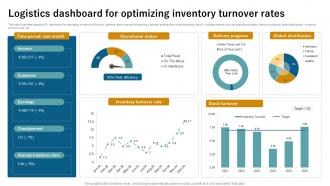 Logistics Dashboard For Optimizing Inventory Turnover Rates
This slide illustrates logistics KPI dashboard for managing inventory efficiently, optimize resources and enhancing customer satisfaction while minimizing risks. It includes metrics such as operational status, delivery progress, global distribution, inventory turnover rate, etc. Presenting our well structured Logistics Dashboard For Optimizing Inventory Turnover Rates. The topics discussed in this slide are Operational, Delivery, Global. This is an instantly available PowerPoint presentation that can be edited conveniently. Download it right away and captivate your audience.


