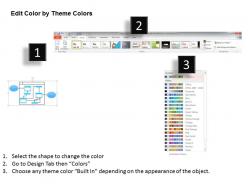
0514 data flow diagram example powerpoint presentation
Gourmets delight in gastronomic ability. Entrepreneurs delight in the excellence of our 0514 Data Flow Diagram Example Powerpoint Presentation.
Gourmets delight in gastronomic ability. Entrepreneurs delight in the excellence of our 0514 Data Flow Diagram Example Powe..
- Google Slides is a new FREE Presentation software from Google.
- All our content is 100% compatible with Google Slides.
- Just download our designs, and upload them to Google Slides and they will work automatically.
- Amaze your audience with SlideTeam and Google Slides.
-
Want Changes to This PPT Slide? Check out our Presentation Design Services
- WideScreen Aspect ratio is becoming a very popular format. When you download this product, the downloaded ZIP will contain this product in both standard and widescreen format.
-

- Some older products that we have may only be in standard format, but they can easily be converted to widescreen.
- To do this, please open the SlideTeam product in Powerpoint, and go to
- Design ( On the top bar) -> Page Setup -> and select "On-screen Show (16:9)” in the drop down for "Slides Sized for".
- The slide or theme will change to widescreen, and all graphics will adjust automatically. You can similarly convert our content to any other desired screen aspect ratio.
Compatible With Google Slides

Get This In WideScreen
You must be logged in to download this presentation.
PowerPoint presentation slides
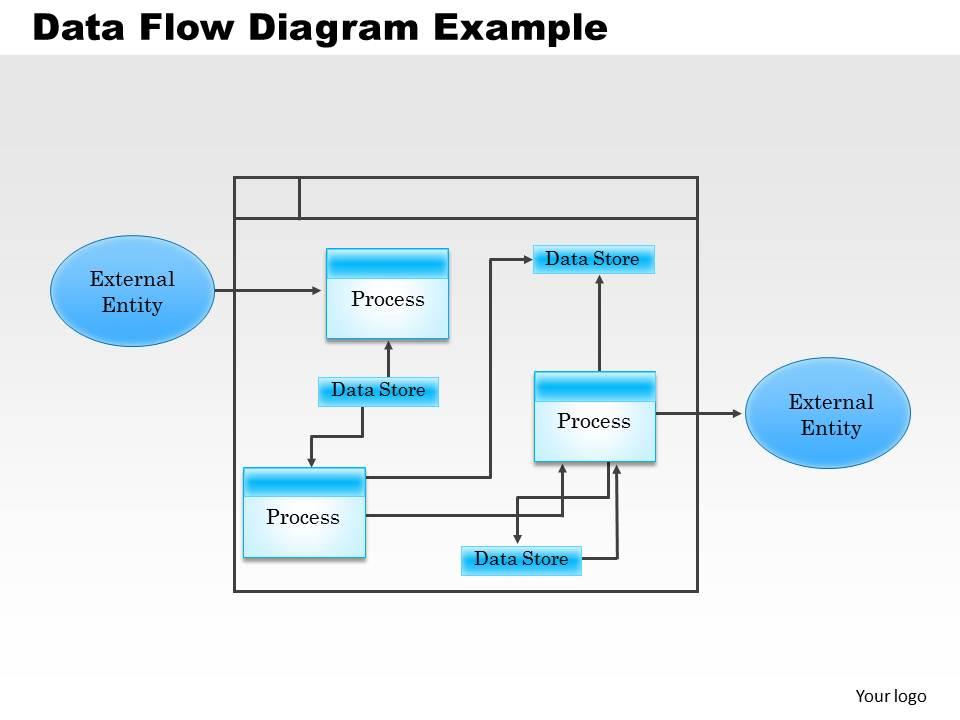
We are proud to present our 0514 data flow diagram example powerpoint presentation. This data flow diagram is useful to show steps in any business process. Define flow of data using this diagram in your presentation. This slide helps you to communicate your concerns and educate your team along the path to success
People who downloaded this PowerPoint presentation also viewed the following :
Content of this Powerpoint Presentation
Description:
The image depicts a Data Flow Diagram (DFD) example, which graphically represents how data moves through an information system. It illustrates the inputs from and outputs to various processes within the system (denoted as rectangles labeled "Process"), as well as connections to external entities (represented as oval shapes). The "Data Store" symbols (parallel lines) show where data is stored within the system. Arrows depict the flow of data between processes, data stores, and external entities. The entire system is enclosed within a larger rectangle, indicating the boundary of the system being modeled. In the bottom right corner, there is a placeholder for "Your logo," suggesting this template can be customized for different presentations or organizations.
Use Cases:
Given the versatility of DFDs, this type of slide can be utilized in various industries for demonstrating workflows, data management, system designs, and improving existing processes.
1. Information Technology:
Use: To illustrate system architecture and data processing steps.
Presenter: Systems Analyst or IT Consultant
Audience: Technical team members, Project stakeholders
2. Manufacturing:
Use: Outlining the flow of information across manufacturing processes.
Presenter: Process Engineer
Audience: Management, Operations team
3. Healthcare:
Use: Depicting patient information flow and electronic health record systems.
Presenter: Healthcare IT Specialist
Audience: Hospital administrators, Medical staff
4. Finance:
Use: Visualizing the data processing in banking systems or financial transactions.
Presenter: Financial Analyst or Business Process Manager
Audience: Bank executives, Audit and Compliance officers
5. Retail:
Use: Mapping the supply chain and inventory data flow.
Presenter: Supply Chain Analyst
Audience: Retail management, Supply chain partners
6. Education:
Use: Representing student information systems or e-learning platforms.
Presenter: Educational Technology Coordinator
Audience: Educational administrators, Teaching staff
7. Government:
Use: Showcasing information flow in public services and government administration.
Presenter: Public Sector Consultant
Audience: Government officials, Policy makers
0514 data flow diagram example powerpoint presentation with all 5 slides:
Our 0514 Data Flow Diagram Example Powerpoint Presentation help you articulate. The flow of your thoughts will be consistent.
-
Unique design & color.
-
Much better than the original! Thanks for the quick turnaround.


