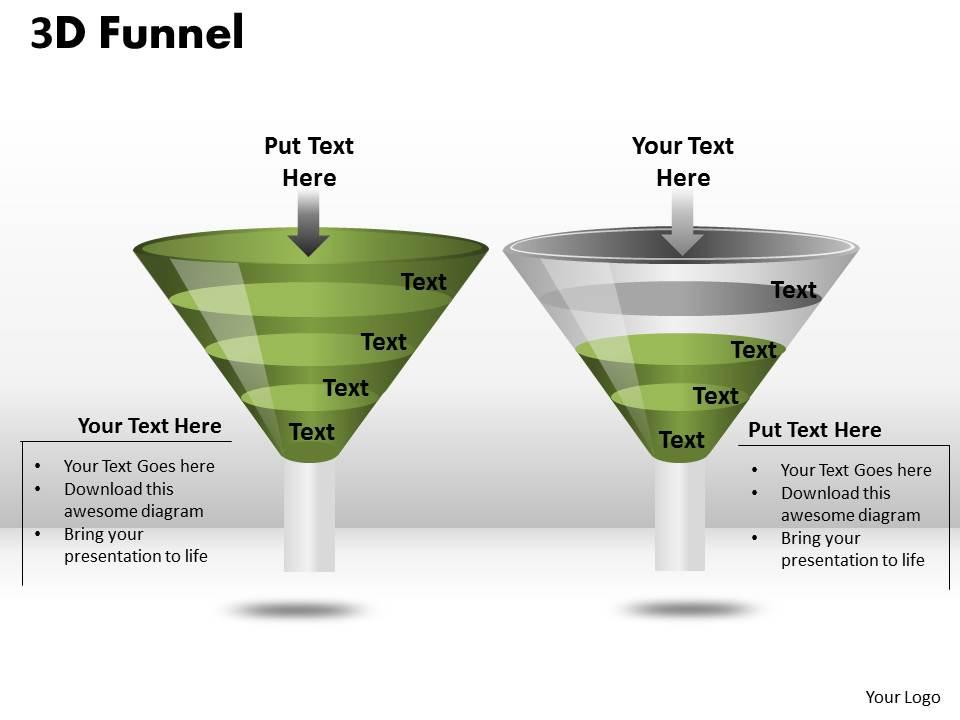
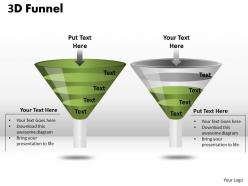
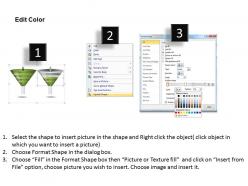
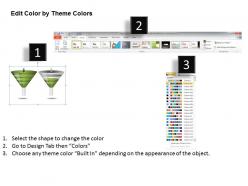
2 different usage funnel diagram

2 different usage funnel diagram
Slide 1 of 5

You must be logged in to download this presentation.

Favourites Favourites

Try Before you Buy Download Free Sample Product

Audience Impress Your
Audience
Editable 100%
Editable
Time Save Hours
of Time
The Biggest Sale is ending soon in
0
0
:
0
0
:
0
0
This template is skillfully designed and is completely editable to suit all the needs and requirements of the user. The color of the font, its size, style, and all other elements can be customized according to the user's desire The text in the PPT placeholder can be replaced with the desired information making this template highly flexible and adaptable as well. This template is also compatible with various Microsoft versions and formats like Google Slides, JPG, PDF, etc so the user will face no issue in saving it in the format of his choice.

People who downloaded this PowerPoint presentation also viewed the following :

FAQs for 2 different

**INPUT**: What are the key stages of a usage funnel diagram, and how do they impact user behavior? **OUTPUT**: Usage funnel stages include awareness, interest, consideration, trial, activation, retention, and advocacy, each representing critical user touchpoints that influence conversion decisions. These stages enable organizations to identify behavioral bottlenecks, optimize user experiences, and enhance conversion rates, with many digital platforms finding that targeted interventions at specific funnel points significantly improve customer lifetime value and reduce acquisition costs.

Businesses can effectively utilize usage funnel diagrams by identifying drop-off points in customer engagement, analyzing behavioral patterns at each stage, and implementing targeted interventions to address specific retention challenges. Through detailed funnel analysis, companies in sectors like SaaS, e-commerce, and mobile apps can streamline onboarding processes, enhance feature adoption, and deliver personalized experiences that ultimately reduce churn while maximizing customer lifetime value.

Common mistakes include oversimplifying user paths, ignoring drop-off points, using inconsistent metrics, failing to segment different user types, and neglecting mobile versus desktop behaviors. These errors undermine strategic decision-making by masking critical conversion barriers, with many organizations finding that detailed funnel analysis reveals unexpected optimization opportunities, ultimately delivering improved user experiences and higher conversion rates.

**INPUT**: How does the design of a usage funnel diagram influence stakeholder understanding? **OUTPUT**: The design of a usage funnel diagram significantly influences stakeholder understanding by providing clear visual hierarchy, logical flow progression, and intuitive data interpretation pathways. Well-designed funnels enable executives, marketing teams, and product managers to quickly identify conversion bottlenecks, resource allocation opportunities, and performance gaps, ultimately delivering enhanced decision-making capabilities and strategic alignment across organizations. **Word count: 54 words**

**INPUT**: What metrics should be tracked at each stage of the usage funnel? **OUTPUT**: Key metrics include activation rates, feature adoption percentages, user engagement frequency, retention rates, and conversion metrics at each funnel stage. These measurements enable organizations to identify bottlenecks, optimize user experiences, and enhance product stickiness, with many technology companies finding that systematic tracking ultimately delivers improved customer lifetime value and sustainable growth. [Word count: 54 words]

Segmentation enhances usage funnel insights by revealing distinct user behavior patterns across demographics, acquisition channels, product features, and engagement levels, enabling targeted optimization strategies. Through segmented analysis, organizations can identify which customer groups experience higher drop-off rates at specific stages, ultimately delivering personalized experiences and improved conversion rates across different user segments.

A/B testing integrates into usage funnel analysis by comparing conversion rates between different interface versions, testing messaging variations at each funnel stage, and experimenting with feature placements or user flows. Through systematic testing, organizations can identify optimal design elements, messaging strategies, and user pathways that maximize progression through each funnel stage, ultimately delivering higher conversion rates and improved user experiences across digital platforms.

A usage funnel diagram helps identify bottlenecks by visualizing drop-off points between customer journey stages, revealing where users abandon processes, experience friction, or fail to convert. Through data visualization, businesses can pinpoint specific obstacles in registration flows, checkout processes, or product adoption paths, enabling targeted improvements that streamline experiences, reduce abandonment rates, and ultimately enhance conversion optimization across digital touchpoints.

**INPUT**: What tools and software are best suited for creating effective usage funnel diagrams? **OUTPUT**: Effective usage funnel diagram tools include Lucidchart, Microsoft Visio, Tableau, Google Analytics funnel visualization, Miro, and specialized presentation platforms like SlideTeam. These solutions streamline data visualization by offering customizable templates, real-time analytics integration, and collaborative features, with many marketing teams finding that combining analytics platforms with design tools delivers comprehensive insights and professional presentations for stakeholder reporting. **Word count: 58 words**

Mobile and desktop experiences create distinct usage funnel patterns, with mobile typically showing higher drop-off rates at complex interaction points while desktop maintains better conversion through detailed processes. Mobile funnels often require simplified steps and touch-optimized interfaces, while desktop supports comprehensive workflows, with many organizations finding that optimizing both channels strategically enhances overall conversion rates.

User feedback plays a crucial role in refining usage funnel stages by identifying bottlenecks, revealing user pain points, and highlighting optimization opportunities at each conversion step. Through surveys, analytics, and behavioral data, organizations can streamline their funnels by addressing specific user concerns, enhancing interface design, and eliminating friction points, ultimately delivering improved conversion rates and better user experiences across digital platforms.

Businesses leverage usage funnel data to identify conversion bottlenecks, optimize customer touchpoints, and allocate marketing resources more strategically across acquisition channels. This data-driven approach enables companies to personalize messaging at each funnel stage, reduce customer acquisition costs, and improve retention rates, with many organizations finding that targeted interventions based on funnel insights significantly enhance overall marketing ROI and customer lifetime value.

Industries with complex customer journeys benefit most from usage funnel diagrams, including e-commerce, SaaS, financial services, healthcare, and telecommunications. These sectors leverage funnel analysis to streamline user onboarding, optimize conversion rates, and identify drop-off points, with many organizations finding that visual funnel mapping enhances customer retention and accelerates revenue growth.

Visualization transforms complex usage funnel data into intuitive charts, graphs, and interactive dashboards that non-technical teams can easily interpret and act upon. Through color-coded drop-off points, percentage callouts, and simplified flow diagrams, marketing, sales, and executive teams quickly identify bottlenecks, understand user behavior patterns, and make strategic decisions, ultimately enabling faster optimization and improved cross-departmental collaboration.

Netflix revolutionized user onboarding through personalized content recommendations, simplified signup processes, and strategic free trial periods, while Spotify optimized music discovery with curated playlists and social sharing features. These companies enhanced user engagement by streamlining initial experiences, reducing friction points, and implementing data-driven personalization, ultimately delivering higher conversion rates and sustained user retention across millions of global subscribers.

Ratings and Reviews

0% of 100
Review Form
Write a review
Most Relevant Reviews

No Reviews