2018 To 2021 Sales Performance Clustered Bar Chart
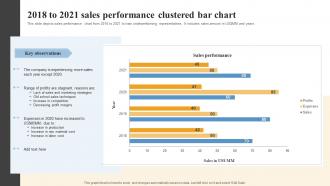
This slide depicts sales performance chart from 2018 to 2021 to train underperforming representatives. It includes sales amount in US dollar MM and years.
This slide depicts sales performance chart from 2018 to 2021 to train underperforming representatives. It includes sales a..
- Google Slides is a new FREE Presentation software from Google.
- All our content is 100% compatible with Google Slides.
- Just download our designs, and upload them to Google Slides and they will work automatically.
- Amaze your audience with SlideTeam and Google Slides.
-
Want Changes to This PPT Slide? Check out our Presentation Design Services
- WideScreen Aspect ratio is becoming a very popular format. When you download this product, the downloaded ZIP will contain this product in both standard and widescreen format.
-

- Some older products that we have may only be in standard format, but they can easily be converted to widescreen.
- To do this, please open the SlideTeam product in Powerpoint, and go to
- Design ( On the top bar) -> Page Setup -> and select "On-screen Show (16:9)” in the drop down for "Slides Sized for".
- The slide or theme will change to widescreen, and all graphics will adjust automatically. You can similarly convert our content to any other desired screen aspect ratio.
Compatible With Google Slides

Get This In WideScreen
You must be logged in to download this presentation.
PowerPoint presentation slides
This slide depicts sales performance chart from 2018 to 2021 to train underperforming representatives. It includes sales amount in US dollar MM and years. Introducing our 2018 To 2021 Sales Performance Clustered Bar Chart set of slides. The topics discussed in these slides are Sales Performance,Clustered Bar Chart,Key Observations. This is an immediately available PowerPoint presentation that can be conveniently customized. Download it and convince your audience.
People who downloaded this PowerPoint presentation also viewed the following :
2018 To 2021 Sales Performance Clustered Bar Chart with all 7 slides:
Use our 2018 To 2021 Sales Performance Clustered Bar Chart to effectively help you save your valuable time. They are readymade to fit into any presentation structure.
-
My presentations were a bit amateur before I found SlideTeam’s designs. I’ve been able to find slides for nearly every topic I’ve had to present. Thanks, Slideteam!
-
The best part about SlideTeam is their meticulously prepared presentations (complete-decks and single-slides both), infused with high-quality graphics and easy to edit. All-in-all worthy products.


