5 circle venn diagram with various colours
Our 5 Circle Venn Diagram With Various Colours are created to facilitate your efforts. They ensure you are never hard put.
Our 5 Circle Venn Diagram With Various Colours are created to facilitate your efforts. They ensure you are never hard put.
- Google Slides is a new FREE Presentation software from Google.
- All our content is 100% compatible with Google Slides.
- Just download our designs, and upload them to Google Slides and they will work automatically.
- Amaze your audience with SlideTeam and Google Slides.
-
Want Changes to This PPT Slide? Check out our Presentation Design Services
- WideScreen Aspect ratio is becoming a very popular format. When you download this product, the downloaded ZIP will contain this product in both standard and widescreen format.
-

- Some older products that we have may only be in standard format, but they can easily be converted to widescreen.
- To do this, please open the SlideTeam product in Powerpoint, and go to
- Design ( On the top bar) -> Page Setup -> and select "On-screen Show (16:9)” in the drop down for "Slides Sized for".
- The slide or theme will change to widescreen, and all graphics will adjust automatically. You can similarly convert our content to any other desired screen aspect ratio.
Compatible With Google Slides

Get This In WideScreen
You must be logged in to download this presentation.
PowerPoint presentation slides
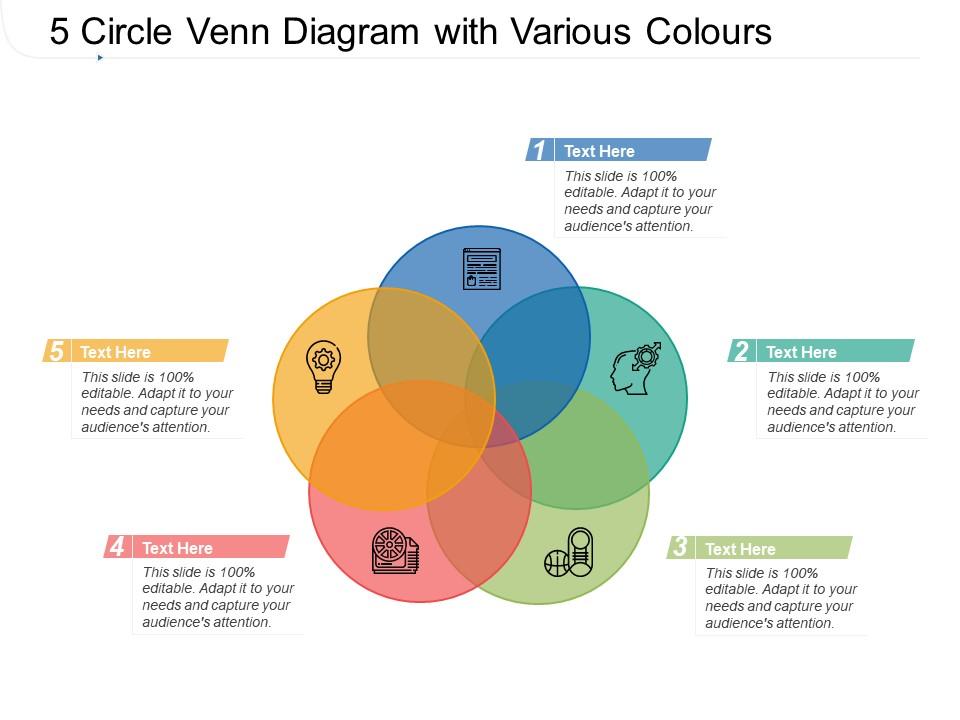
Presenting this set of slides with name 5 Circle Venn Diagram With Various Colours. This is a five stage process. The stages in this process are Circle Venn Diagram, Strategy, Market Analysis. This is a completely editable PowerPoint presentation and is available for immediate download. Download now and impress your audience.
People who downloaded this PowerPoint presentation also viewed the following :
Content of this Powerpoint Presentation
Description:
The image displays a 5 Circle Venn Diagram with various colors, where each circle represents a category that can overlap with others to demonstrate relationships or intersections between different concepts, ideas, or datasets. Each circle has a designated space with corresponding numerical labels and icons where text can be inserted to describe the content of that particular circle:
1. The blue circle at the top right corner, adorned with a document icon, indicates a category that could represent documentation or data.
2. The green circle adjacent to it features a piggy bank icon, suggesting a category related to finance or savings.
3. The red circle to the right with a bar chart icon may represent metrics, performance, or different types of measurements.
4. The purple circle at the bottom right corner has a globe icon, hinting at content related to global issues, geography, or international relations.
5. The yellow circle at the bottom left corner with a light bulb icon suggests ideas, innovation, or creativity.
Use Cases:
Potential industries and use cases for this Venn diagram could include:
1. Marketing:
Use: Identifying customer demographics overlap
Presenter: Marketing strategist
Audience: Marketing team
2. Education:
Use: Comparing educational theories or curriculum elements
Presenter: Educator
Audience: Academic colleagues or education professionals
3. Healthcare:
Use: Showing relationships between health conditions
Presenter: Medical researcher
Audience: Healthcare professionals
4. Technology:
Use: Demonstrating the convergence of different tech platforms
Presenter: Technology analyst
Audience: Tech company stakeholders
5. Environmental Science:
Use: Exploring intersections of environmental factors
Presenter: Environmental scientist
Audience: Policy makers or environmental agencies
6. Finance:
Use: Analyzing areas of investment interest
Presenter: Financial advisor
Audience: Investors or financial analysts
7. Project Management:
Use: Assessing project requirements and stakeholder influence
Presenter: Project manager
Audience: Project team members and stakeholders
5 circle venn diagram with various colours with all 5 slides:
Give them the hang of it with our 5 Circle Venn Diagram With Various Colours. They allow you to give cogent explanations.
No Reviews


