A financial research and analytics services diagram powerpoint show
Our A Financial Research And Analytics Services Diagram Powerpoint Show are handy to have around, They give you the advantage of convenience.
- Google Slides is a new FREE Presentation software from Google.
- All our content is 100% compatible with Google Slides.
- Just download our designs, and upload them to Google Slides and they will work automatically.
- Amaze your audience with SlideTeam and Google Slides.
-
Want Changes to This PPT Slide? Check out our Presentation Design Services
- WideScreen Aspect ratio is becoming a very popular format. When you download this product, the downloaded ZIP will contain this product in both standard and widescreen format.
-

- Some older products that we have may only be in standard format, but they can easily be converted to widescreen.
- To do this, please open the SlideTeam product in Powerpoint, and go to
- Design ( On the top bar) -> Page Setup -> and select "On-screen Show (16:9)” in the drop down for "Slides Sized for".
- The slide or theme will change to widescreen, and all graphics will adjust automatically. You can similarly convert our content to any other desired screen aspect ratio.
Compatible With Google Slides

Get This In WideScreen
You must be logged in to download this presentation.
PowerPoint presentation slides
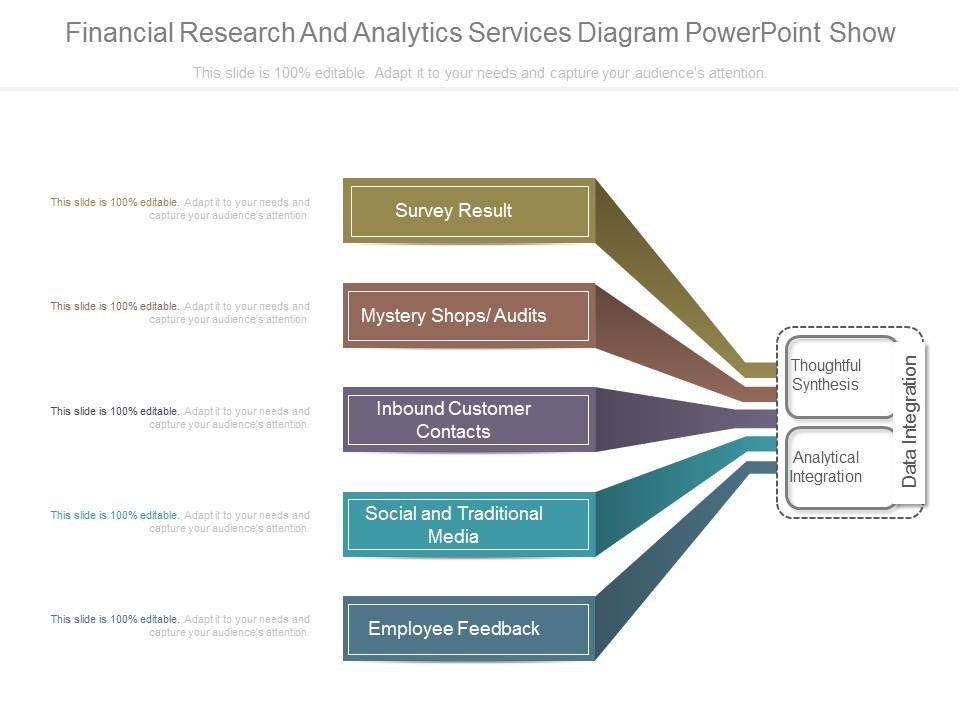
Presenting a financial research and analytics services diagram powerpoint show. This is a financial research and analytics services diagram powerpoint show. This is a five stage process. The stages in this process are survey result, mystery shops audits, inbound customer contacts, social and traditional media, employee feedback, thoughtful synthesis, analytical integration, data integration.
People who downloaded this PowerPoint presentation also viewed the following :
A financial research and analytics services diagram powerpoint show with all 7 slides:
Achievements become glorious with our A Financial Research And Analytics Services Diagram Powerpoint Show. Actions acquire that extra edge.
-
Wonderful templates design to use in business meetings.
-
Great designs, really helpful.


