Achieving optimal debt equity mix understanding capital structure of firm ppt graphics
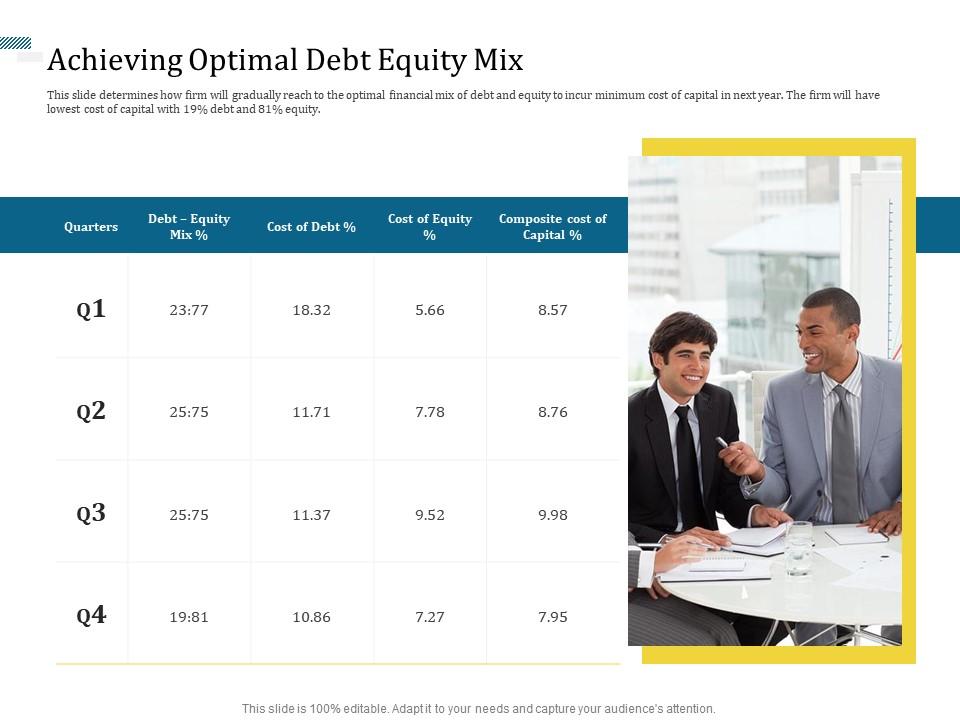
This slide determines how firm will gradually reach to the optimal financial mix of debt and equity to incur minimum cost of capital in next year. The firm will have lowest cost of capital with 19 percent debt and 81 percent equity
- Google Slides is a new FREE Presentation software from Google.
- All our content is 100% compatible with Google Slides.
- Just download our designs, and upload them to Google Slides and they will work automatically.
- Amaze your audience with SlideTeam and Google Slides.
-
Want Changes to This PPT Slide? Check out our Presentation Design Services
- WideScreen Aspect ratio is becoming a very popular format. When you download this product, the downloaded ZIP will contain this product in both standard and widescreen format.
-

- Some older products that we have may only be in standard format, but they can easily be converted to widescreen.
- To do this, please open the SlideTeam product in Powerpoint, and go to
- Design ( On the top bar) -> Page Setup -> and select "On-screen Show (16:9)” in the drop down for "Slides Sized for".
- The slide or theme will change to widescreen, and all graphics will adjust automatically. You can similarly convert our content to any other desired screen aspect ratio.
Compatible With Google Slides

Get This In WideScreen
You must be logged in to download this presentation.
PowerPoint presentation slides
This slide determines how firm will gradually reach to the optimal financial mix of debt and equity to incur minimum cost of capital in next year. The firm will have lowest cost of capital with 19 percent debt and 81 percent equity. Increase audience engagement and knowledge by dispensing information using Achieving Optimal Debt Equity Mix Understanding Capital Structure Of Firm Ppt Graphics. This template helps you present information on four stages. You can also present information on Cost Of Equity, Composite Cost Of Capital, Achieving Optimal Debt Equity Mix using this PPT design. This layout is completely editable so personaize it now to meet your audiences expectations.
People who downloaded this PowerPoint presentation also viewed the following :
Achieving optimal debt equity mix understanding capital structure of firm ppt graphics with all 2 slides:
Use our Achieving Optimal Debt Equity Mix Understanding Capital Structure Of Firm Ppt Graphics to effectively help you save your valuable time. They are readymade to fit into any presentation structure.
-
Great designs, really helpful.
-
Perfect template with attractive color combination.


