Activity ratios ppt examples
Ensure every individual is aware of your expectations with our Activity Ratios Ppt Examples. Be able to exercise close control.
Ensure every individual is aware of your expectations with our Activity Ratios Ppt Examples. Be able to exercise close con..
- Google Slides is a new FREE Presentation software from Google.
- All our content is 100% compatible with Google Slides.
- Just download our designs, and upload them to Google Slides and they will work automatically.
- Amaze your audience with SlideTeam and Google Slides.
-
Want Changes to This PPT Slide? Check out our Presentation Design Services
- WideScreen Aspect ratio is becoming a very popular format. When you download this product, the downloaded ZIP will contain this product in both standard and widescreen format.
-

- Some older products that we have may only be in standard format, but they can easily be converted to widescreen.
- To do this, please open the SlideTeam product in Powerpoint, and go to
- Design ( On the top bar) -> Page Setup -> and select "On-screen Show (16:9)” in the drop down for "Slides Sized for".
- The slide or theme will change to widescreen, and all graphics will adjust automatically. You can similarly convert our content to any other desired screen aspect ratio.
Compatible With Google Slides

Get This In WideScreen
You must be logged in to download this presentation.
PowerPoint presentation slides
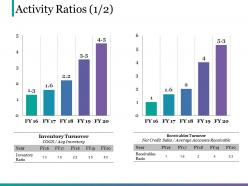
Presenting this set of slides with name - Activity Ratios Ppt Examples. This is a two stage process. The stages in this process are Business, Marketing, Finance, Inventory Turnover, Receivables Turnover.
People who downloaded this PowerPoint presentation also viewed the following :
Content of this Powerpoint Presentation
Description:
The image consists of two bar charts under the heading "Activity Ratios (1/2)" that visualize financial performance indicators of an unnamed company over five fiscal years (FY16 to FY20). The left chart is labeled "Inventory Turnover" and illustrates the ratio of the Cost of Goods Sold (COGS) to the Average Inventory. The right chart displays the "Receivables Turnover" ratio, which measures the efficiency of the company's credit control by dividing Net Credit Sales by the Average Accounts Receivable. Both charts show a consistent increase from FY16 to FY20, indicating an improvement in the management of inventory and receivables during this period. The bars in the charts are annotated with their respective ratio values.
Use Cases:
These slides can be applied in various industries that require efficiency in managing inventory and accounts receivable, including:
1. Retail:
Use: To evaluate inventory management efficiency.
Presenter: Financial Analyst.
Audience: Retail Management Team.
2. Manufacturing:
Use: To demonstrate improvements in supply chain efficiencies.
Presenter: Supply Chain Manager.
Audience: Company Stakeholders.
3. Healthcare:
Use: To assess hospital or clinic inventory turnover and billing practices.
Presenter: Hospital Administrator.
Audience: Healthcare Investors.
4. Technology:
Use: To show how effectively the company is converting receivables into cash.
Presenter: CFO or Financial Controller.
Audience: Shareholders.
5. Automotive:
Use: To track parts inventory turnover about sales performance.
Presenter: Operations Manager.
Audience: Dealership Owners.
6. Food and Beverage:
Use: To analyze product turnover and payment collection cycles.
Presenter: Business Operations Specialist.
Audience: Business Partners and Suppliers.
7. Wholesale Distribution:
Use: To measure the efficiency of inventory distribution and client payment processes.
Presenter: Distribution Manager.
Audience: Distribution Network Members.
Activity ratios ppt examples with all 5 slides:
Be in control at the helm of affairs with our Activity Ratios Ppt Examples. Acquire the authority to decide the course.
-
Best Representation of topics, really appreciable.
-
Easily Editable.


