Augmented Analytics IT Powerpoint Presentation Slides
This presentation briefly explains the business problems, augmented analytics implementation, and post implementation. In this Augmented Analytics PowerPoint Presentation, we have covered the companys current situation, the gap in the organization, and the need for augmented analytics by covering the importance, purpose of increased analytics, and business value. In addition, this PPT contains the overview of augmented analytics by covering overview, features, techniques that make up augmented analytics, and benefits of augmented analytics. It also comprises the relationship of augmented analytics with machine learning, automation, and business intelligence. Also, the presentation includes the augmented analytics implementation, training, and budget. Furthermore, this Augmented Analytics template comprises a 30 60 90 days plan, a roadmap, and a data visualization dashboard. Download our 100 percent editable and customizable template, which is also compatible with Google Slides.
This presentation briefly explains the business problems, augmented analytics implementation, and post implementation. In t..
- Google Slides is a new FREE Presentation software from Google.
- All our content is 100% compatible with Google Slides.
- Just download our designs, and upload them to Google Slides and they will work automatically.
- Amaze your audience with SlideTeam and Google Slides.
-
Want Changes to This PPT Slide? Check out our Presentation Design Services
- WideScreen Aspect ratio is becoming a very popular format. When you download this product, the downloaded ZIP will contain this product in both standard and widescreen format.
-

- Some older products that we have may only be in standard format, but they can easily be converted to widescreen.
- To do this, please open the SlideTeam product in Powerpoint, and go to
- Design ( On the top bar) -> Page Setup -> and select "On-screen Show (16:9)” in the drop down for "Slides Sized for".
- The slide or theme will change to widescreen, and all graphics will adjust automatically. You can similarly convert our content to any other desired screen aspect ratio.
Compatible With Google Slides

Get This In WideScreen
You must be logged in to download this presentation.
PowerPoint presentation slides
Deliver this complete deck to your team members and other collaborators. Encompassed with stylized slides presenting various concepts, this Augmented Analytics IT Powerpoint Presentation Slides is the best tool you can utilize. Personalize its content and graphics to make it unique and thought-provoking. All the fifty three slides are editable and modifiable, so feel free to adjust them to your business setting. The font, color, and other components also come in an editable format making this PPT design the best choice for your next presentation. So, download now.
People who downloaded this PowerPoint presentation also viewed the following :
Content of this Powerpoint Presentation
Slide 1: This slide introduces Augmented Analytics (IT). State Your Company Name and begin.
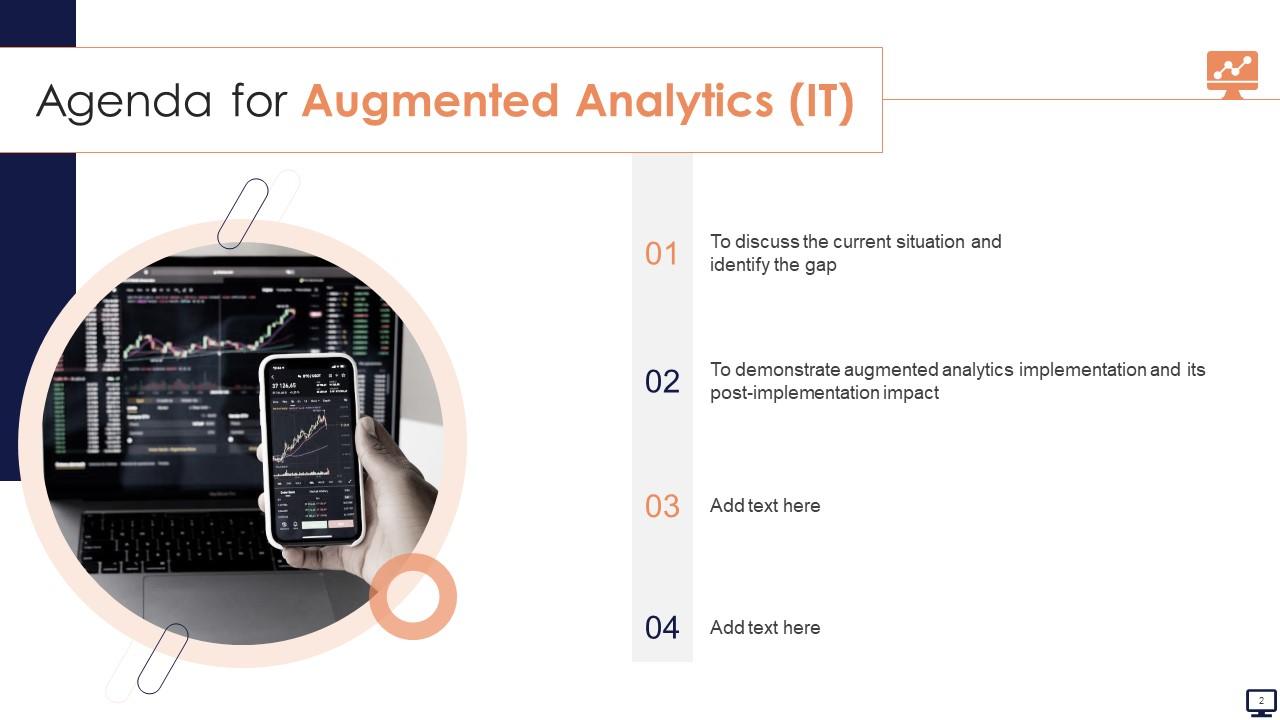
Slide 2: This slide states Agenda of the presentation.
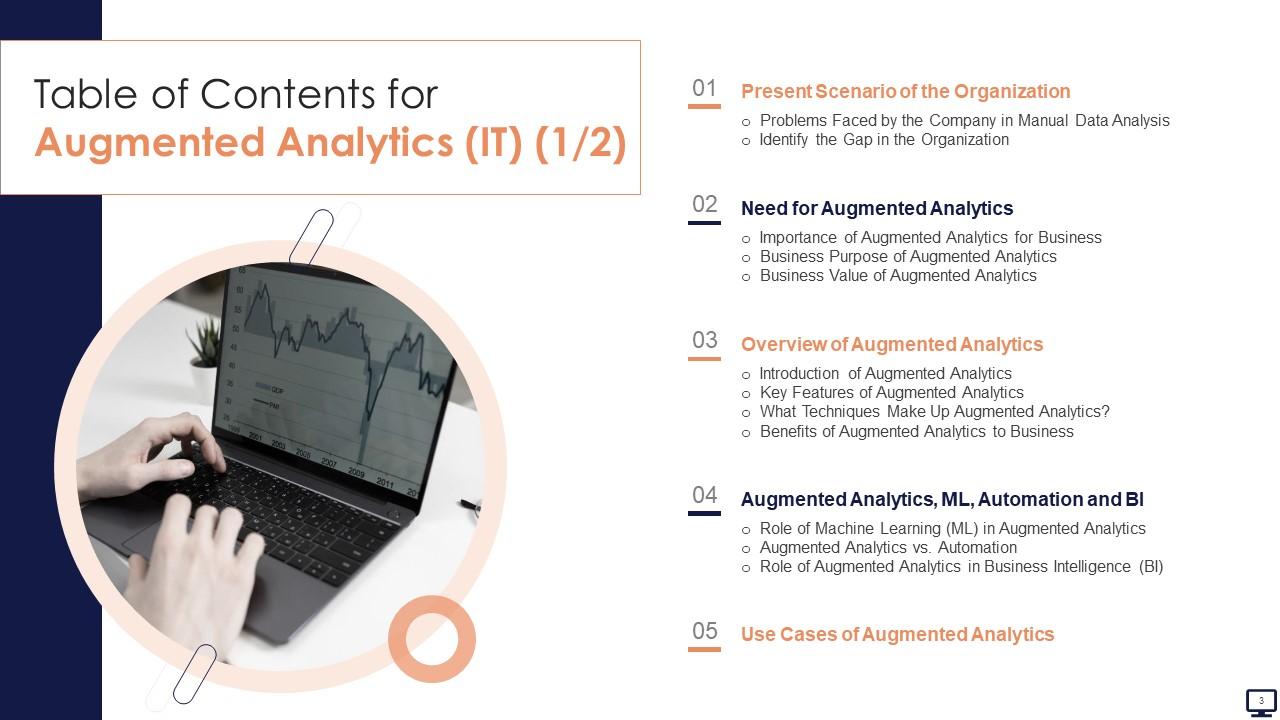
Slide 3: This slide presents Table of Content for the presentation.
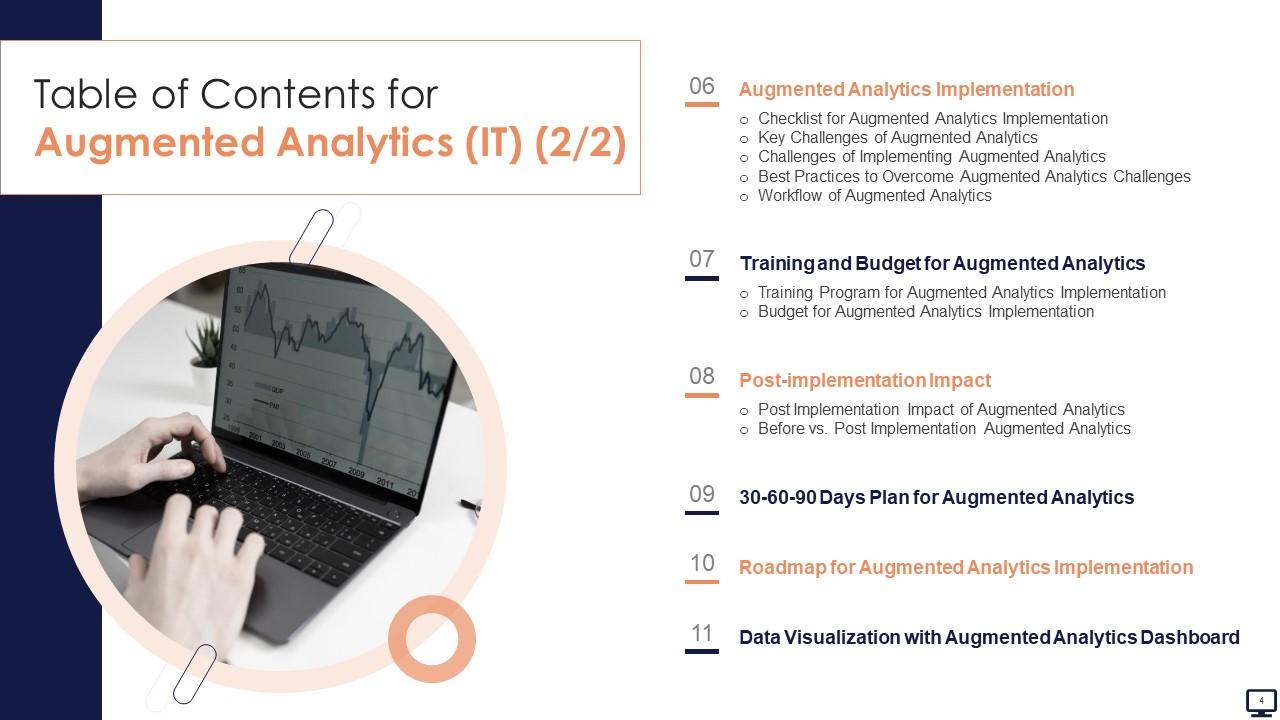
Slide 4: This is another slide continuing Table of Content for the presentation.
Slide 5: This slide highlights title for topics that are to be covered next in the template.
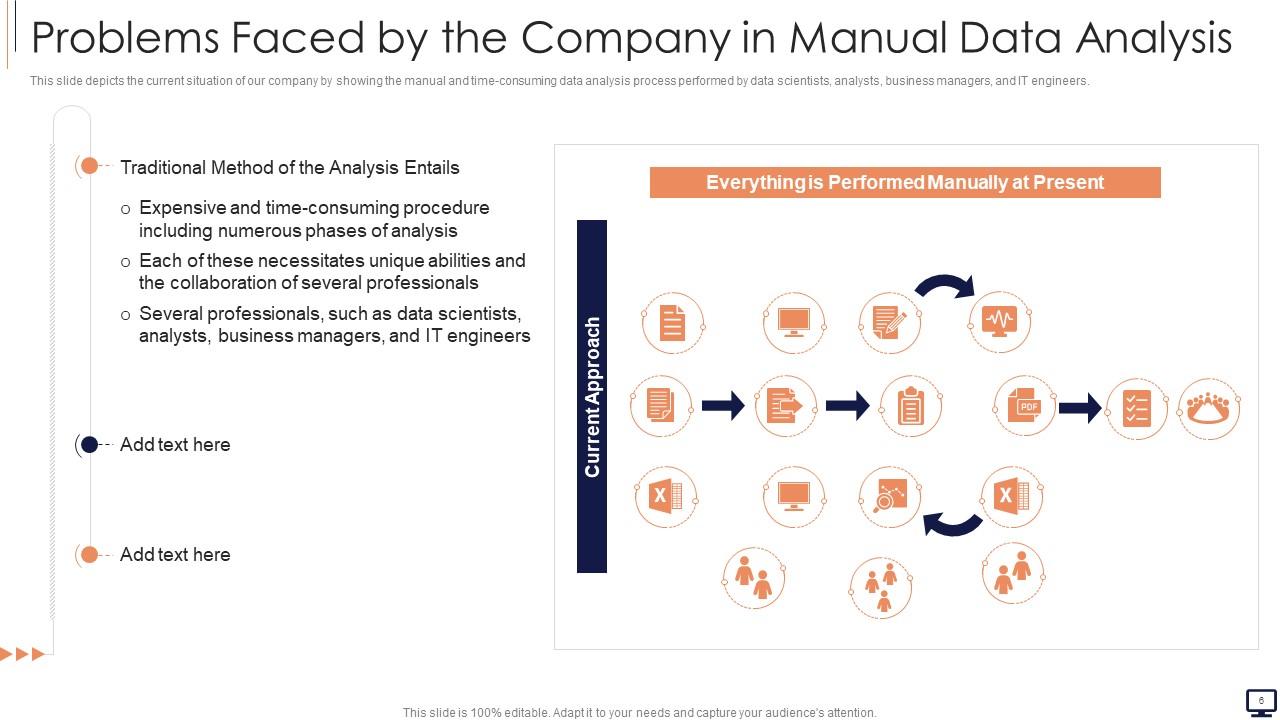
Slide 6: This slide displays Problems Faced by the Company in Manual Data Analysis.
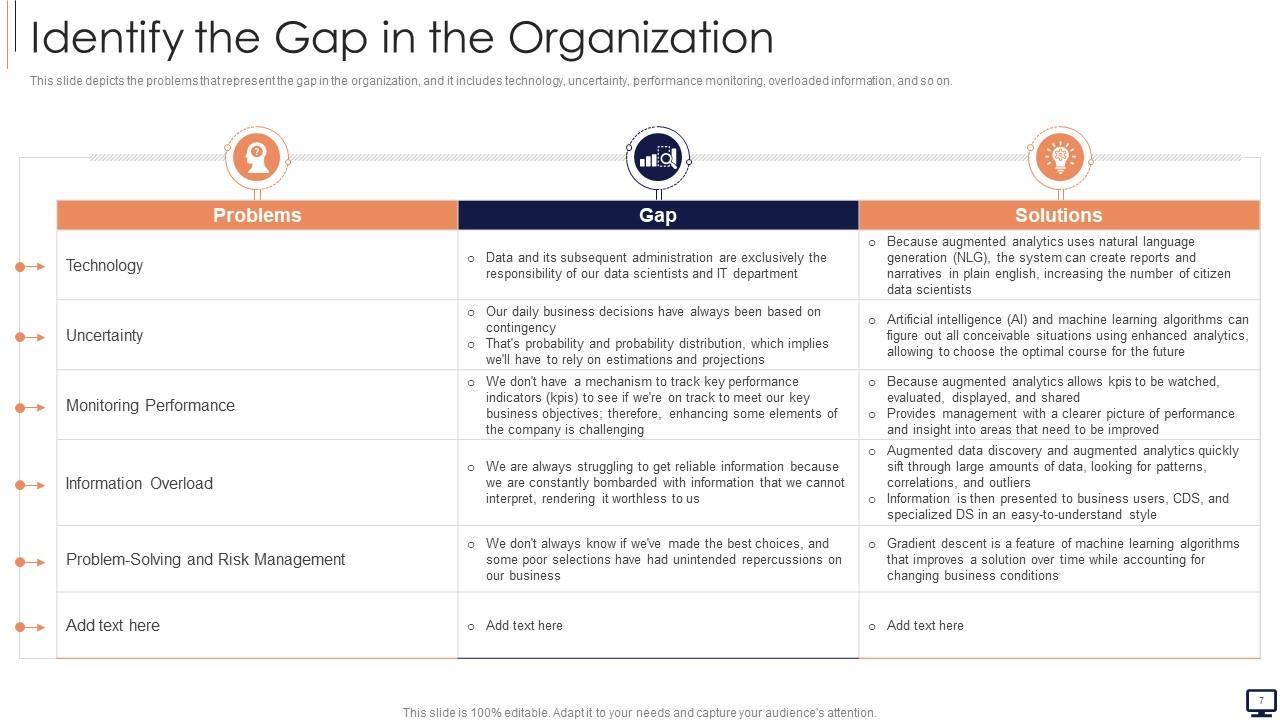
Slide 7: This slide depicts the problems that represent the gap in the organization.
Slide 8: This slide highlights title for topics that are to be covered next in the template.
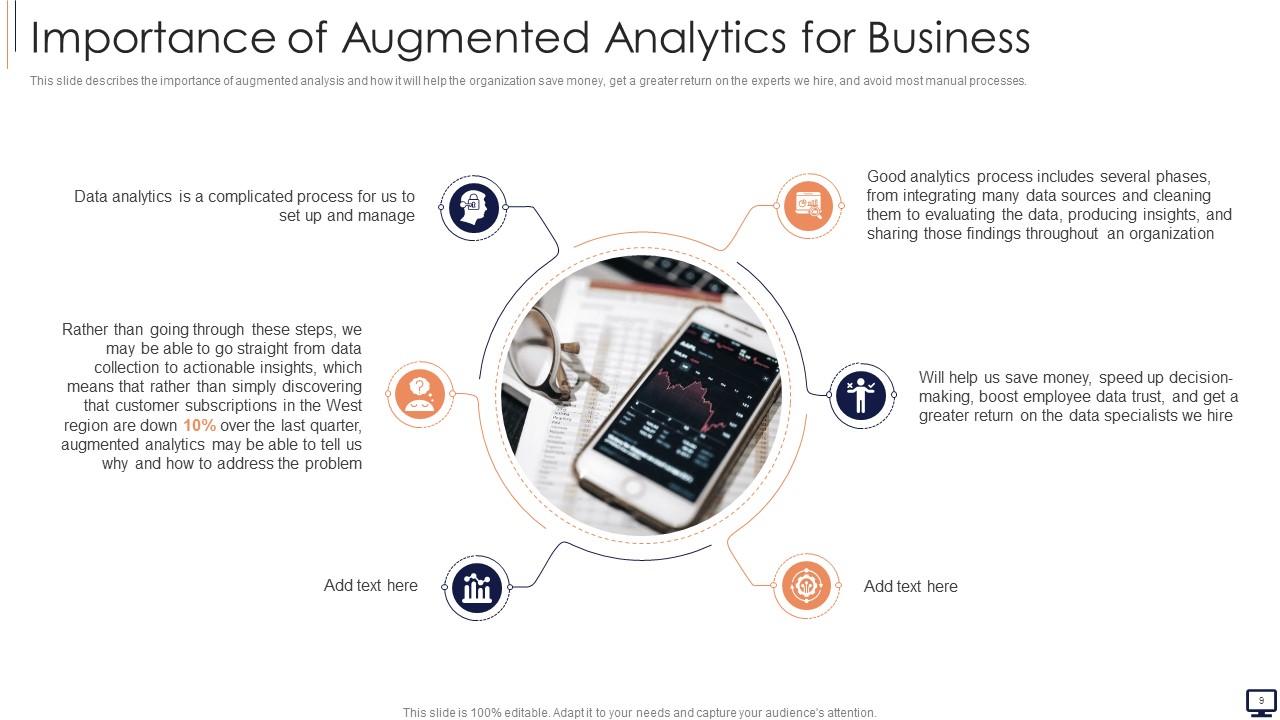
Slide 9: This slide represents Importance of Augmented Analytics for Business.
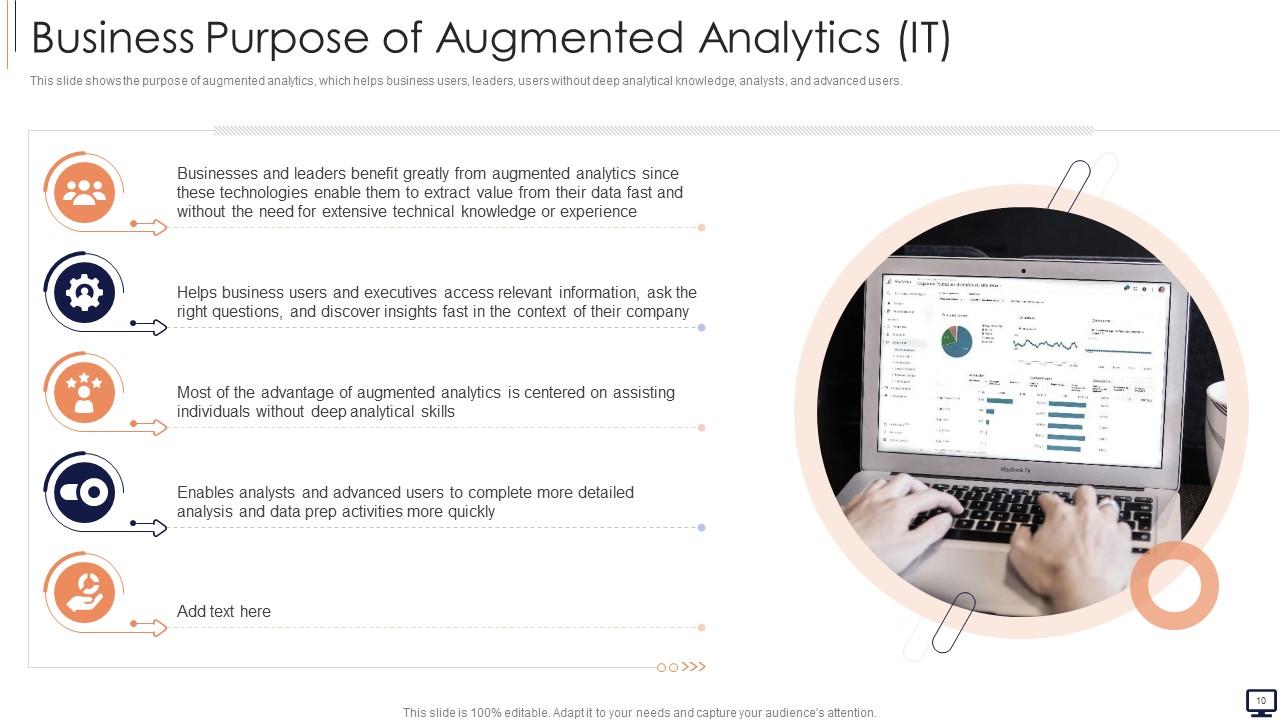
Slide 10: This slide showcases Business Purpose of Augmented Analytics.
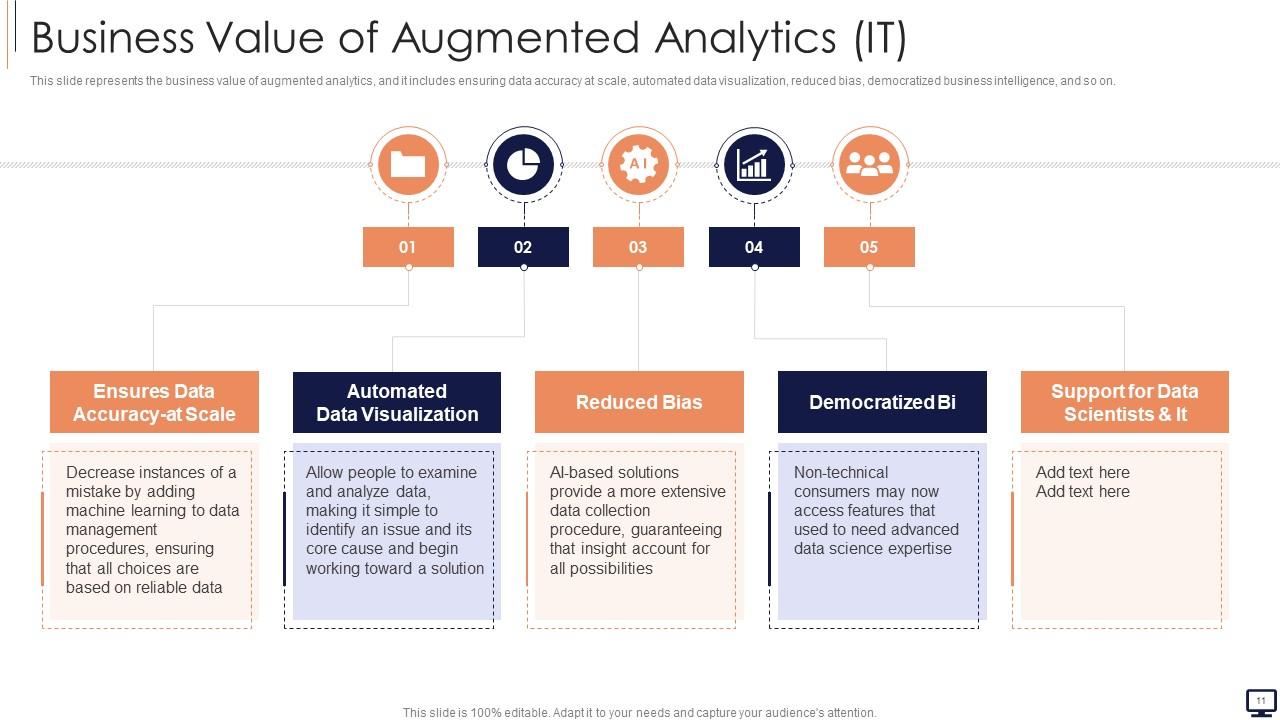
Slide 11: This slide represents the business value of augmented analytics.
Slide 12: This slide highlights title for topics that are to be covered next in the template.
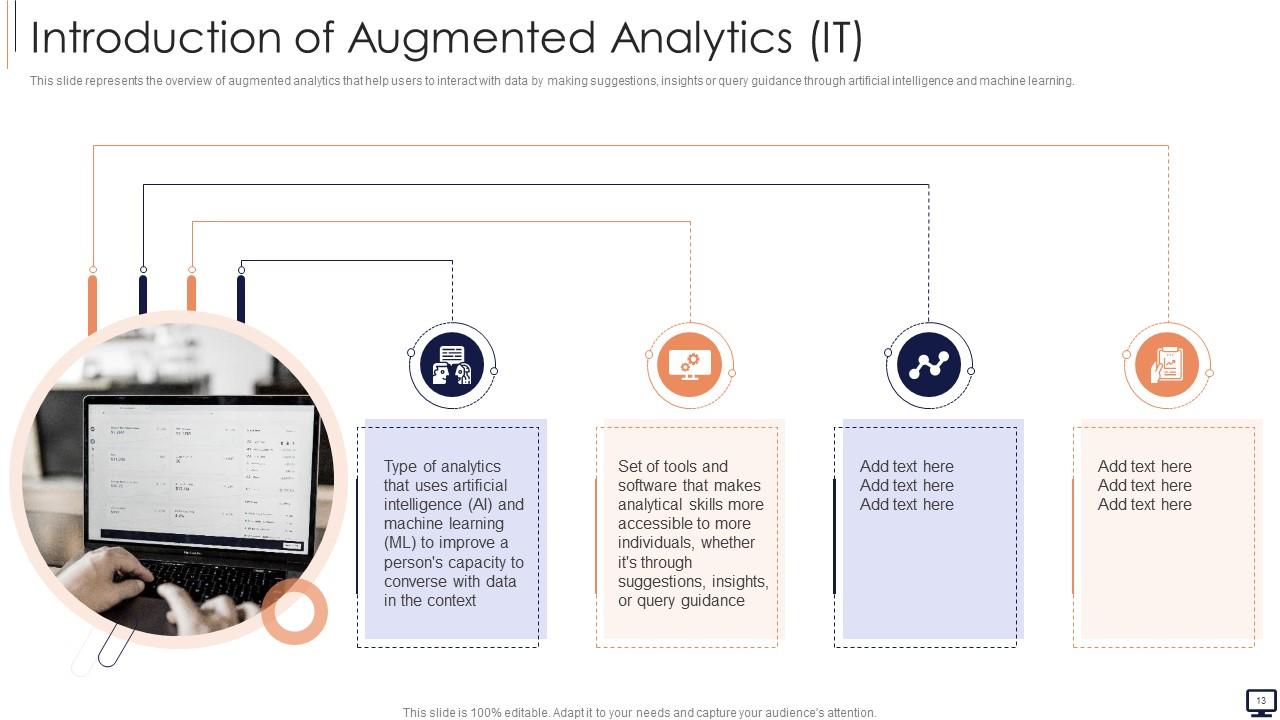
Slide 13: This slide showcases overview of augmented analytics that help users to interact with data.
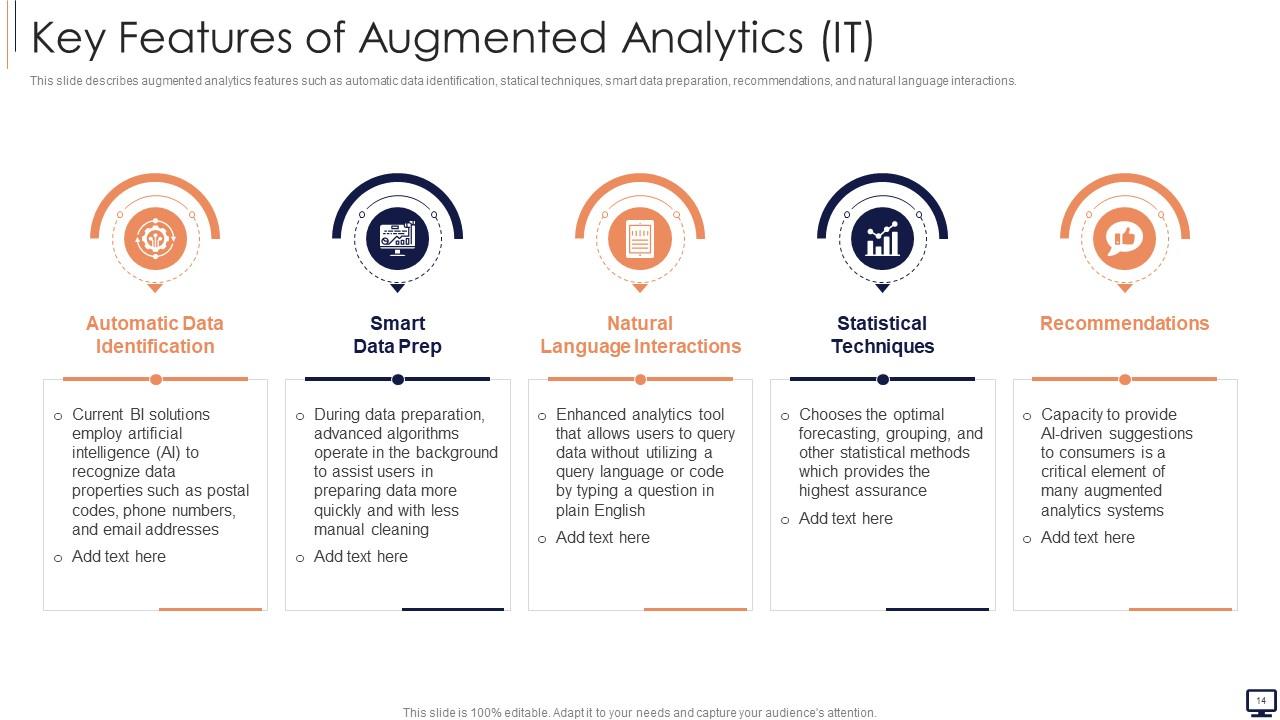
Slide 14: This slide describes augmented analytics features such as automatic data identification, statical techniques, smart data preparation, etc.
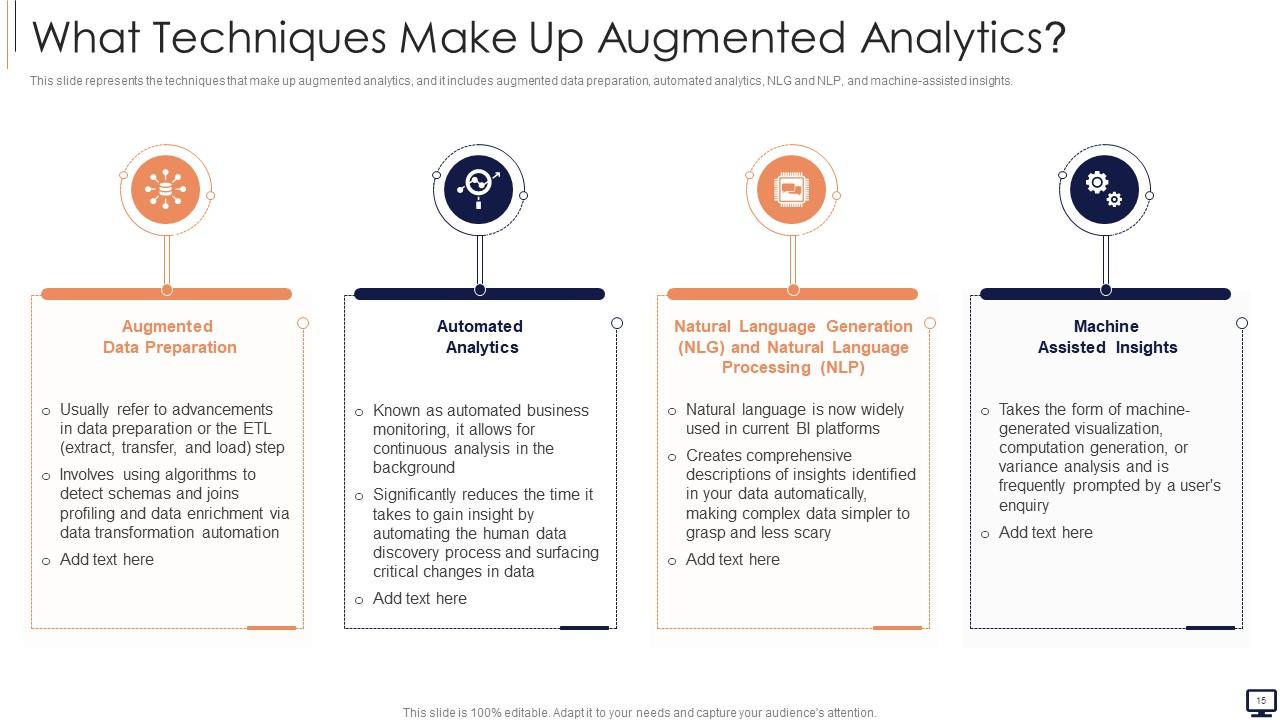
Slide 15: This slide shows What Techniques Make Up Augmented Analytics.
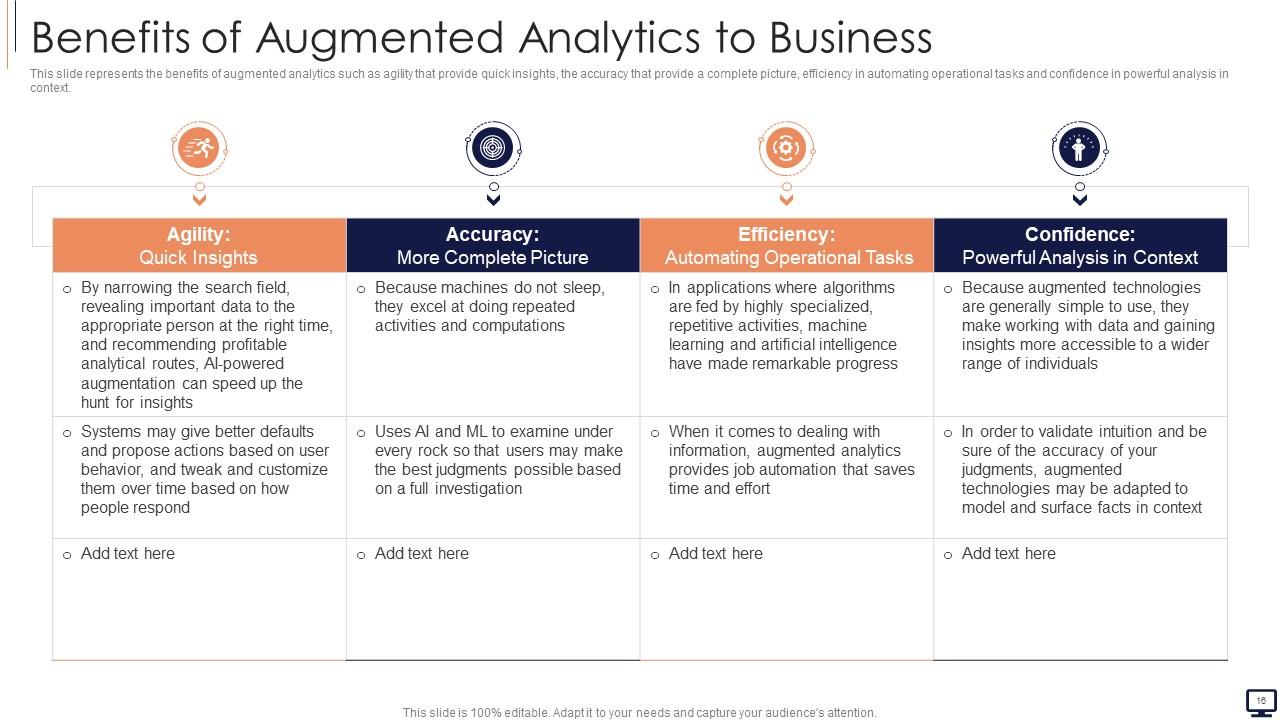
Slide 16: This slide presents Benefits of Augmented Analytics to Business.
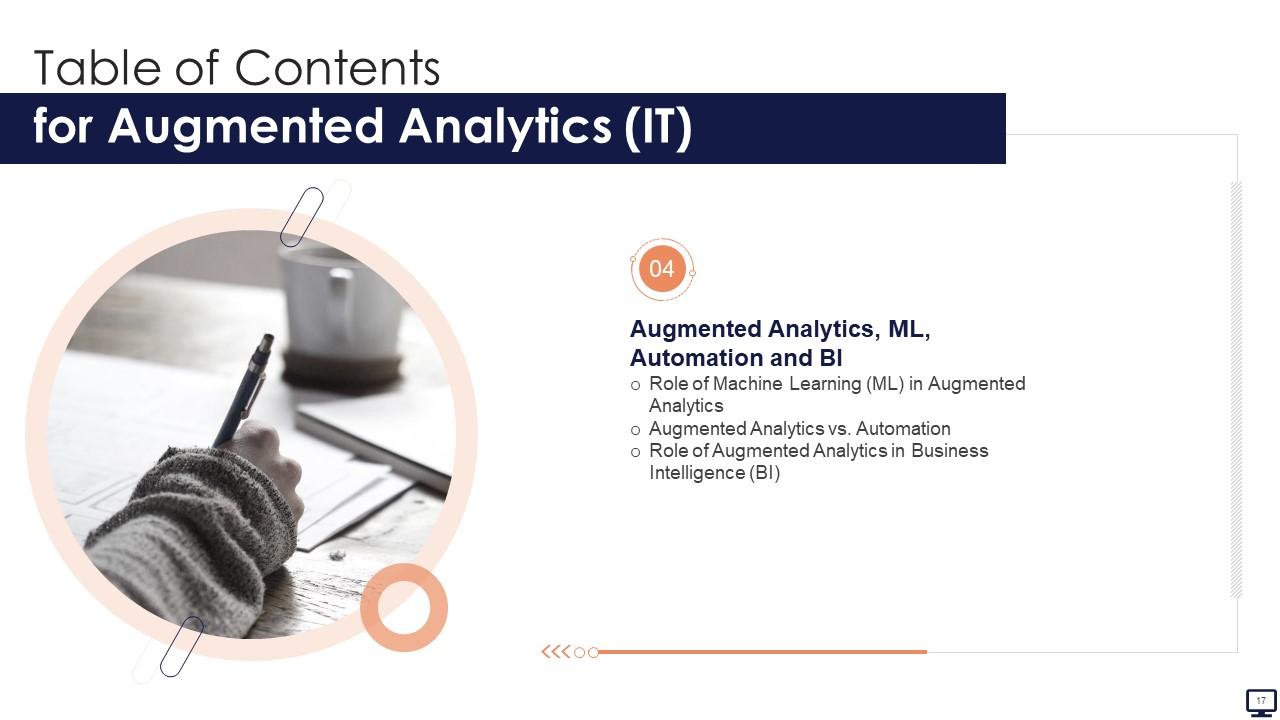
Slide 17: This slide highlights title for topics that are to be covered next in the template.
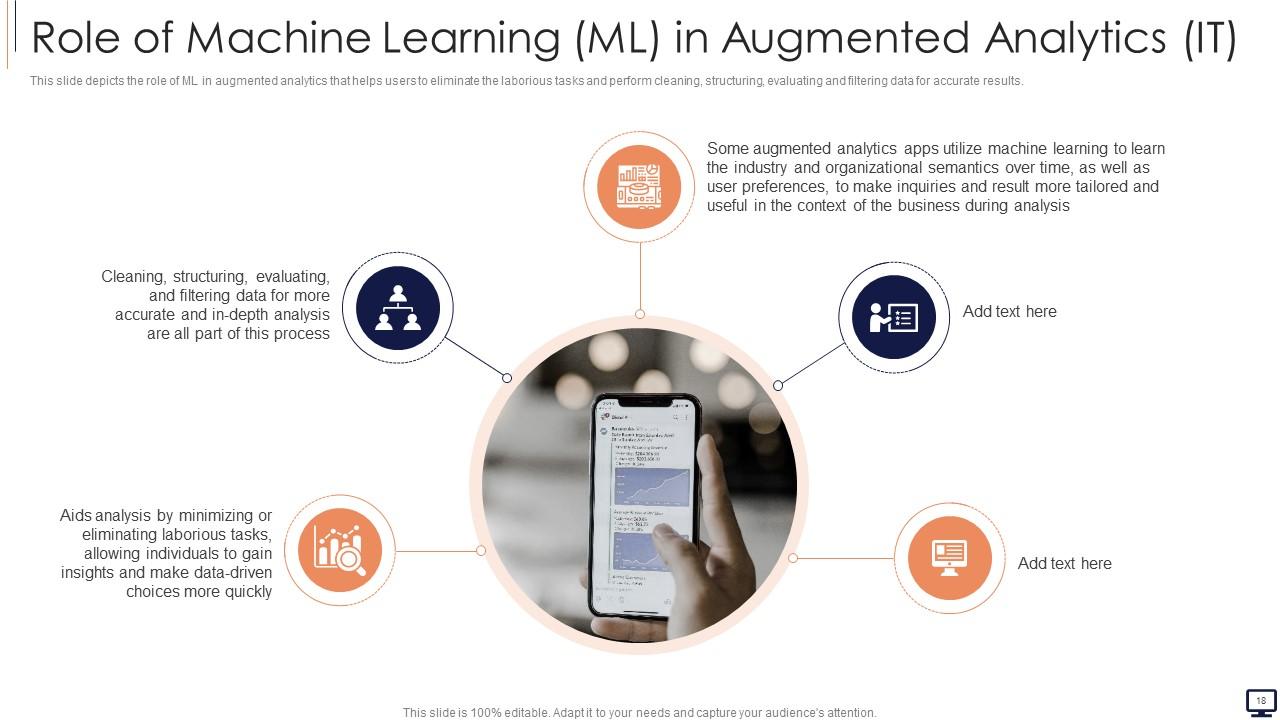
Slide 18: This slide displays Role of Machine Learning (ML) in Augmented Analytics.
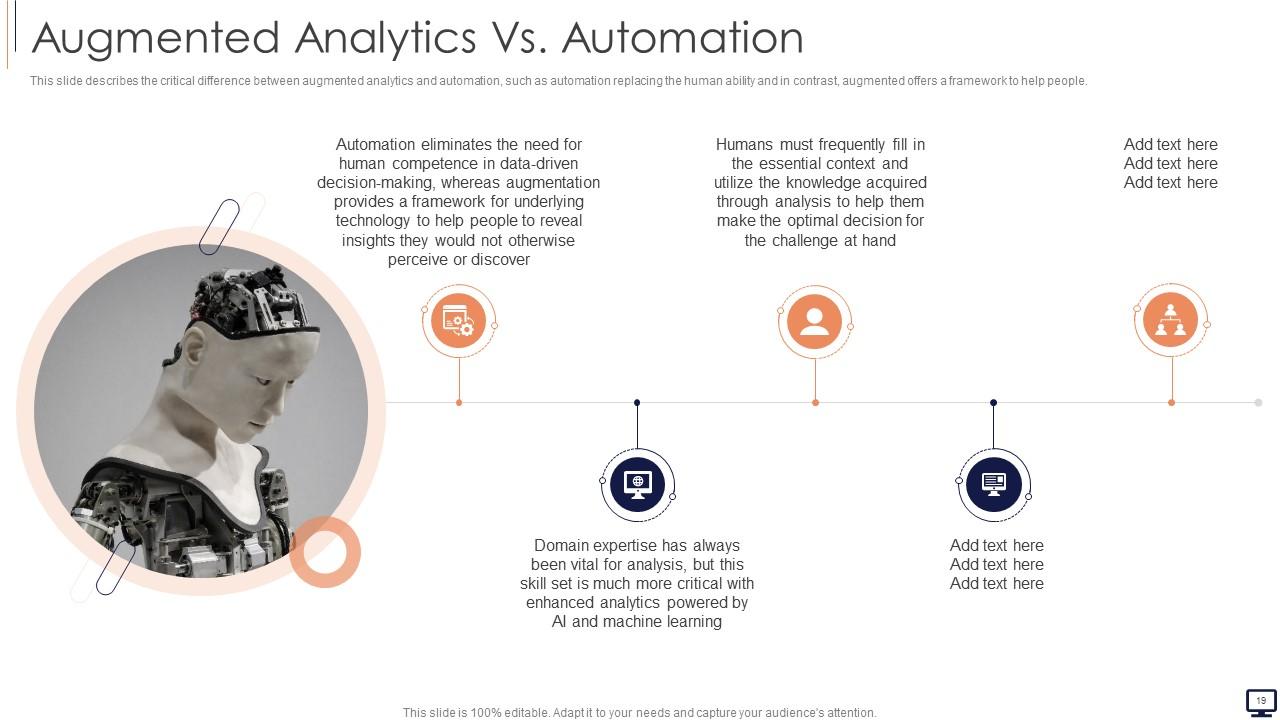
Slide 19: This slide describes the critical difference between augmented analytics and automation.
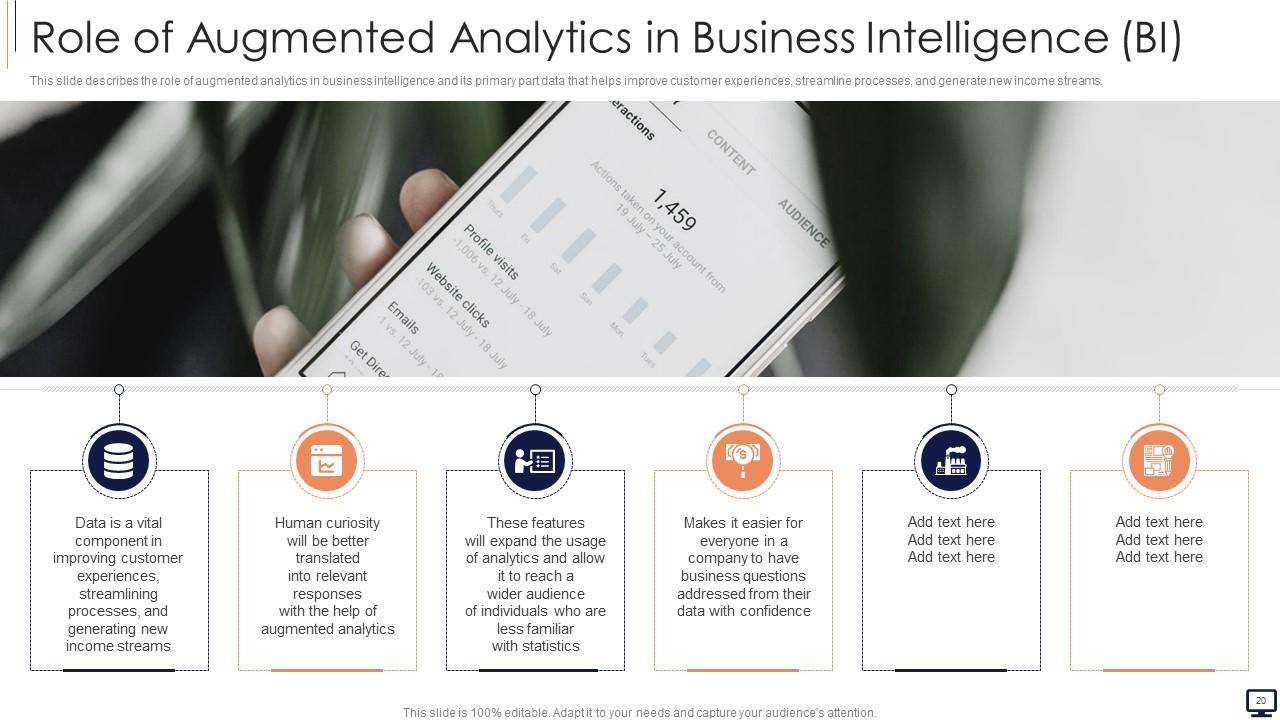
Slide 20: This slide represents Role of Augmented Analytics in Business Intelligence (BI).
Slide 21: This slide highlights title for topics that are to be covered next in the template.
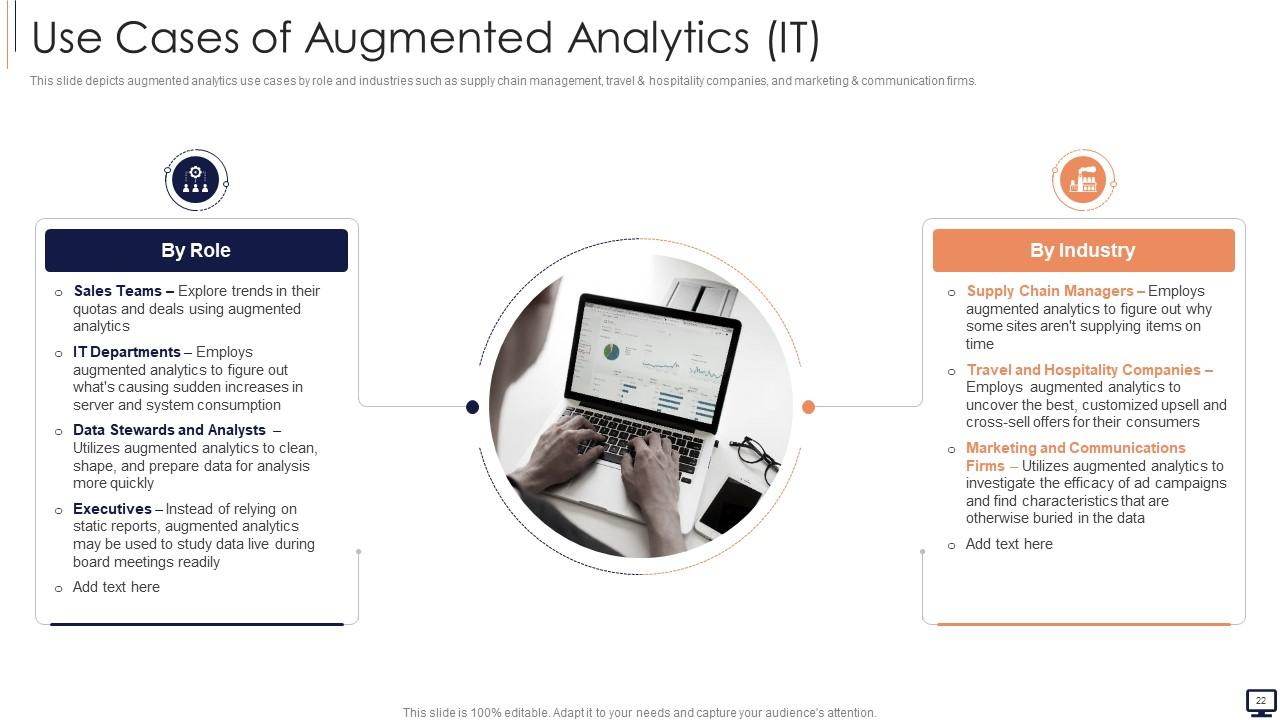
Slide 22: This slide depicts augmented analytics use cases by role and industries.
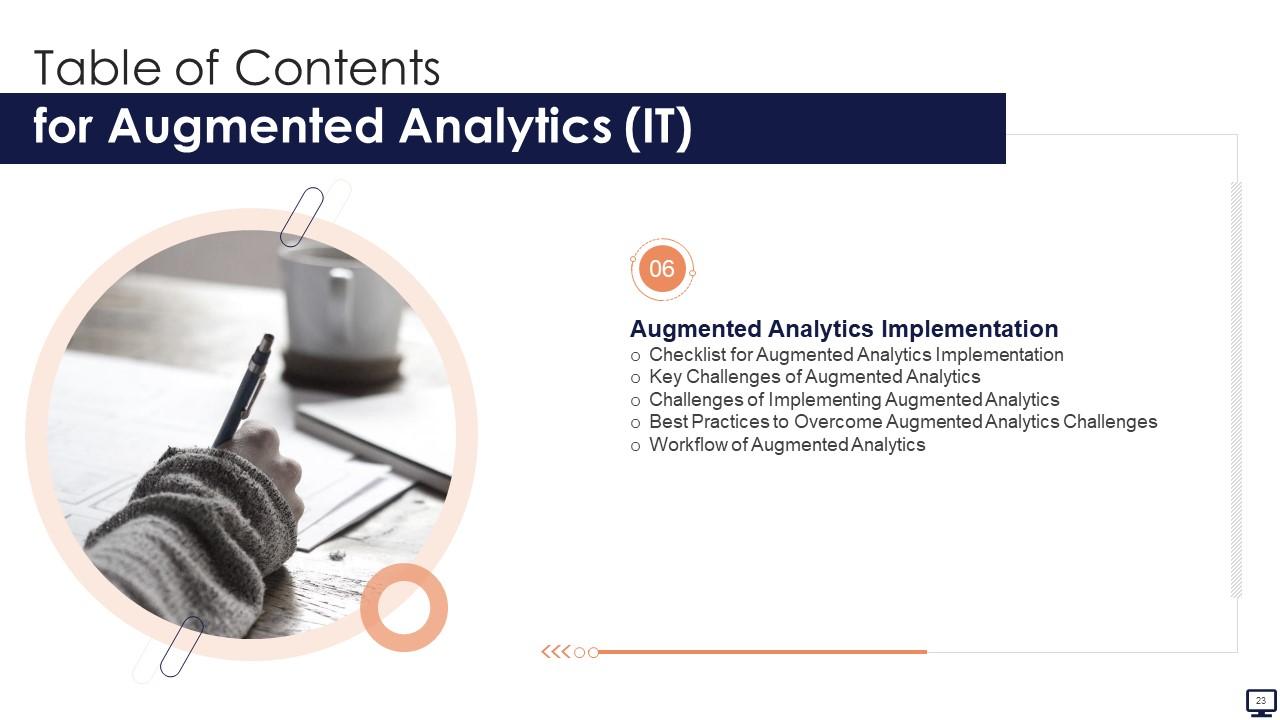
Slide 23: This slide highlights title for topics that are to be covered next in the template.
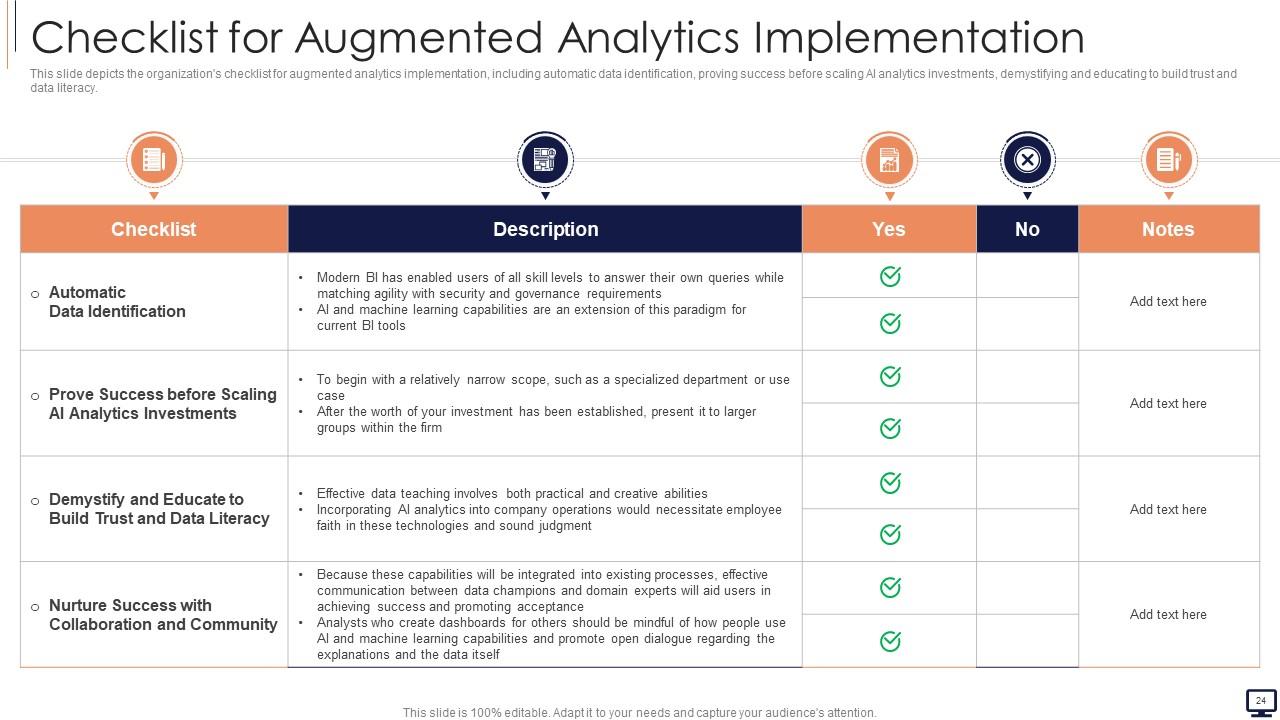
Slide 24: This slide showcases Checklist for Augmented Analytics Implementation.
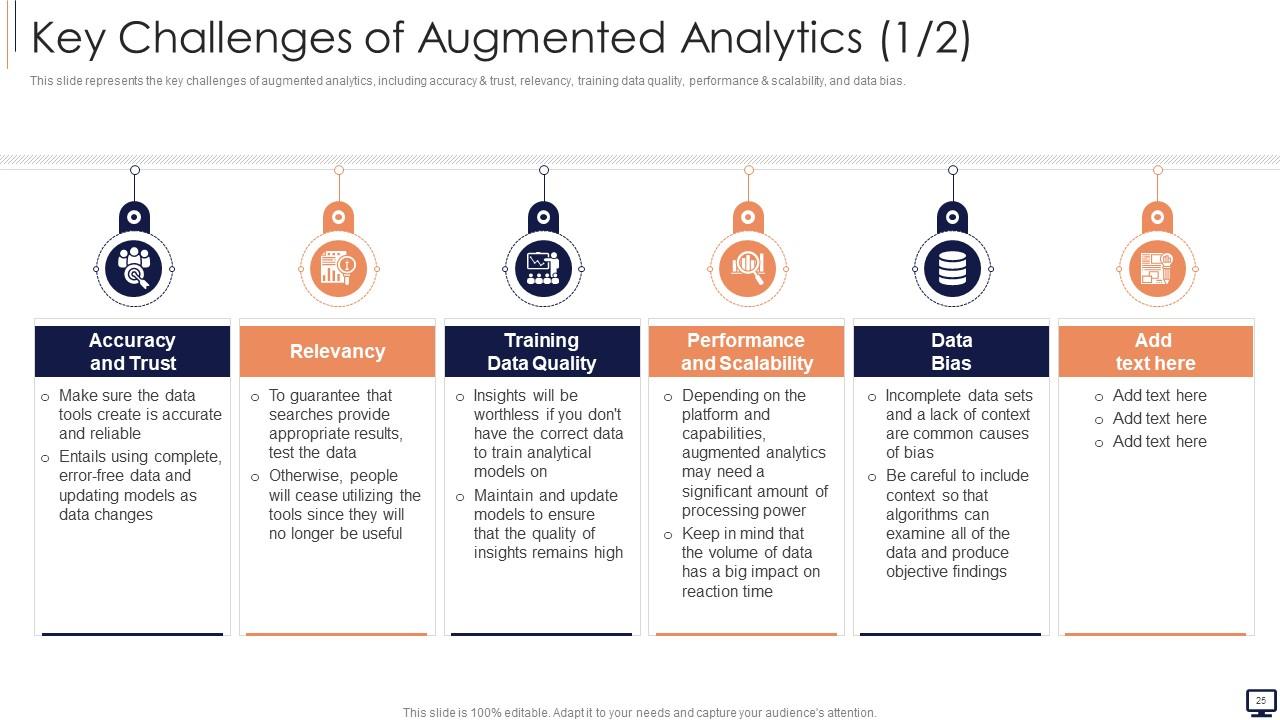
Slide 25: This slide shows Key Challenges of Augmented Analytics.
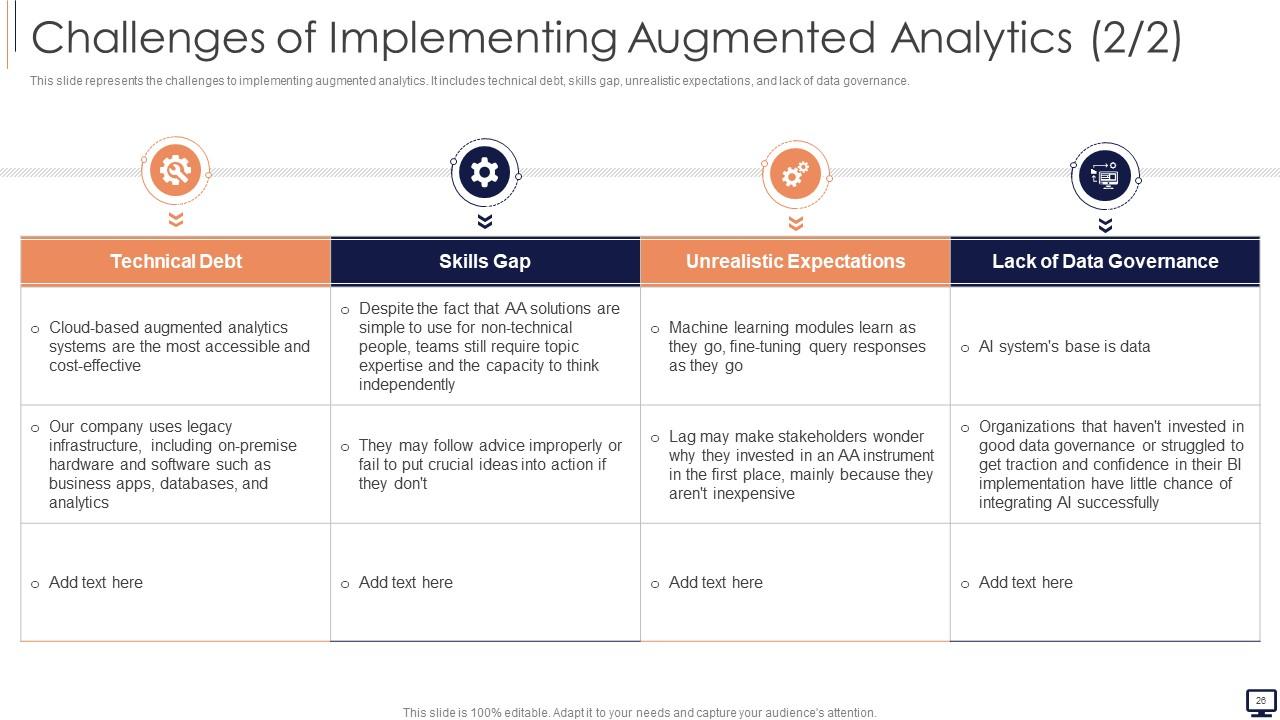
Slide 26: This is another slide continuing Challenges of Implementing Augmented Analytics.
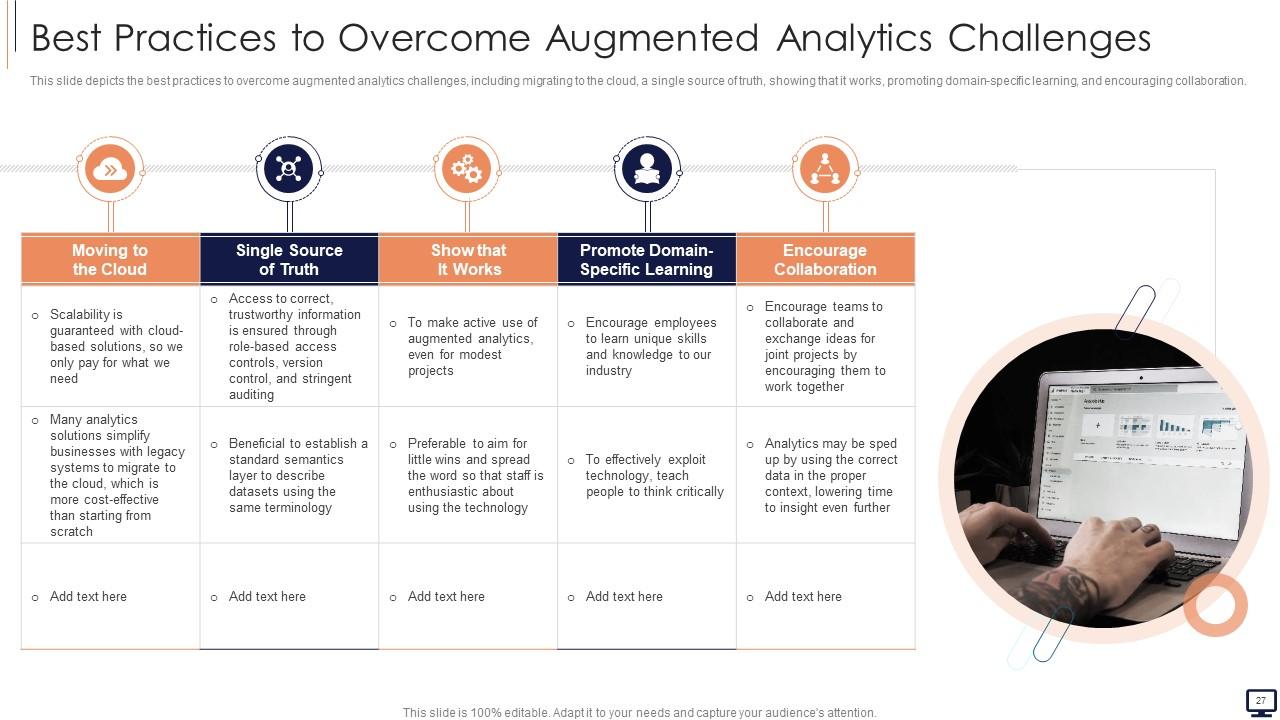
Slide 27: This slide presents Best Practices to Overcome Augmented Analytics Challenges.
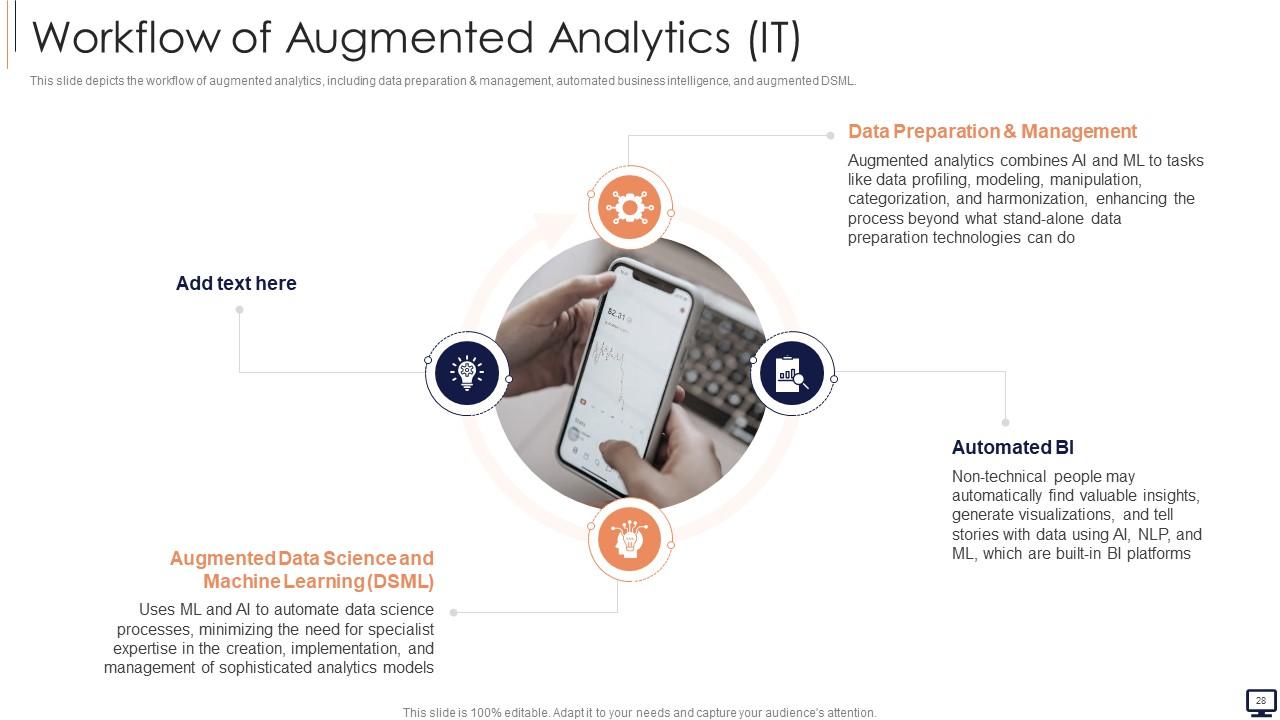
Slide 28: This slide depicts the workflow of augmented analytics, including data preparation & management.
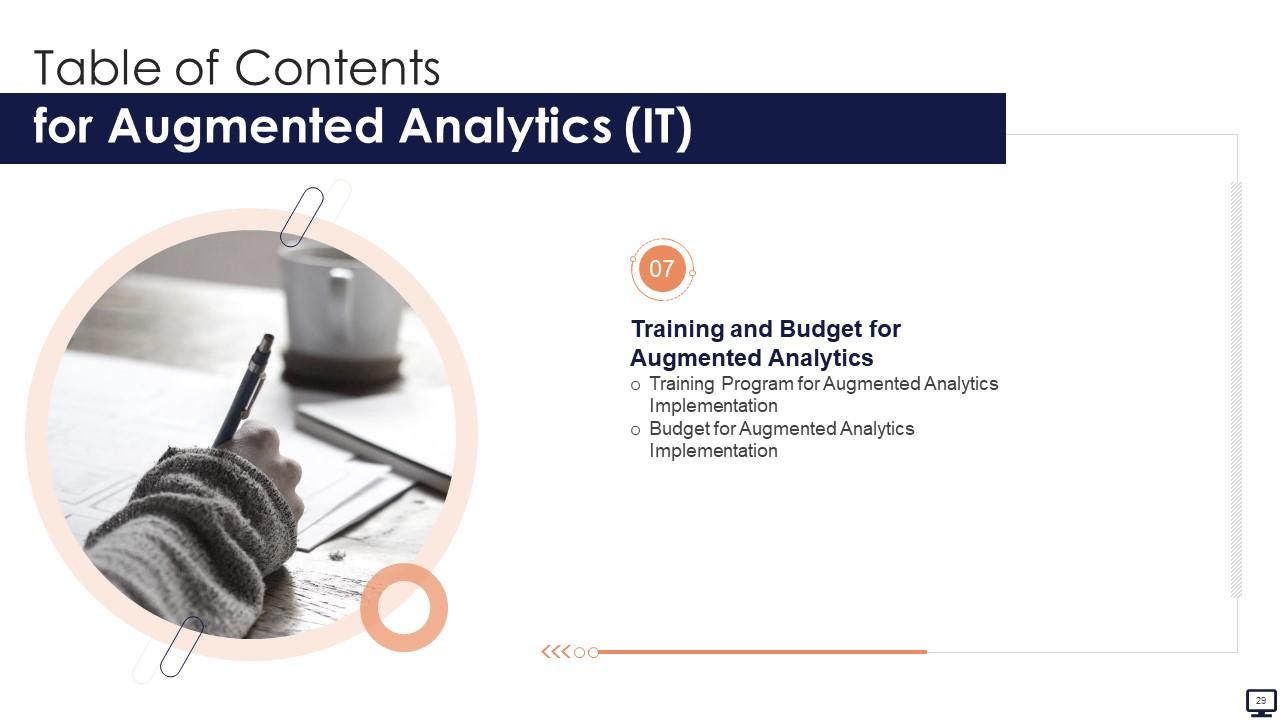
Slide 29: This slide highlights title for topics that are to be covered next in the template.
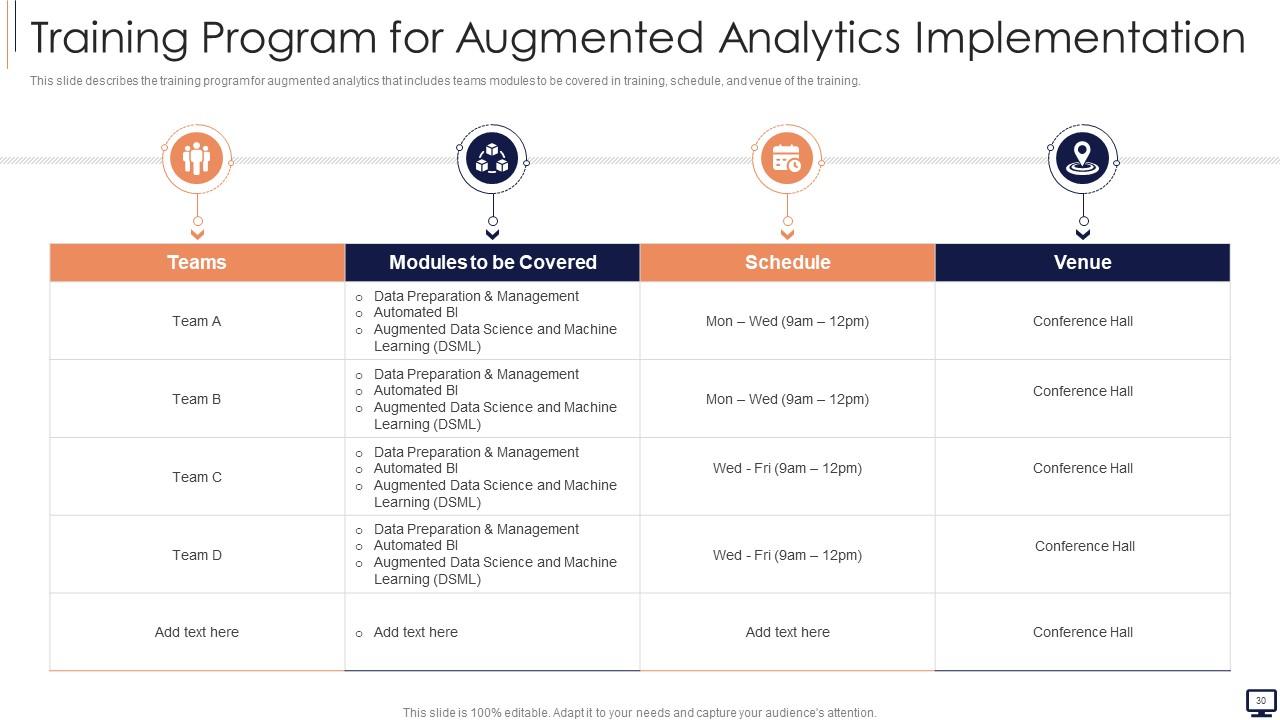
Slide 30: This slide represents Training Program for Augmented Analytics Implementation.
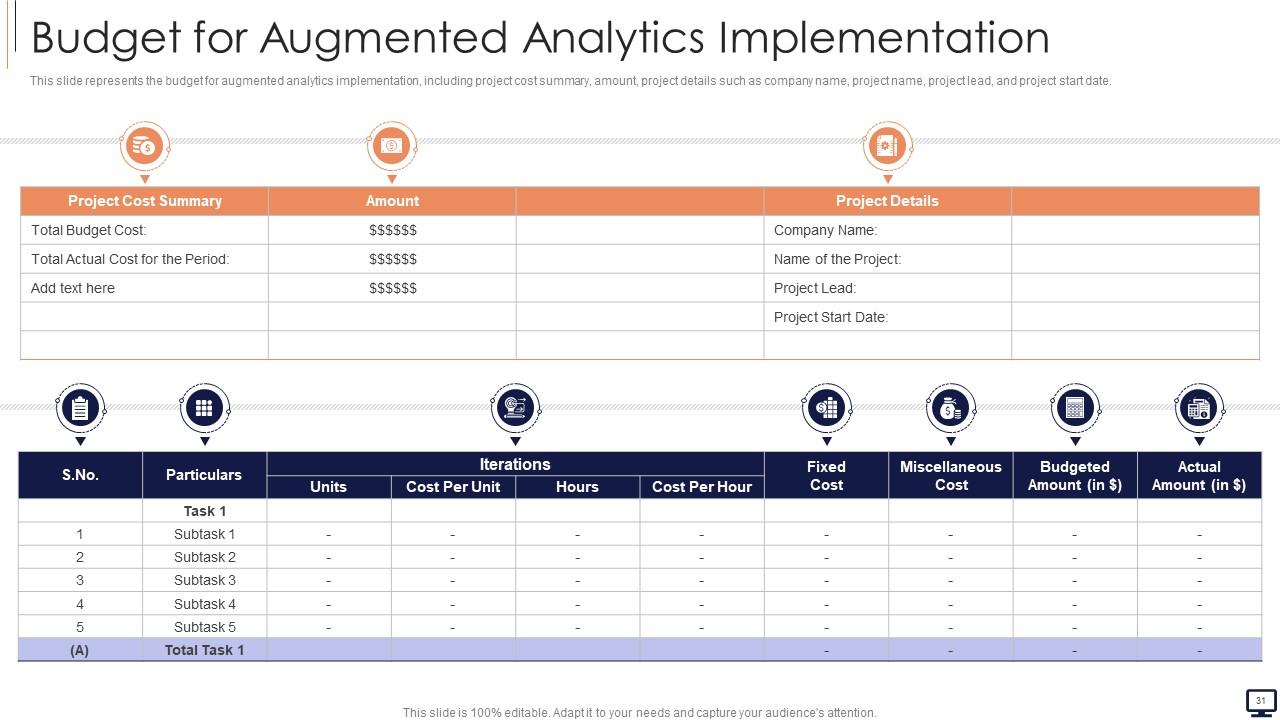
Slide 31: This slide showcases Budget for Augmented Analytics Implementation.
Slide 32: This slide highlights title for topics that are to be covered next in the template.
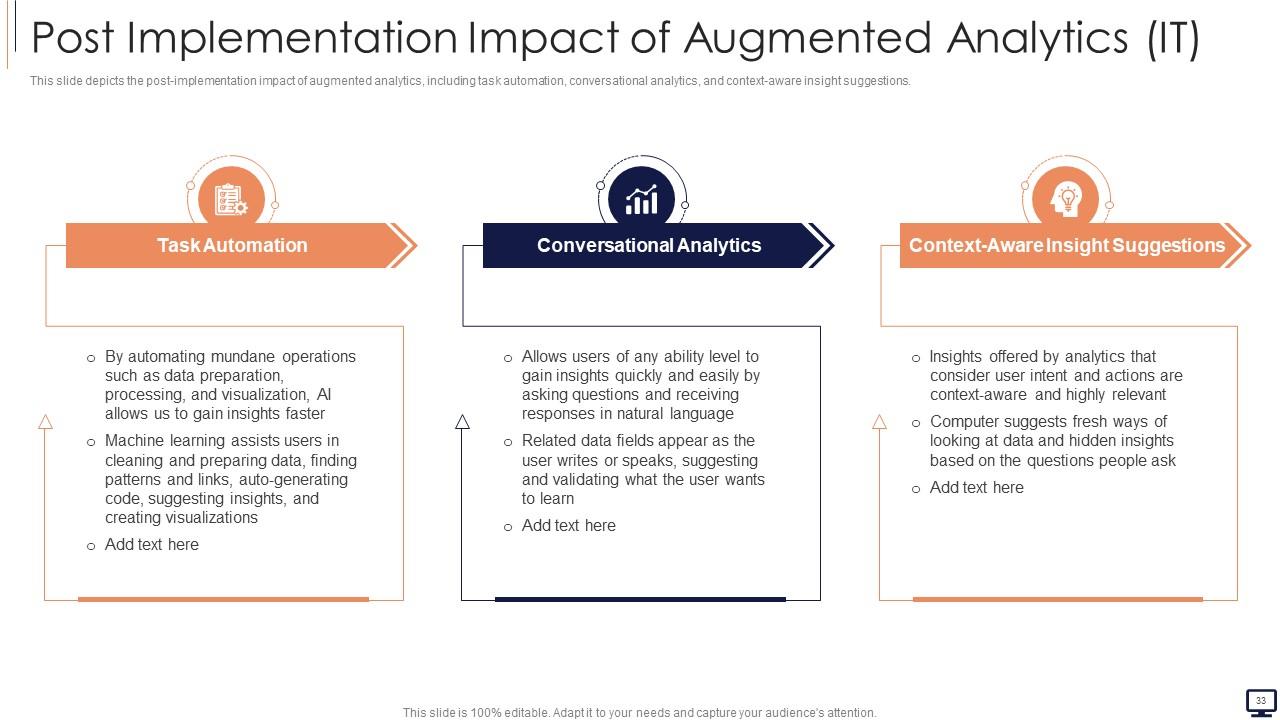
Slide 33: This slide shows Post Implementation Impact of Augmented Analytics.
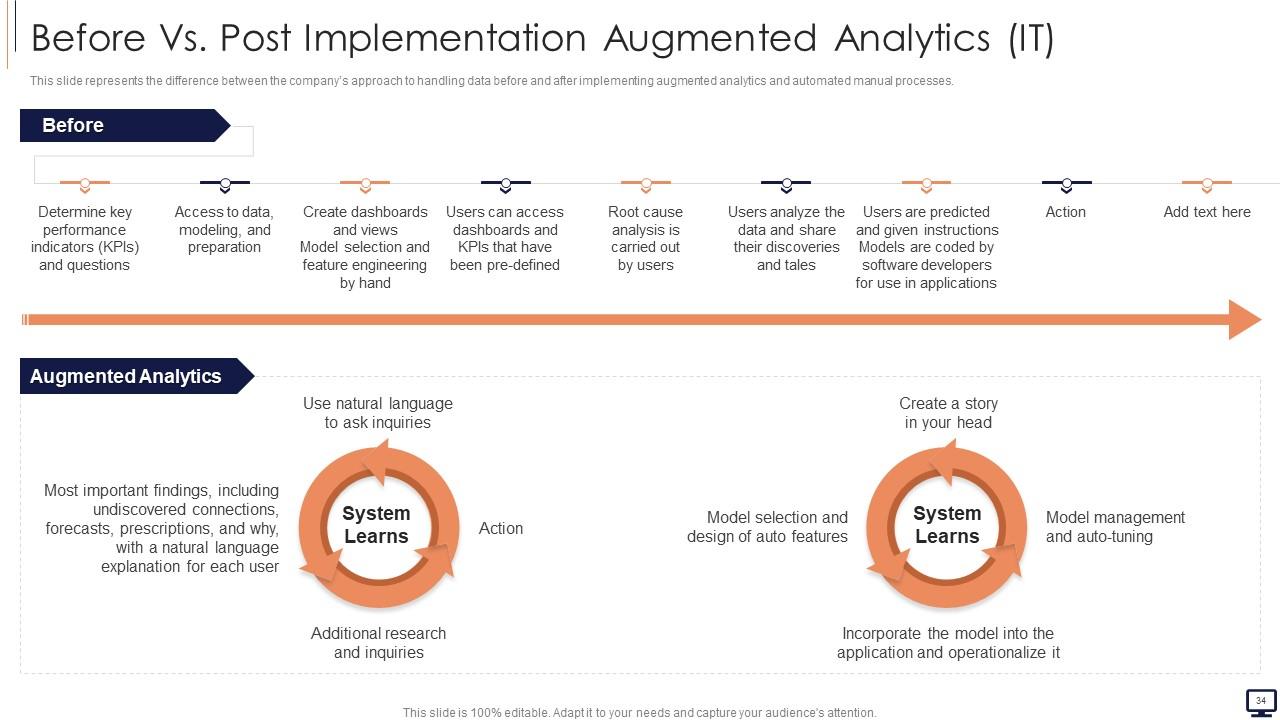
Slide 34: This slide represents the difference between the company’s approach to handling data.
Slide 35: This slide highlights title for topics that are to be covered next in the template.
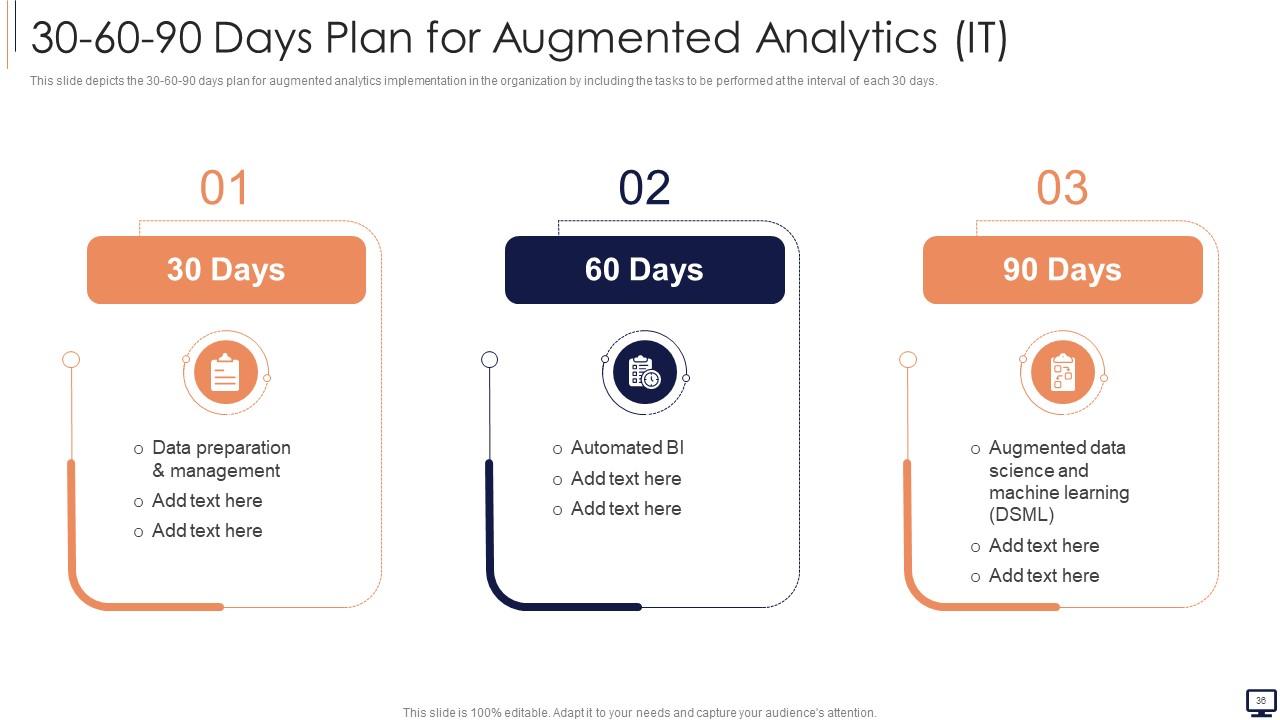
Slide 36: This slide shows 30-60-90 Days Plan for Augmented Analytics.
Slide 37: This slide highlights title for topics that are to be covered next in the template.
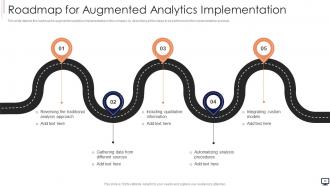
Slide 38: This slide presents Roadmap for Augmented Analytics Implementation.
Slide 39: This slide highlights title for topics that are to be covered next in the template.
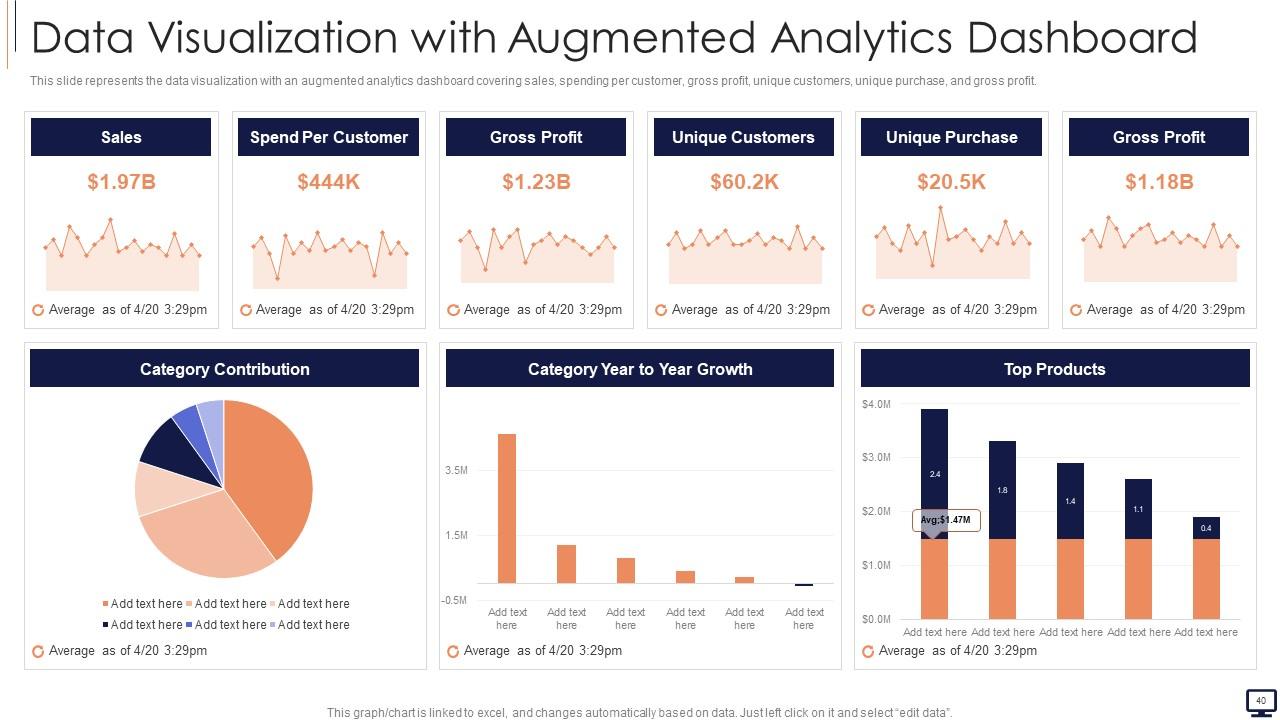
Slide 40: This slide displays Data Visualization with Augmented Analytics Dashboard.
Slide 41: This slide represents Icons for Augmented Analytics (IT).
Slide 42: This slide is titled as Additional Slides for moving forward.
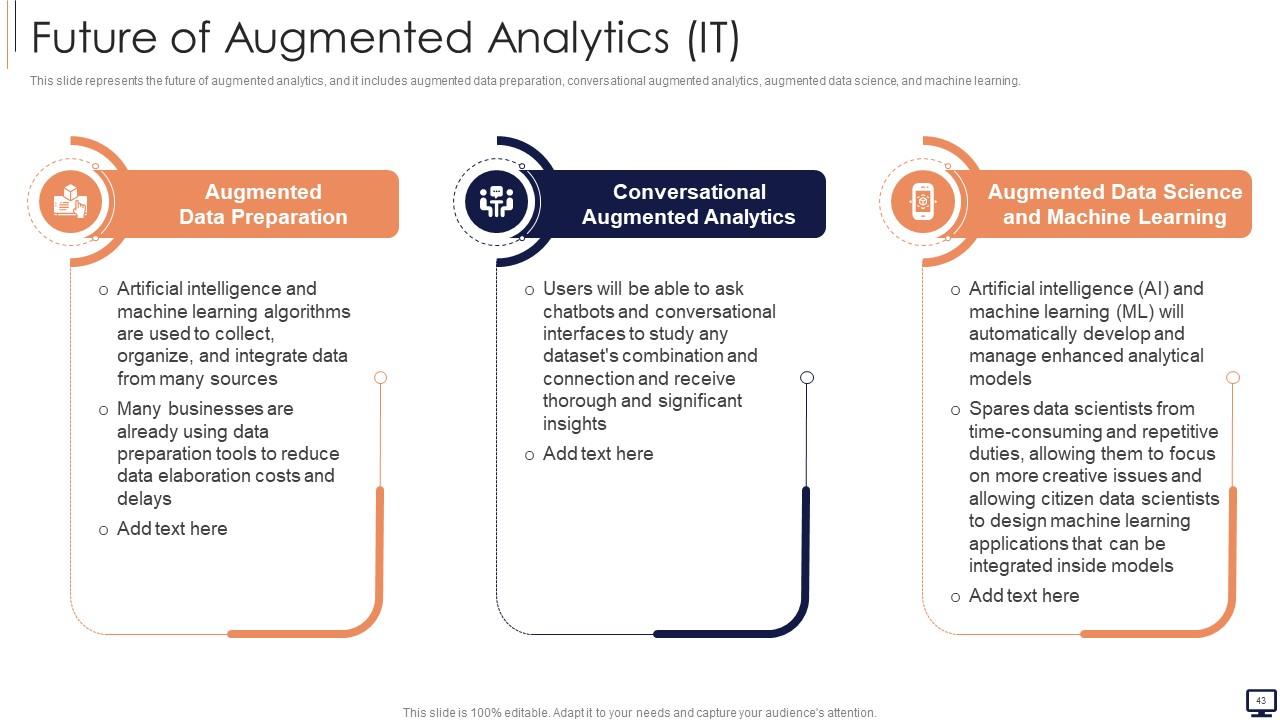
Slide 43: This slide represents the future of augmented analytics.
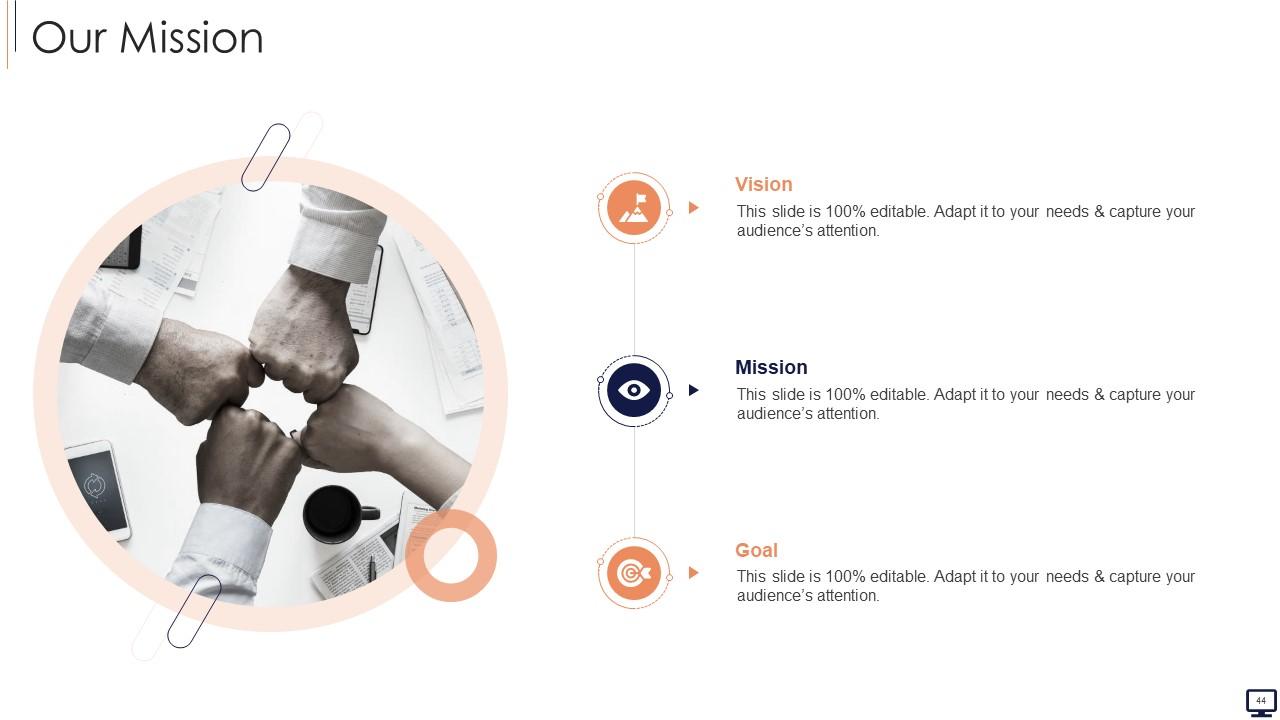
Slide 44: This is Our Mission slide with related imagery and text.
Slide 45: This slide shows Post It Notes. Post your important notes here.
Slide 46: This slide depicts Venn diagram with text boxes.
Slide 47: This is a Timeline slide. Show data related to time intervals here.
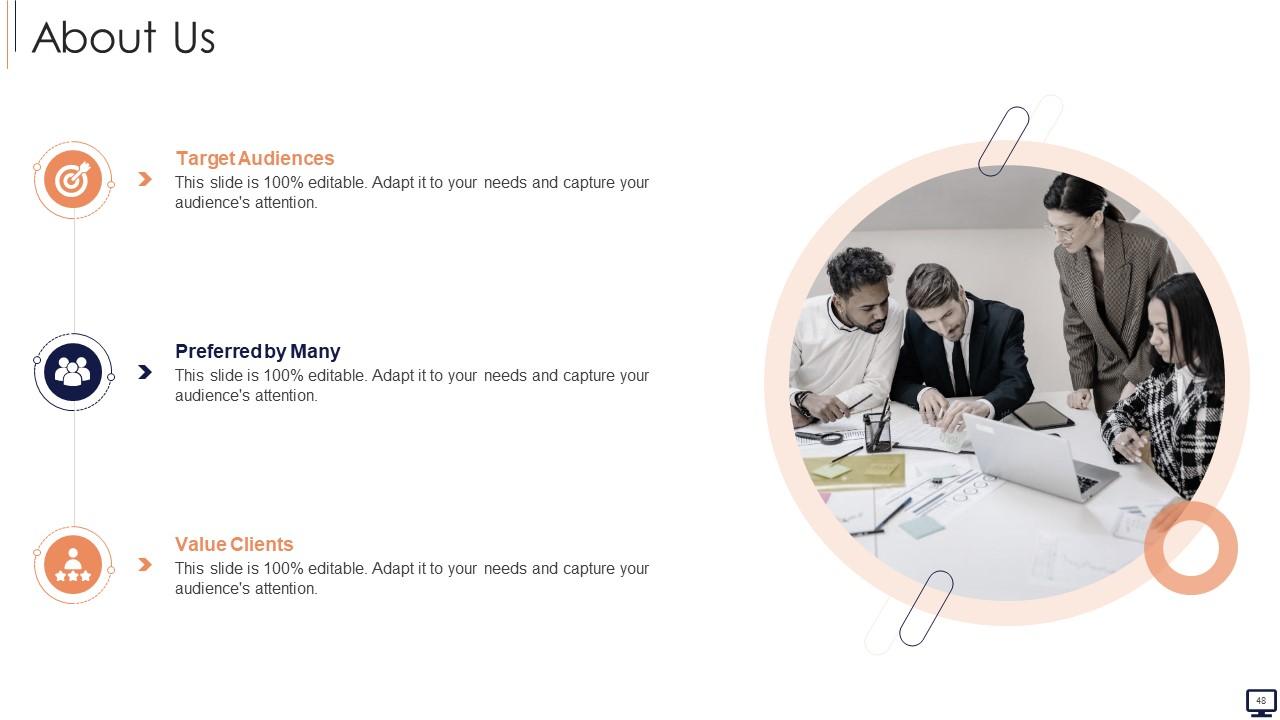
Slide 48: This is About Us slide to show company specifications etc.
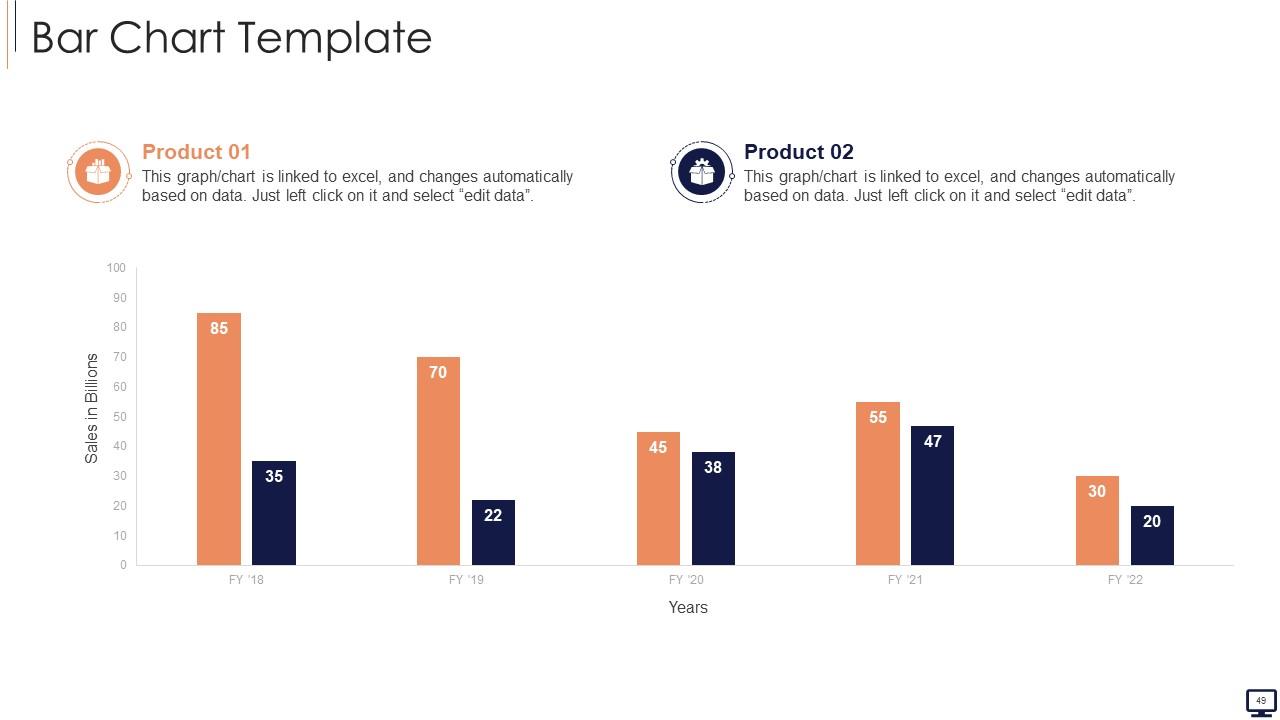
Slide 49: This slide presents Bar chart with two products comparison.
Slide 50: This slide displays Mind Map with related imagery.
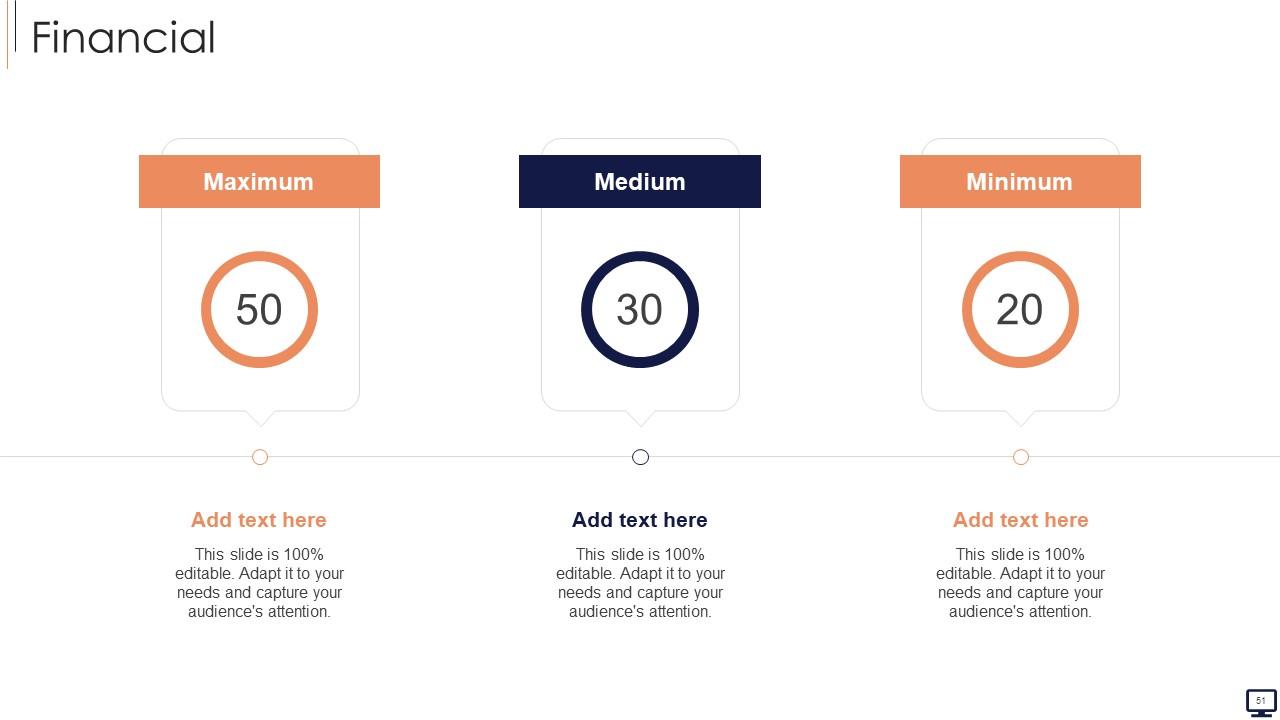
Slide 51: This is a Financial slide. Show your finance related stuff here.
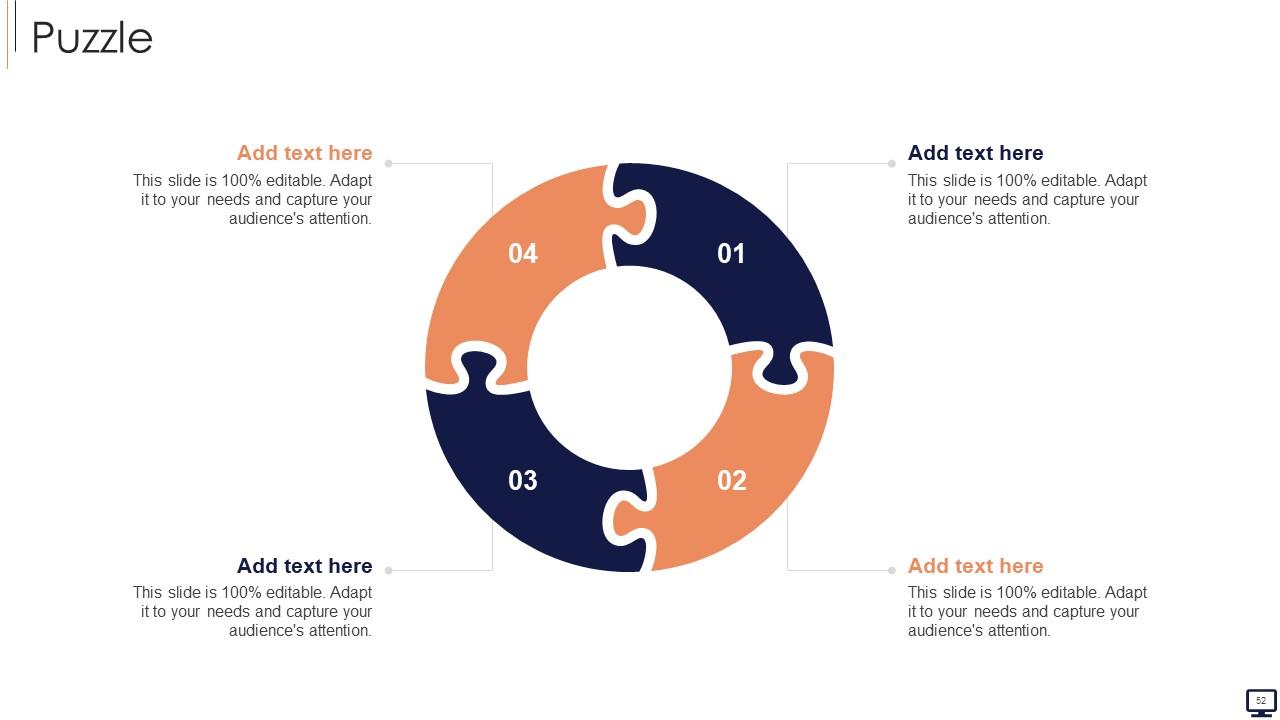
Slide 52: This slide contains Puzzle with related icons and text.
Slide 53: This is a Thank You slide with address, contact numbers and email address.
Augmented Analytics IT Powerpoint Presentation Slides with all 58 slides:
Use our Augmented Analytics IT Powerpoint Presentation Slides to effectively help you save your valuable time. They are readymade to fit into any presentation structure.
FAQs
The business purpose of augmented analytics is to help businesses make better decisions by using advanced algorithms and machine learning techniques to analyze and interpret large amounts of data.
The benefits of augmented analytics to business include increased efficiency, improved accuracy, better decision-making, reduced costs, and increased revenue.
Techniques used in augmented analytics include automatic data identification, statistical techniques, smart data preparation, natural language processing, and machine learning algorithms.
The role of machine learning in augmented analytics is to automate the process of analyzing large amounts of data, identify patterns and trends, and provide insights that can help businesses make better decisions.
Some best practices to overcome augmented analytics challenges include selecting the right tools and technologies, involving key stakeholders in the implementation process, establishing clear goals and objectives, providing proper training to users, and continuously monitoring and refining the process.
-
Easily Editable.
-
Wonderful ideas and visuals. I'm really pleased with the templates, which are unique and up to date.


