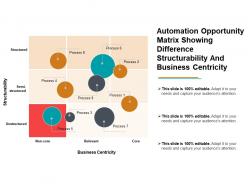
Automation opportunity matrix showing difference structuralist and business centricity
Your self-esteem is invaluable. Our Automation Opportunity Matrix Showing Difference Structuralist And Business Centricity pay their due respects.
- Google Slides is a new FREE Presentation software from Google.
- All our content is 100% compatible with Google Slides.
- Just download our designs, and upload them to Google Slides and they will work automatically.
- Amaze your audience with SlideTeam and Google Slides.
-
Want Changes to This PPT Slide? Check out our Presentation Design Services
- WideScreen Aspect ratio is becoming a very popular format. When you download this product, the downloaded ZIP will contain this product in both standard and widescreen format.
-

- Some older products that we have may only be in standard format, but they can easily be converted to widescreen.
- To do this, please open the SlideTeam product in Powerpoint, and go to
- Design ( On the top bar) -> Page Setup -> and select "On-screen Show (16:9)” in the drop down for "Slides Sized for".
- The slide or theme will change to widescreen, and all graphics will adjust automatically. You can similarly convert our content to any other desired screen aspect ratio.
Compatible With Google Slides

Get This In WideScreen
You must be logged in to download this presentation.
PowerPoint presentation slides
This is a three stage process. The stages in this process are Opportunity Matrix, Heat Maps, Ansoff Matrix.
People who downloaded this PowerPoint presentation also viewed the following :
Content of this Powerpoint Presentation
Description:
The image displays an "Automation Opportunity Matrix Showing Difference Structurability And Business Centricity." It is a two-dimensional graph with "Structurability" on the vertical axis, ranging from "Unstructured" to "Structured," and "Business Centricity" on the horizontal axis, ranging from "Non-core" to "Core." The graph uses different-sized and colored circles, labeled Process 1 to Process 9, to represent various processes within a business and their respective places on the graph based on how structured they are and their relevance to the core business.
The visual guide aims to identify which business processes are candidates for automation based on their structure and centrality to business operations. Those that are highly structured and core to the business are prime candidates for automation due to predictability and impact on core operations. The slide text also emphasizes that the content is "100% editable" to adapt to the needs and to capture the audience's attention, suggesting that the slide is intended to be a template for customization.
Use Cases:
This matrix can be useful in several industries to assess workflow automation opportunities:
1. Manufacturing:
Use: Strategizing process automation
Presenter: Operations Manager
Audience: Plant Managers and Production Staff
2. Banking:
Use: Optimizing backend operation efficiencies
Presenter: IT Project Leader
Audience: Bank Operations Team
3. Healthcare:
Use: Streamlining administrative and patient care processes
Presenter: Healthcare Administrator
Audience: Hospital Management and Staff
4. Retail:
Use: Automation of supply chain and inventory management
Presenter: Supply Chain Director
Audience: Inventory and Logistics Managers
5. Information Technology:
Use: Prioritizing IT process automation
Presenter: CIO or IT Manager
Audience: IT Department Staff
6. Telecommunications:
Use: Improving systems for service delivery and customer support
Presenter: Operations Director
Audience: Customer Service Managers and Technical Teams
7. Energy:
Use: Enhancing operational efficiency in energy distribution
Presenter: Chief Operations Officer
Audience: Operations and Field Service Managers
Automation opportunity matrix showing difference structuralist and business centricity with all 5 slides:
Hold events in memoriam with our Automation Opportunity Matrix Showing Difference Structuralist And Business Centricity. Give due credit to the departed.
No Reviews


