Bar graph showing company xyz gross profit sales analysis
Our Bar Graph Showing Company Xyz Gross Profit Sales Analysis are extremely compatible. They adjust to cultures across the globe.
Our Bar Graph Showing Company Xyz Gross Profit Sales Analysis are extremely compatible. They adjust to cultures across the ..
- Google Slides is a new FREE Presentation software from Google.
- All our content is 100% compatible with Google Slides.
- Just download our designs, and upload them to Google Slides and they will work automatically.
- Amaze your audience with SlideTeam and Google Slides.
-
Want Changes to This PPT Slide? Check out our Presentation Design Services
- WideScreen Aspect ratio is becoming a very popular format. When you download this product, the downloaded ZIP will contain this product in both standard and widescreen format.
-

- Some older products that we have may only be in standard format, but they can easily be converted to widescreen.
- To do this, please open the SlideTeam product in Powerpoint, and go to
- Design ( On the top bar) -> Page Setup -> and select "On-screen Show (16:9)” in the drop down for "Slides Sized for".
- The slide or theme will change to widescreen, and all graphics will adjust automatically. You can similarly convert our content to any other desired screen aspect ratio.
Compatible With Google Slides

Get This In WideScreen
You must be logged in to download this presentation.
PowerPoint presentation slides
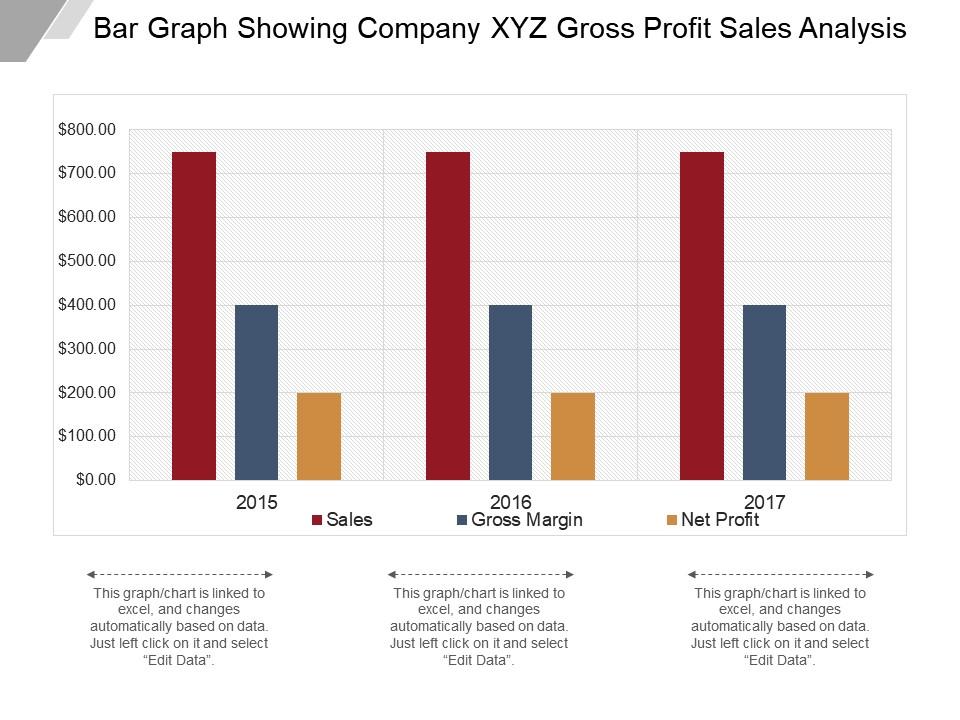
Presenting bar graph showing company xyz gross profit sales analysis. This is a bar graph showing company xyz gross profit sales analysis. This is a three stage process. The stages in this process are gross profit, gross benefit, gross margin.
People who downloaded this PowerPoint presentation also viewed the following :
Bar graph showing company xyz gross profit sales analysis with all 5 slides:
Gain a great deal with our Bar Graph Showing Company Xyz Gross Profit Sales Analysis. You will feel extremely enriched.
-
Much better than the original! Thanks for the quick turnaround.
-
The Designed Graphic are very professional and classic.


