Effective collaboration and efficient information sharing are vital for achieving collective success. Business reports are instrumental in this endeavor, as they serve as concise, clear, and goal-oriented sources of valuable information.
Business reports are crucial in communicating essential details and findings to stakeholders within and outside the organization. They encapsulate critical data, analysis, and recommendations, contributing to informed decision-making and propelling organizational progress. Whether financial performance, market research, project updates, or performance evaluations, business reports provide a structured format for presenting information that facilitates comprehension and fosters effective collaboration.
To increase the efficiency of operations and identify areas for improvement, use this link to download top-tier operational reports.
The right business report template offers these advantages:
- It provides a consistent structure that guides the flow of information, enabling you to present data and insights logically. This ensures readers can easily navigate the report, grasp the main points, and draw conclusions.
- A well-designed template saves time and effort by providing predefined sections and headings, eliminating the need to start from scratch for each report. It also helps standardize the format, ensuring that reports from individuals or departments maintain a cohesive appearance.
- Many report templates offer customization options, allowing you to tailor the design and sections to suit specific requirements. This flexibility ensures that the template can be adapted to business reports.
While writing a business report may not be overly complex, selecting an appropriate template can enhance its impact.
At SlideTeam, we have curated templates that empower you to create reports that exude professionalism and polish, capturing the attention of your superiors and surpassing their expectations.
With our 100% editable and customizable templates, you can streamline the report creation process, saving valuable time and effort while ensuring that your final document is impressive and meets the required guidelines and standards. Elevate the quality of your business reports and make a lasting impression with our premium templates.
The content-ready nature provides you a starting point and the structure you were looking for; the editability feature ensures you can tailor the presentation to audience profile.
Let's take a fascinating tour of these captivating templates, which will take your presentations to new heights.
Template 1: Business Report PowerPoint PPT Template Bundles
Use this structured report PPT Template to streamline effective communication of complex ideas and data. The template provides a framework where you can input relevant information, allowing you to focus more on the analysis and content of the report. With its capacity to accommodate extensive statistical information simultaneously, this versatile template is suitable for multiple department heads within the organization. It is ideal for presenting a comprehensive discussion on Excel-linked Key Performance Indicators (KPIs), allowing for countless updates and modifications.
Template 2: Business Reporting PowerPoint PPT Template Bundles
This business report slide covering income and spending section focuses on the company's income sources, expenditures, and expenses. It also facilitates a dashboard on company assets, enabling stakeholders to monitor and assess the value, performance, and use of company-owned and managed assets. It also assists you in breaking down into categories. Using this template, you can also provide insights into the company's cash generation, investments, and funding sources.
Template 3: Monthly Business Report PowerPoint PPT Template Bundles
Use this PowerPoint Template to analyze regular insights and data for business decisions. With it, you can monitor the progress of goals and objectives set for your department. By monitoring key metrics monthly, businesses can timely identify issues and opportunities. Early detection allows prompt intervention, problem-solving, and capitalization on emerging opportunities before these escalate and chances lose value. Grab this template now to get transparent and updated information on your company's financial performance, operational activities, and strategic initiatives.
Template 4: Monthly business report actual budget marketing performance goods manufactured
This slide allows you to monitor and analyze your business expenses monthly. You can plan and control your business finances with estimated and actual budget figures. Using this presentation template, you can allocate resources and make informed decisions based on your budget expectations. The centerpiece of the slide is marketing performance report PPT Template that allows you to aggregate data from multiple sources and obtain marketing information from a single point of access, eliminating manual work, and mitigating the risk of human error in your marketing reporting process. Grab it now.
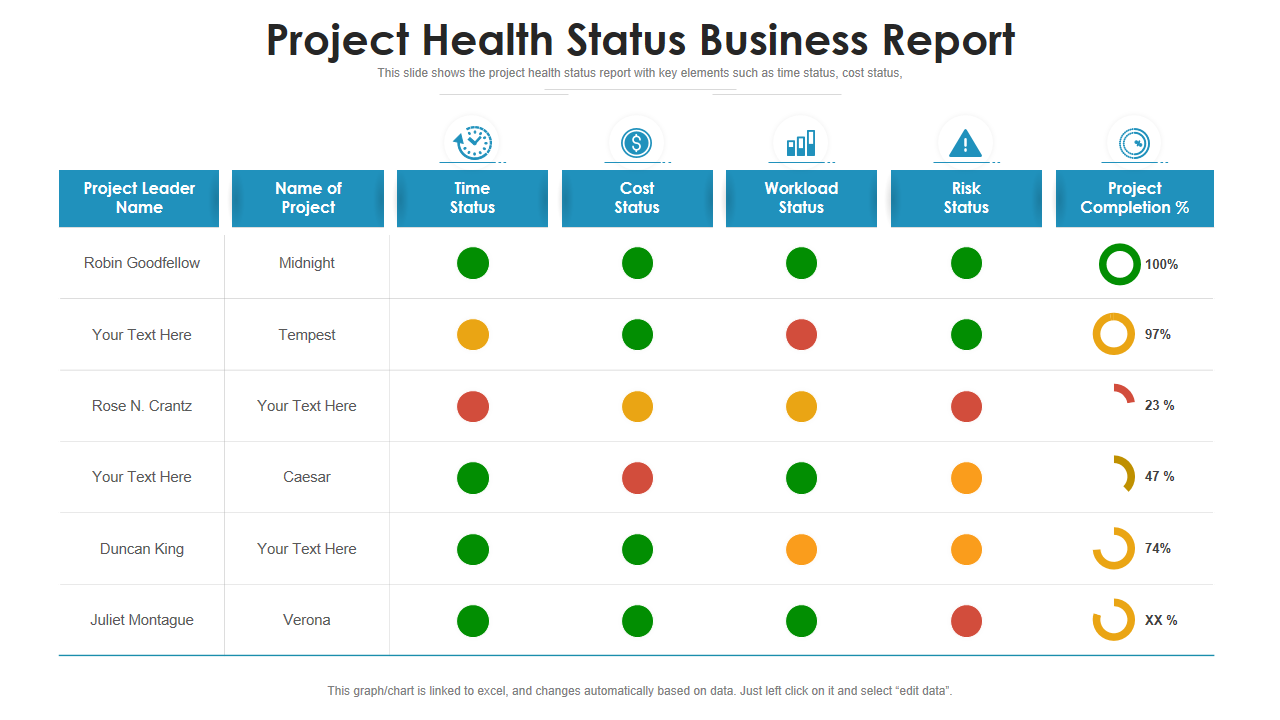
Template 5: Project Health Status Business Report
Use this PPT Template to provide stakeholders with a clear and concise overview of the project's current status. It helps maintain interest and involvement, allowing for effective collaboration and support throughout the project lifecycle. The report establishes accountability among project team members and stakeholders. It provides a clear snapshot of the project's health and progress.
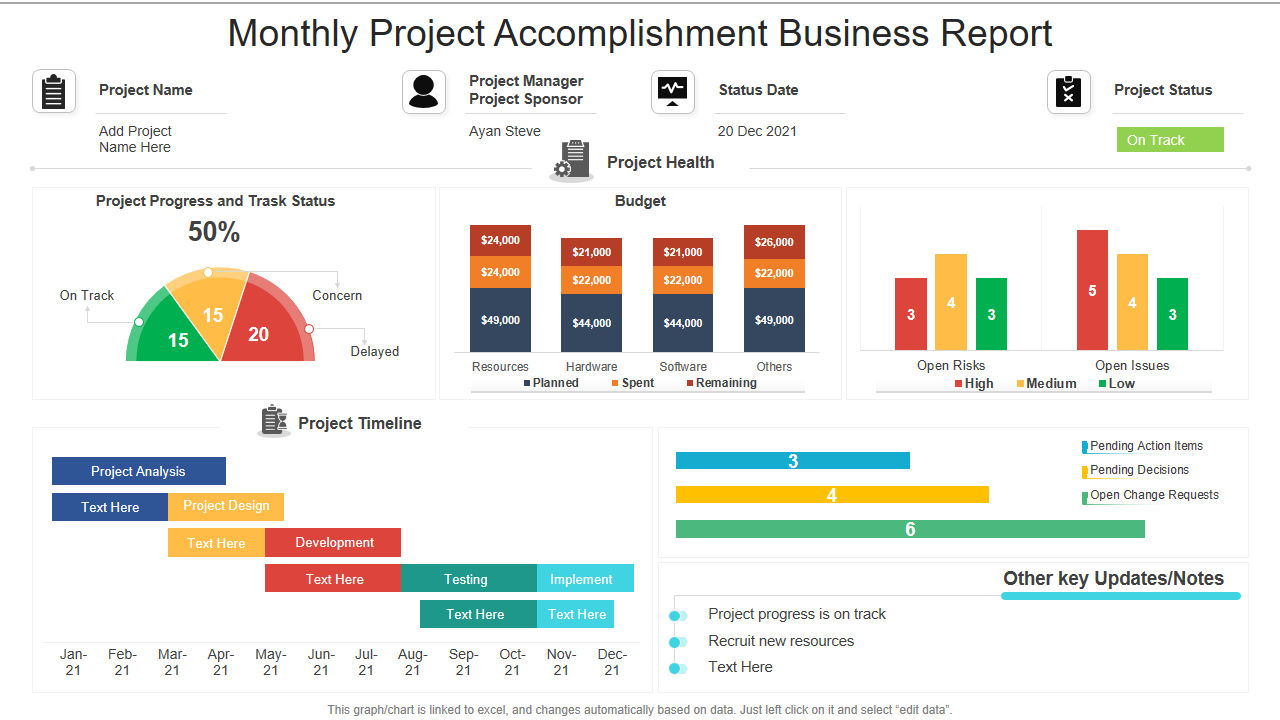
Template 6: Monthly Project Accomplishment Business Report
It provides an overview of tasks completed, milestones achieved, and project advancement. This tracking helps stakeholders understand the project's timeline and ensures it is on schedule. Using this presentation template, stakeholders can compare the current status with previous months or similar projects. It helps identify trends, patterns, and areas where the project can see improvement. This benchmarking facilitates continuous improvement in project management practices.
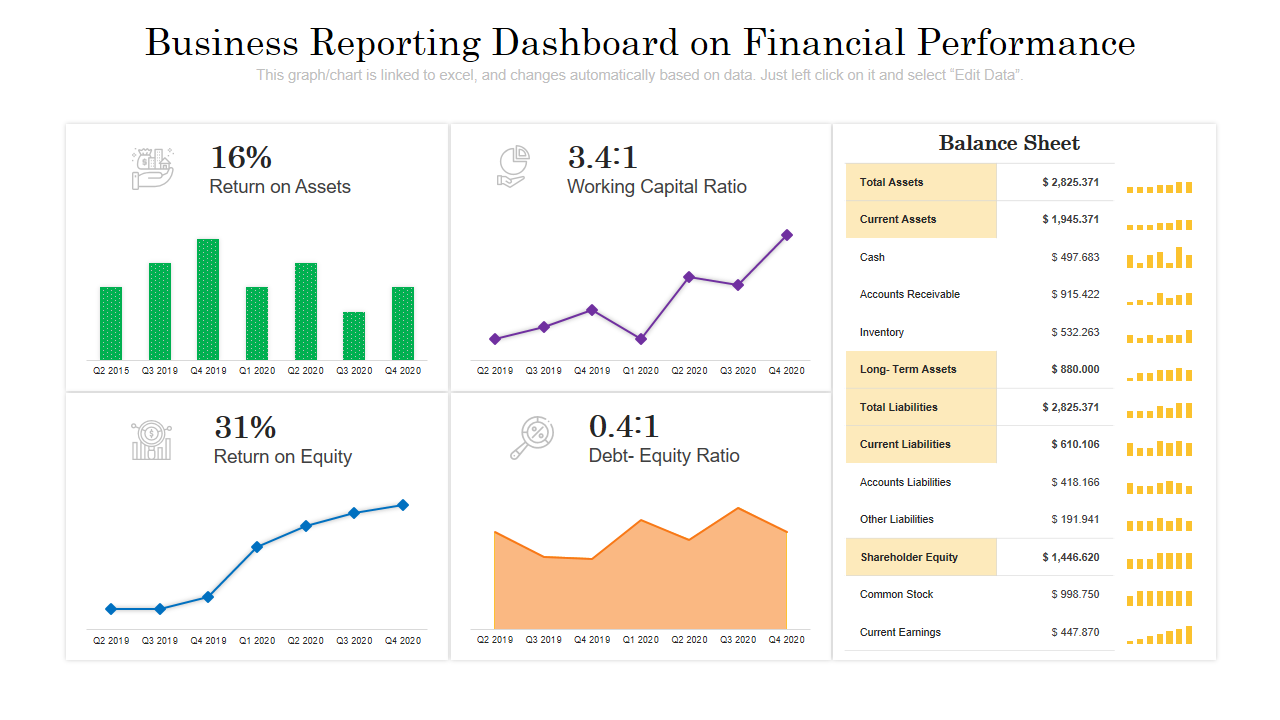
Template 7: Business Reporting Dashboard on Financial Performance
This PowerPoint Slide Template showcases an interactive visual representation of key financial metrics and indicators. It incorporates charts, graphs, and tables that enable stakeholders to grasp and interpret financial performance of businesses. Users can also drill down into specific metrics or categories for a more detailed analysis. This capability allows stakeholders to investigate underlying factors contributing to financial performance and identify areas that require attention.
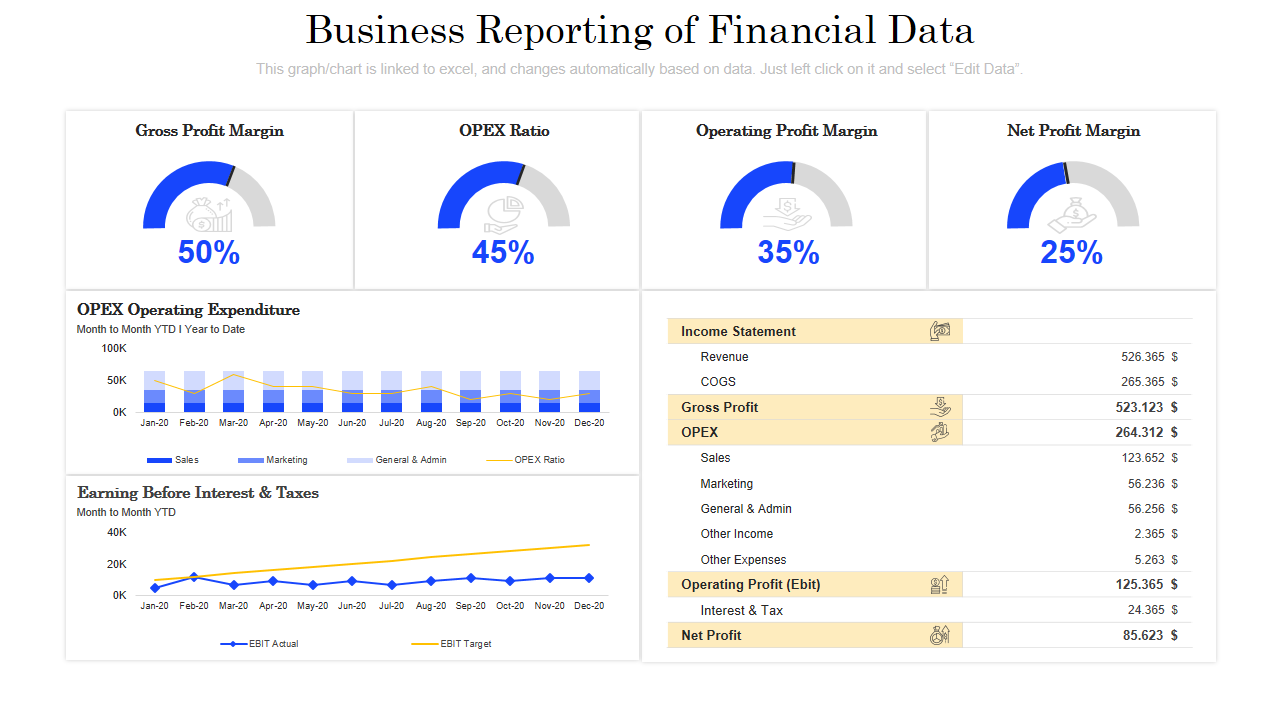
Template 8: Business Reporting of Financial Data
Use this PPT slide to present your stakeholder's insights into your business's financial performance. The data is sourced from sources such as accounting software, financial statements, invoices, receipts, and other relevant records. It allows you to Identify and select the most relevant financial metrics and KPIs that align with the business's goals and industry benchmark. You can track operating profit margin, net profit margin, earnings before interest and taxes, and so much more using this PPT Template.
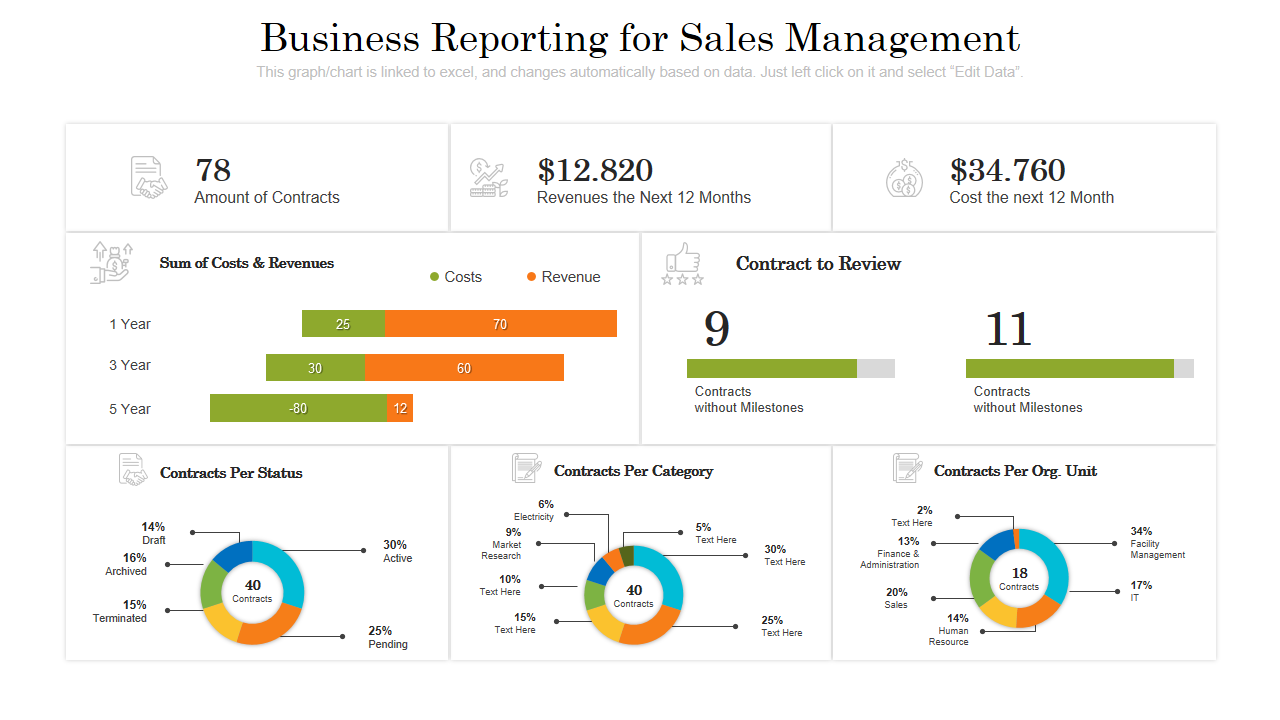
Template 9: Business Reporting for Sales Management
Use this PPT Template to evaluate your business sales performance across territories, regions, or teams. Compare individual sales rep performance, identify top performers, and uncover areas where additional training or support may be needed. Grab it now to establish a regular reporting style that suits the needs of sales management and stakeholders.
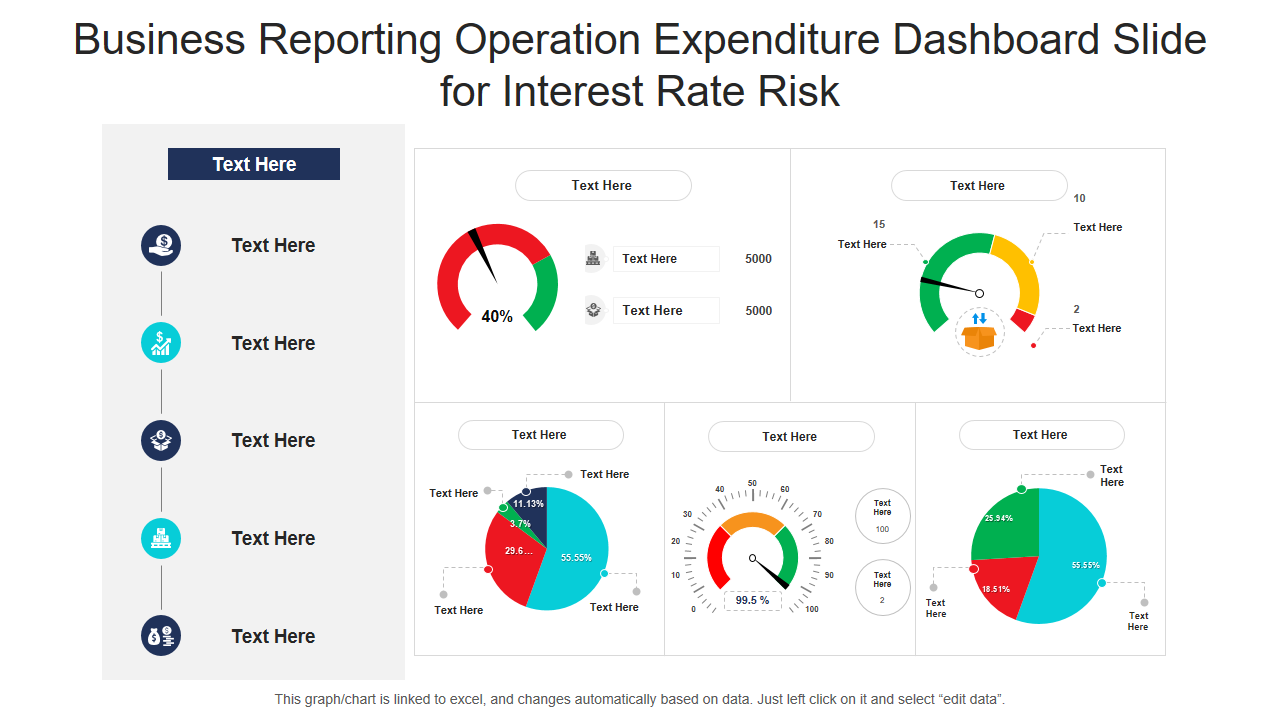
Template 10: Business Reporting Operation Expenditure Dashboard Slide for Interest Rate Risk PowerPoint Template
This PPT Template illustrates a business reporting dashboard for operational expenditure with visual representation of crucial expense metrics and indicators. It allows stakeholders to monitor and analyze operational costs clearly and concisely. Use this presentation template to provide stakeholders with real-time operational expense monitoring, facilitating informed decision-making. Using this template, you can also identify potential cost overruns or other areas where expenses can be optimized.
Say Goodbye to Boring Tables of Data and Generic Presentations
Don't let your business reports be forgotten or overlooked. Grab the opportunity to impress your stakeholders, gain their trust, and drive meaningful action. Elevate your business reporting game today and witness its lasting impact on your success. Our templates are here to empower you, so take the leap and experience the amazing difference they make to efficiency and task updation.
If you want reports that pack a punch on the good work you do, Download these professional report templates to shed more light on your way of working that adds value to clients, and all stakeholders.
PS We have a wide range of downloadable and ready-to-edit templates for you if you want to make a compelling annual business report.
FAQs on Effective Business Report
What is a business report and examples?
A business report is a comprehensive document that provides relevant information, analysis, and recommendations on a specific business topic. It follows a structured format for clarity and easy comprehension. The report aims to present factual data and insights from thorough research. Business reports come in many forms depending on their purpose, audience, and content.
Some examples are:
- Financial Reports: Provide a summary of a company's financial performance, including income and balance sheets and cash flow statements.
- Market Research Reports: Analyze market trends, customer preferences, and competition to provide insights and strategies for market entry or expansion.
- Annual Reports: Summarize an organization's activities, achievements, and financial performance over a specific period, providing stakeholders with an overview.
- Performance Reports: Evaluate individual, team, or organizational performance against predefined goals and identify areas for improvement.
- Project Reports: Document the progress, outcomes, and lessons learned from specific projects, including objectives, achievements, and recommendations.
- Sales Reports: Provide an overview of sales performance, revenue, customer trends, and product analysis to track targets and identify growth opportunities.
How to write a business report?
Crafting an effective business report involves these steps:
- Define the Purpose: Clearly articulate the report's intention, whether it's informational, analytical, or persuasive. Set specific objectives to guide your writing.
- Understand the Audience: Identify the intended readers and their knowledge levels, expectations, and information requirements. Customize the content and tone.
- Conduct Thorough Research: Collect reliable data and information from trustworthy sources such as market research, financial statements, surveys, interviews, and internal records.
- Structure the Report: Plan the report's organization before writing. It includes an introduction, main body, and conclusion.
- Craft an Engaging Introduction: Begin with a concise introduction that outlines the report's purpose, scope, and methodology.
- Present Findings: In the main body, present your findings, analysis, and insights. Organize the information into sections or subsections based on aspects or themes.
- Convincing Evidence: Strengthen your analysis and findings using data, facts, charts, graphs, and visual aids. Clearly label and explain any visuals.
- Draw Well-founded Conclusions and Recommendations: Summarize the key findings in conclusion and derive logical conclusions.
- Proofread and Edit: Review the report meticulously for clarity, coherence, grammar, and spelling errors.
- Format and Present Professionally: Apply a consistent layout, font, and style throughout the report.


![[Updated 2023] 10 Tips to Write an Effective Business Report [Templates Included]](https://www.slideteam.net/wp/wp-content/uploads/2020/10/size1001-436-18-1001x436.jpg)


 Customer Reviews





![10 Best Tips for Managing Your Calendar and Schedule Efficiently [Templates Included]](https://www.slideteam.net/wp/wp-content/uploads/2020/10/size1001-436-4-335x146.jpg)
![[Updated 2023] Top 10 Project Charter Templates For Efficient Project Management](https://www.slideteam.net/wp/wp-content/uploads/2020/09/size1001-436-21-335x146.jpg)


![[Updated 2023] Top 20 Crisis and Disaster Management PowerPoint Templates for Organizations to Sail Through!](https://www.slideteam.net/wp/wp-content/uploads/2020/07/size1001-436-35-335x146.jpg)
![[Updated 2023] Top 20 Balanced Scorecard Templates in PowerPoint PPT for Business Management](https://www.slideteam.net/wp/wp-content/uploads/2020/07/size1001-436-23-335x146.jpg)
![[Updated 2023] Top 20 Artificial Intelligence PowerPoint Templates and Google Slides For Technology Geeks](https://www.slideteam.net/wp/wp-content/uploads/2020/07/size1001-436-6-335x146.jpg)

![[Updated 2023] Top 10 Business Strategy Google Slides Templates To Empower Your Team](https://www.slideteam.net/wp/wp-content/uploads/2020/06/Banner-1-335x146.jpg)

![[Updated 2023] Top 25 Process Mapping PowerPoint Templates for Business Optimization](https://www.slideteam.net/wp/wp-content/uploads/2020/06/size1001-436-2-335x146.jpg)
![[Updated 2023] Top 25 Brainstorming PowerPoint Templates for Stimulating Out-of-the-box Thinking!](https://www.slideteam.net/wp/wp-content/uploads/2020/05/size1001-436-7-335x146.jpg)
![[Updated 2023] 30 Best Customer Service PowerPoint Templates For Success in Business](https://www.slideteam.net/wp/wp-content/uploads/2020/04/1013x441no-button-1013x441.jpg)
![[Updated 2023] Top 25 Cybersecurity PowerPoint Templates To Safeguard Technology](https://www.slideteam.net/wp/wp-content/uploads/2020/04/Banner-11-335x146.png)
![[Updated 2023] Top 25 Investment Presentation PowerPoint Templates for a Secured Future](https://www.slideteam.net/wp/wp-content/uploads/2020/04/Banner-17-335x146.png)

![[Updated 2023] 50 Best Company Presentation Templates To Ace The Corporate Ladder](https://www.slideteam.net/wp/wp-content/uploads/2020/03/Banner-16-335x146.png)


