Remember childhood days, when most of us hated mathematics like anything on this planet? The Pythagoras theorem, never-ending formulas of trigonometry, knot theory, and some other backbreaking algorithms. Oh! What a roller-coaster ride the mathematical equations and terms have given us! Even though attending the mathematics class was a real traumatic experience, we can’t ignore the most interesting yet important chapter- graphs. Yes, the x-axis and y-axis! Graphs are visually effective tools for displaying the relationship between numerous data points. They make complex problems much simpler and easy to understand.
From childhood to us being professionals, graphs have been of great help. In this fast-paced world, there’s not enough time for entrepreneurs to give an in-depth explanation of their financial situation or structure to the spectators. Remembering a bulk of monetary statuses and telling respective authorities about it is not at all easy. That is the reason why professionals take the help of presentations, which consists of in-built graphs and charts. To be more precise, entrepreneurs love to incorporate charts and graphs in their presentations as they are the easiest and the most flexible to showcase facts or figures. Undeniably, graphs bring out the clarity in every information that a presenter needs to convey to his audience. Therefore, using graphs in business presentations is effective. Also, there are multiple ways a graph can be used in a presentation. Here, in this blog, we will talk about 15 vivid portrayals of charts and graphs along with a few added tips. The ways are demonstrated via our professionally designed templates.
So, without any further ado, let’s see what our 15 interactive graph templates have to offer you!
15 Graph Templates To Download and Use
Template 1
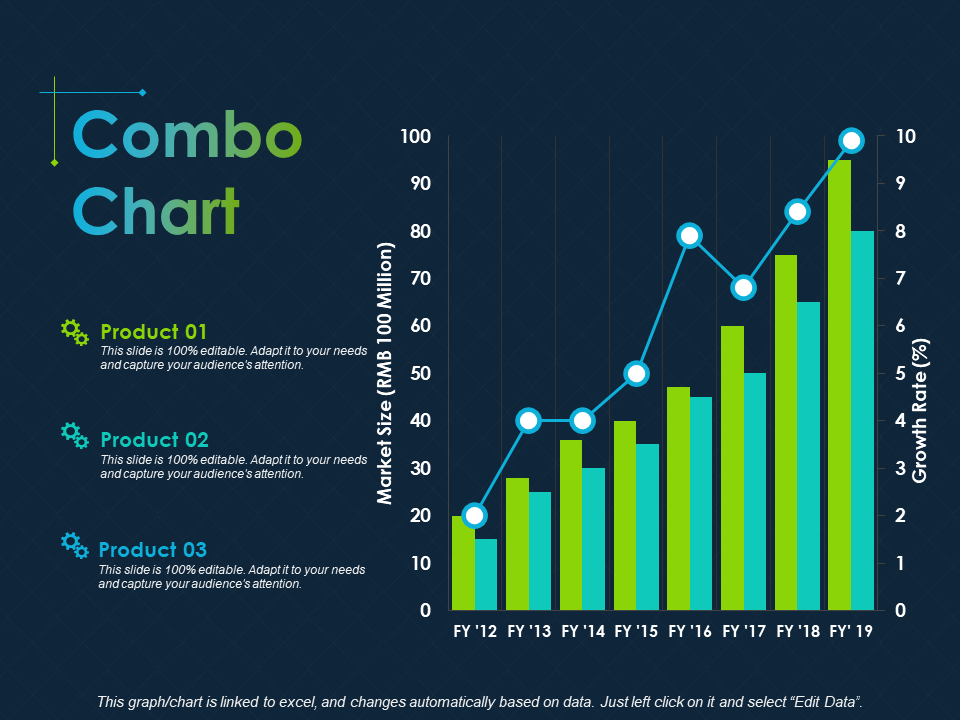
The template that has a dark color in the background is always a game-stealer. Just take a look at this attractive graph template with so many colors in it. The slide is pre-designed to tailor all your needs. You only have to edit the content. That’s it! Download this template in a single click and see how your viewers get attracted to your proposed information.
Download Combo Chart Growth Rate Finance PPT PowerPoint Presentation
Template 2
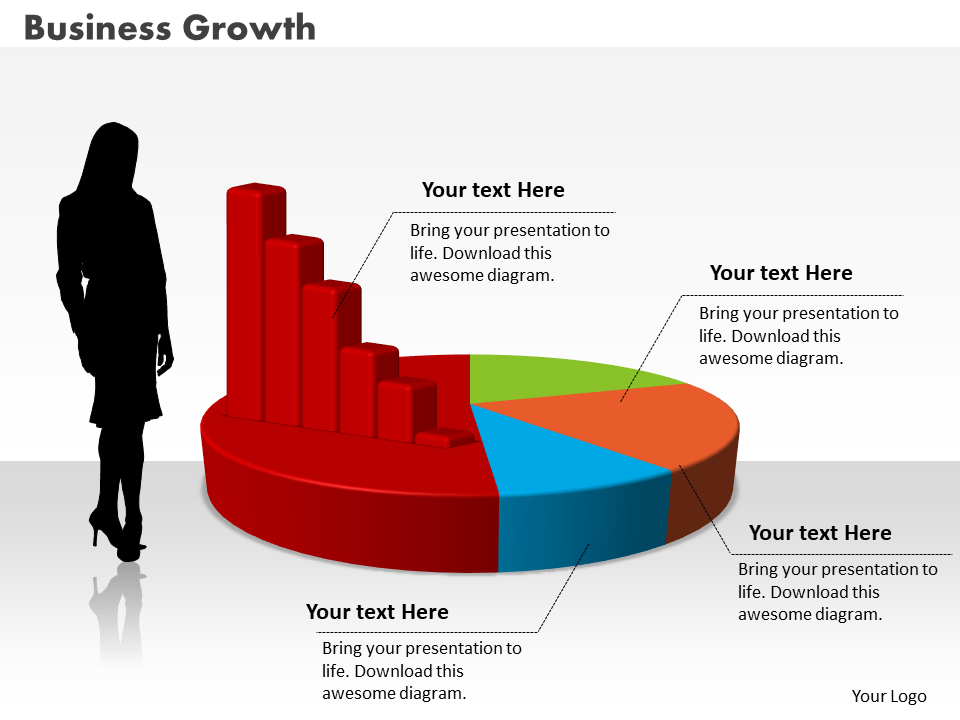
This template will fulfill all your business requirements. This engaging slide is a combination of both a pie chart and a graph. In this template, you can see the graph overlapping with a pie-chart which is the best option for you to display your financial summary. The color scheme that our experts have applied in this template is so appealing. Grab this slide and start filling in your information.
Download Business Women With Column Pie Chart PowerPoint Graph
Template 3
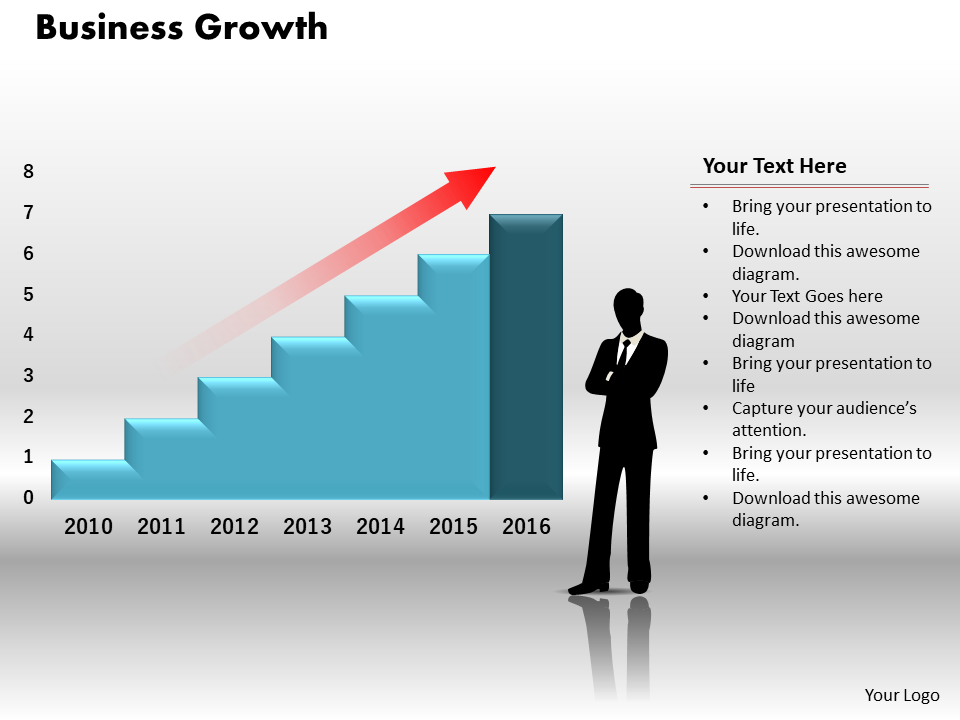
As you can see in the template given below, the colors used in the slide soothes the eyes, which is a plus point. Readers often get attracted to the presentation that has pleasing backgrounds and lucrative images. With the help of this graph template, you can show the growth of your business over the past years.
Download Business Person With Column Chart PowerPoint Graph
Template 4
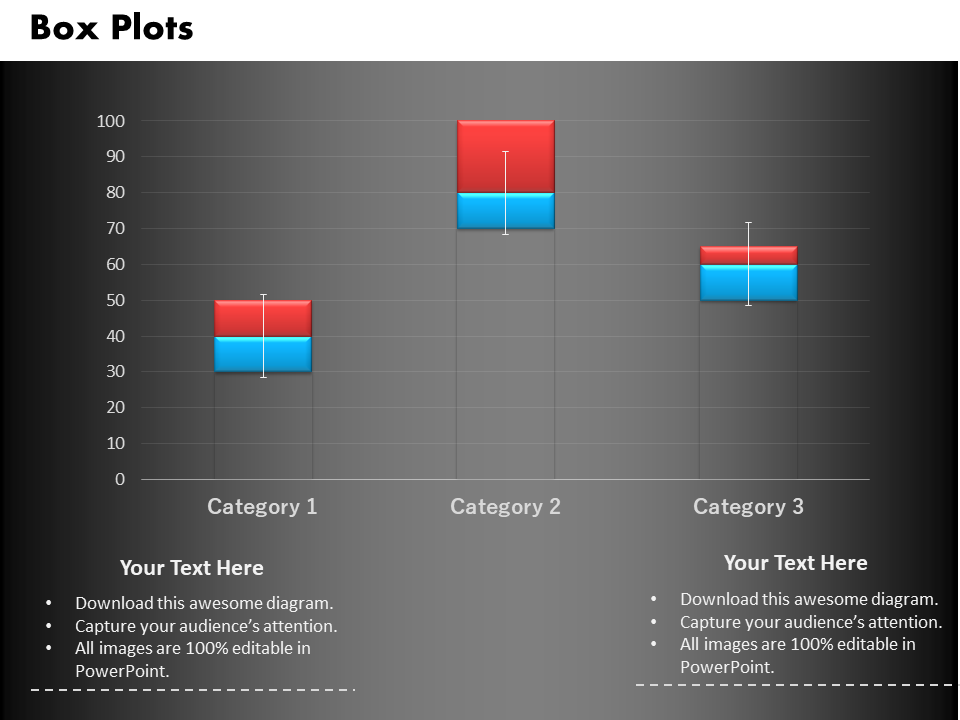
Take advantage of this eye-catching column chart or graph template that allows you to monitor your business statistics appropriately. This slide is attainable in excel sheets as well, which gives you the benefit of editing your data quickly. The cookie point you will receive after utilizing this template is that it comes up with ample space where you can place your companies’ logo for making the presentation more recognizable.
Download Box Plots Business Column Chart PowerPoint Graph
Template 5
This visually-attractive triangular chart or graph template helps you in jotting down your revenue status so far. The psychology of colors used in this slide is really aesthetic. You can add or delete the content as per your needs.
Download Triangular Chart For Data Driven Result Display PowerPoint Slides
Template 6
The slide shown below is so colorful that it holds your audience's attention at once. You can customize the template and highlight the data that you want to share with your audience.
Download Pie Chart With Line Graph Icon
Template 7
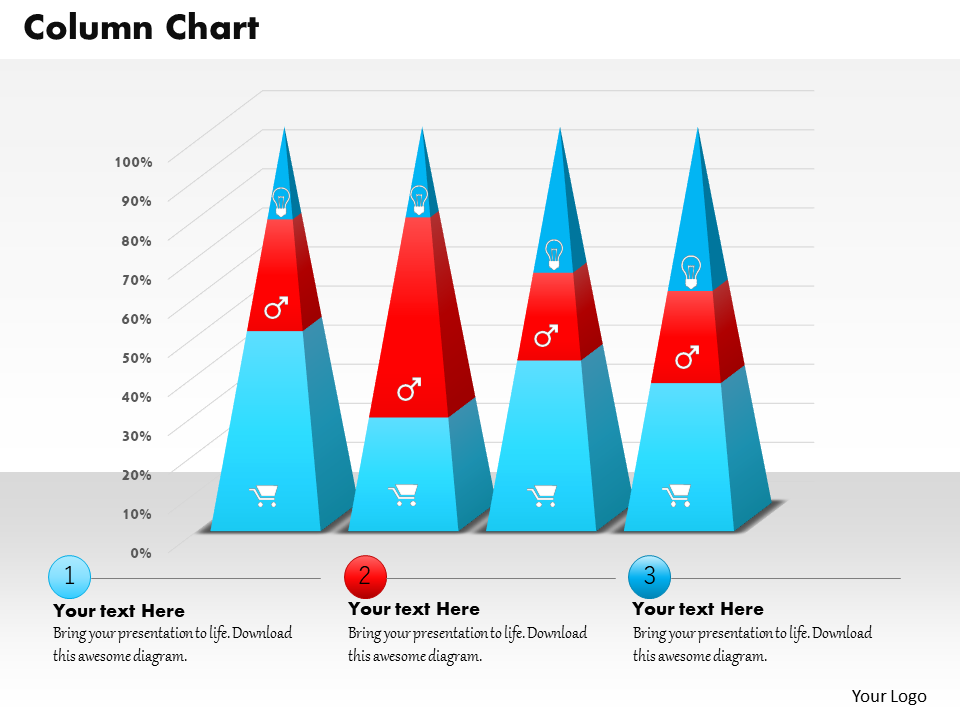
This triangular-shaped bar graph template will help you in displaying your data effectively. Also, the shape and colors this slide has will impress the viewers in one-go. The graph template allows you to segregate your data and present your information precisely.
Download Data Driven Triangular Bar Graph PowerPoint Slides
Template 8
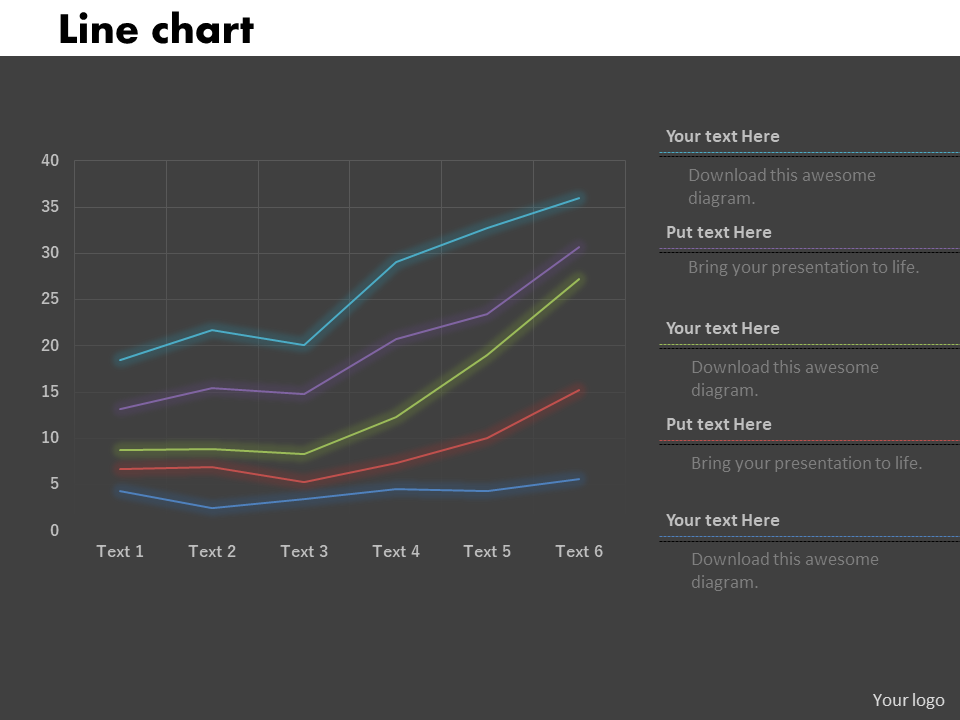
You already have an idea of how line charts work. Using this line chart template, you can easily compare the data values over specific time intervals. The color contrast will make the comparison of your quantitative data even more visible.
Download Line Chart For Data Analysis PowerPoint Graph
Template 9
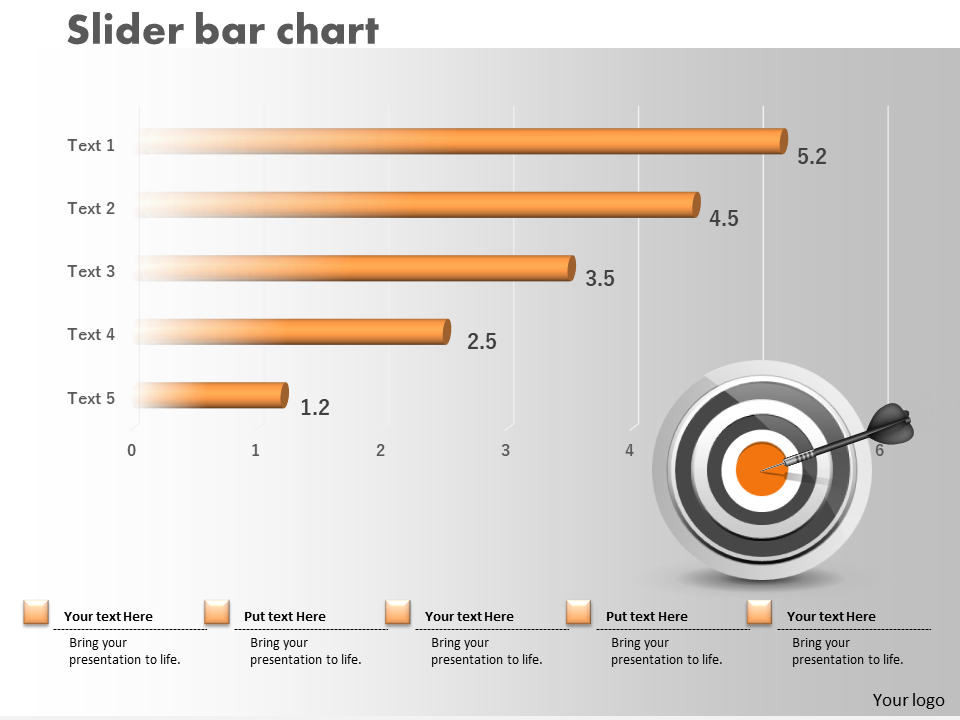
This graph template comes in soothing colors and hues that will make your data more interesting than ever. The slider bar chart template helps you in showcasing your data analytics proficiently. The slide consists of amazing fonts and styles that will add more creativity to your presentation.
Download Slider Bar Chart With Target PowerPoint Graph
Template 10
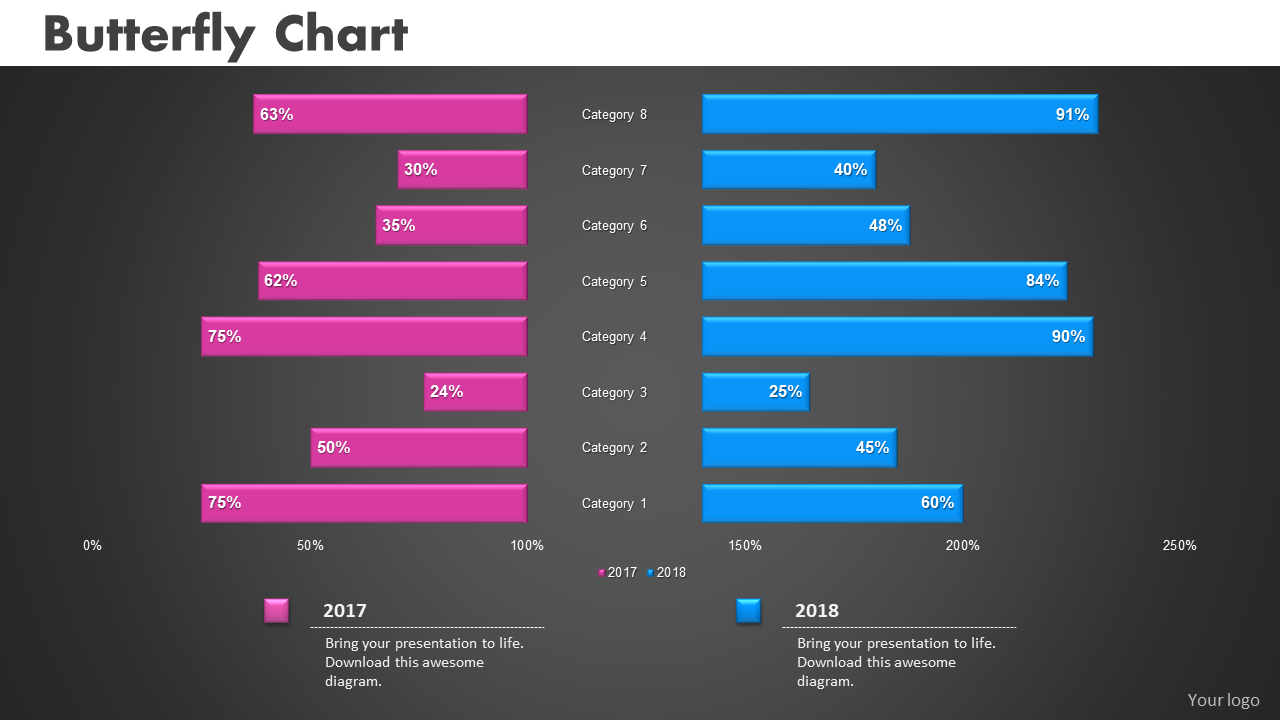
This beautifully designed butterfly graph template is here to categorize your different data. With this, you can monitor the changes occurring in each business category over the two consecutive years. And also, which section needs to be focused more. You can color the graph of yearly categories as per your choice.
Download Butterfly Bar Chart For Business Performance PowerPoint Graph
Template 11
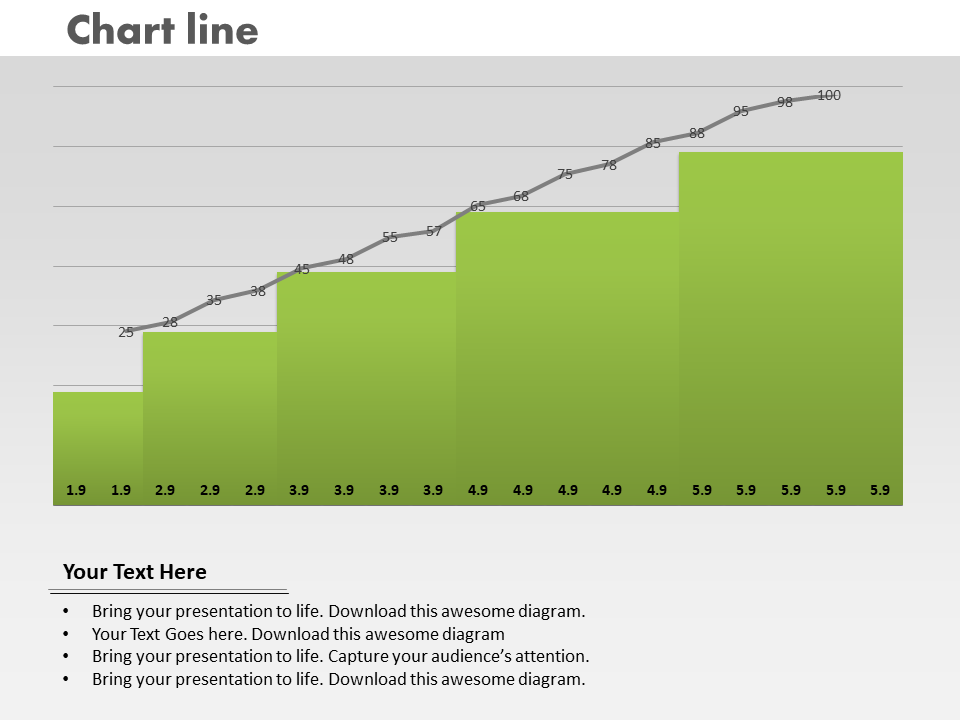
The green tone used in this bar graph template can win your audience’s attention effortlessly. You can put this template in your presentation, and without adding many effects, you are good to present the business dynamics before the viewers.
Download Column Chart With Growth Line PowerPoint Graph
Template 12
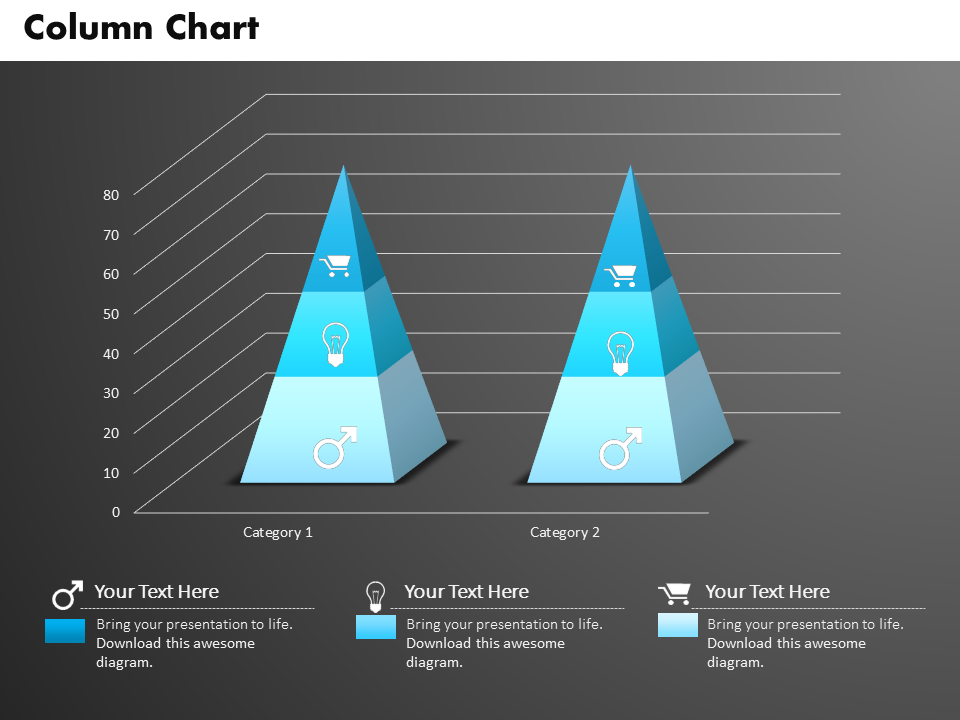
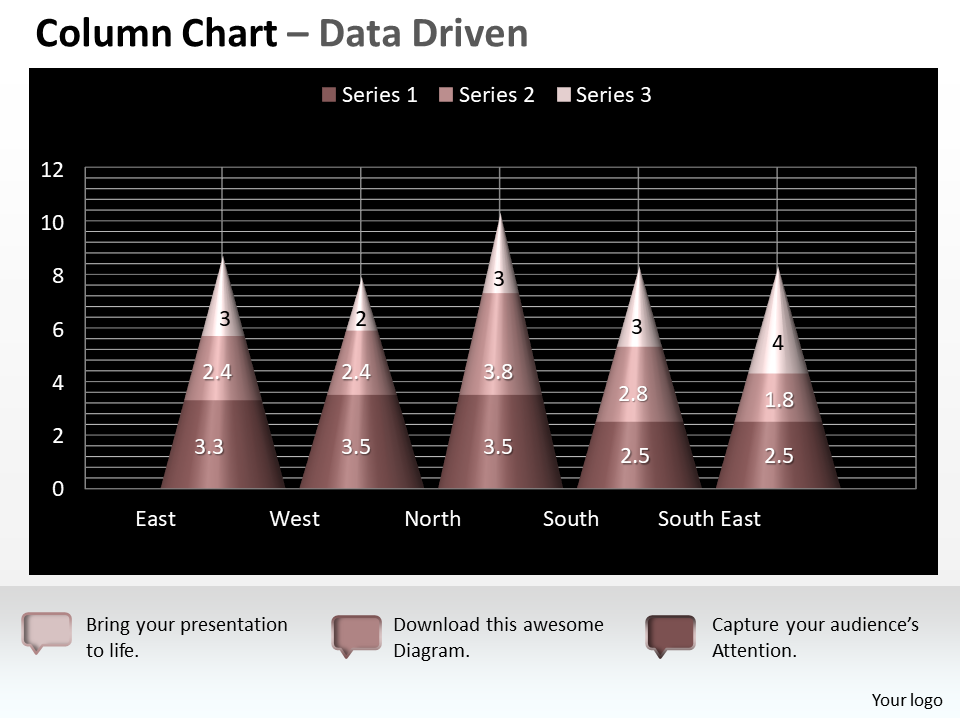
This pastel-colored conical graph with black color in the background makes your presentation a winner. You can easily seek your audiences’ attention by visualizing every bit of data systematically.
Download Data Driven 3D Chart Shows Interrelated Sets Of Data PowerPoint Slides
Template 13
This unique patterned graph will make your complex data look simpler. Our eye-catching graph template will make your presentation extra stylish yet professional. Grab this template to input your data effectively.
Download Unique Pattern Sales Data Driven Chart PowerPoint Slides
Template 14
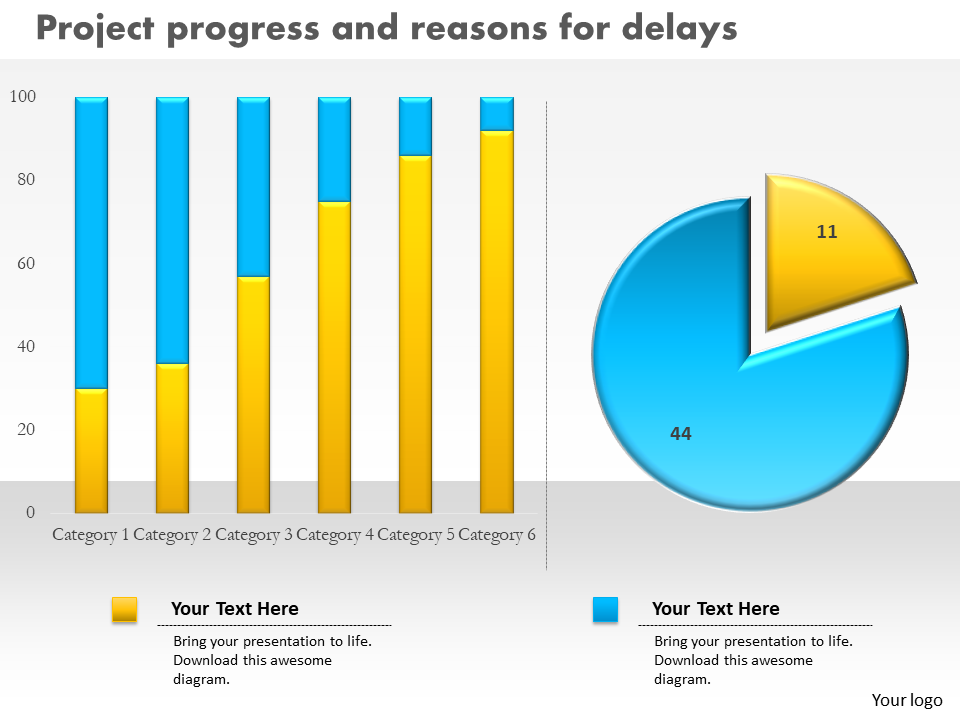
This amazing template that contains bar graphs and pie-chart will enable you to display your business matrix in a simpler form. The graphics present in this template do not pixelate and thus, aids you in creating the best presentation of your life.
Download Project Progress With Column And Pie Chart PowerPoint Graph
Template 15
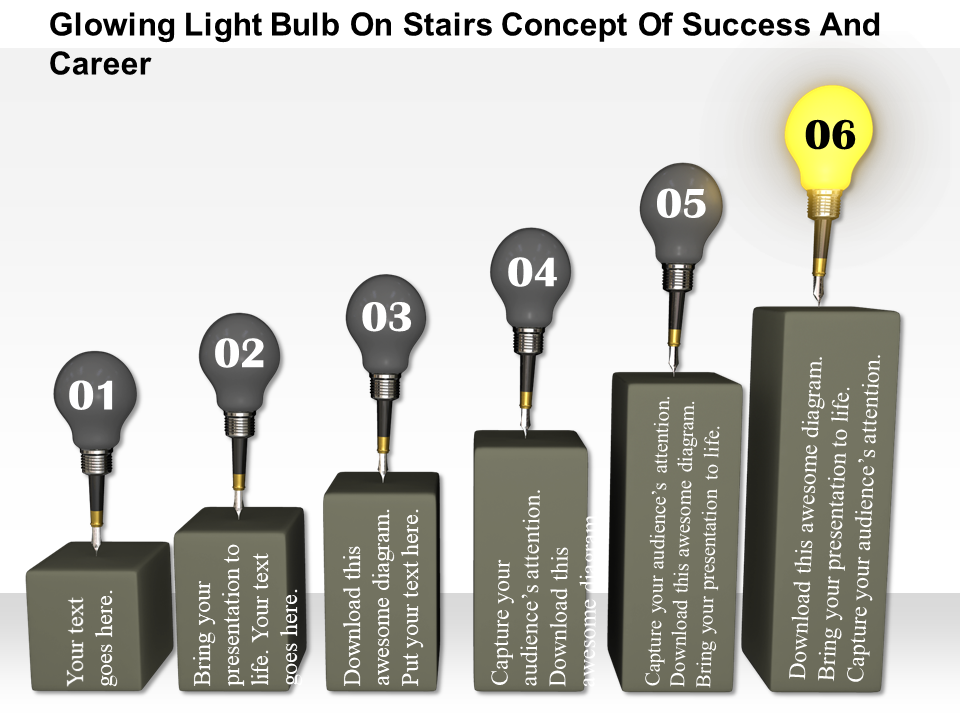
The image shown in the template below visualizes the bar graphs along with the bulbs on top. Here, you can see the bulbs are of the same color except for the one. The highlighted bulb depicts leadership qualities. You can use this template in your presentation to portray the leadership and reputation your company has achieved over the years.
Download Light Bulb On Bar Graph With Leader On Top
The blog is not over yet! Along with the graph templates, here are some cookie points for you that will make your presentation game stronger. Learn more about how to add creativity in your graphs with the help of a few key-pointers explained below!
- Start from selecting a graph design
Firstly, segregate your data. When you create a presentation, go to the insert option and choose a graph according to your needs. The charts or graphs are of different types. Some of them are pie-chart, histogram, bar graph, waterfall, combo graph. So, select from any of these (or others) and put it on a presentation.
- Format the data
You can easily edit your proposed data and update it, later it can automatically be shown in your chart as well. Keep the data or facts intact. Do not clutter everything on a graph.
- Fill in some vibrant colors
To compare the data, make sure each section has different yet soothing colors in it. It will help the audience to understand the information better, and also you will be able to share your message across conveniently.
- Animation is the key
Instead of showing graph-sections all at once, use the animation option that highlights each section after a pause. This way will grab viewers' attention instantly. Also, animated effects will emphasize the information you want to convey to the spectators.
- Drawing tools are must
By using drawing tools and different shapes & arrows, you can emphasize the particular graph-section which you think needs to be focused.
Make a smart move in your business, create an interactive presentation, show your data & analytics through our graph templates to impress the viewers instantly. And yes, do not miss out on reading the ways explained in the blog which will definitely help in making your presentation stand out!


![15 Interesting Ways to Use Graphs in a Presentation [Templates Included]](https://www.slideteam.net/wp/wp-content/uploads/2020/10/size1001-436-10-1001x436.jpg)


 Customer Reviews



![[Updated 2023] 30 Best Gantt Chart PowerPoint Templates For an Effective Visualization of Your Project](https://www.slideteam.net/wp/wp-content/uploads/2020/05/Banner-1-335x146.png)

![[Updated 2023] 25 Ways to Show Statistics in a Presentation [PowerPoint Templates Included]](https://www.slideteam.net/wp/wp-content/uploads/2020/09/size1001-436-9-335x146.jpg)


