Sales Reporting is a necessary exercise for every sales team that needs to take stock of its sales performance and decide how they can become better at their job of selling. Hitting the targets is no easy task but when sales processes are understood clearly by all team members, there is no confusion about product offerings, realistic KPIs are set and new sales strategies are decided mutually, the work of the sales reps and that of the sales manager becomes so much easier.
A Sales Report is a summary of the sale team’s performance over the last quarter, month or week. It’s not just the total sales achieved that will help you set direction for the next quarter. You need to know which countries or regions attracted the most revenue? Has there been any change? Which sales reps performed the best and which took a beating for the worst? How is the sales funnel looking and how can it be optimized further to turn more leads into customers? What is the roadmap for the next quarter?
A Sales Report Presentation is, therefore, an exhaustive and in-depth look at different sales key performance indicators (KPIs) and mapping them out visually to see the trends and fluctuations. Investing in CRM softwares can be darn expensive but that doesn’t mean you won’t have to track and analyse. That is why, we have compiled sales report templates and sales review diagrams so that you can download them, edit them by entering your own data and present a powerful sales report before the management or the internal sales team.
Sales Report Templates for PowerPoint You Must Include in Your Sales Review Meeting:
#1- Executive Summary / Financial Highlights
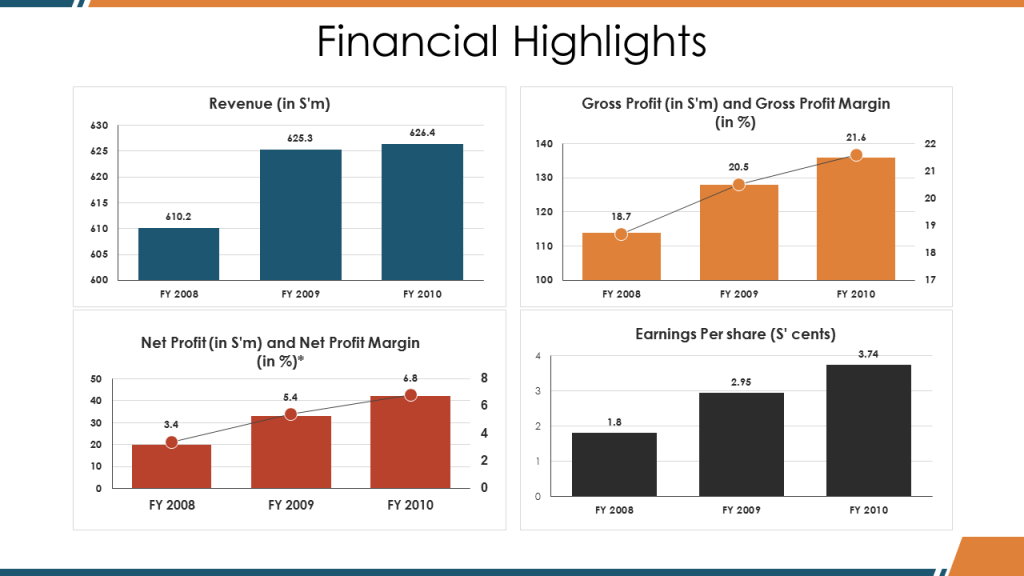
The CEOs and other executives often don’t have time to go in details and wait for all 20+ slides to get over before they get a complete picture of sales performance and decide the next course of action. They want a complete snapshot right in the beginning of the presentation. So a Sales Report presentation has to start with this slide that sums up the main metrics that the management would be interested in. You would be, however, creating this slide in the end as you would be able to highlight the crux of the presentation in one slide better by then.
Download Executive Summary Template (Slide 5 of Complete Deck)
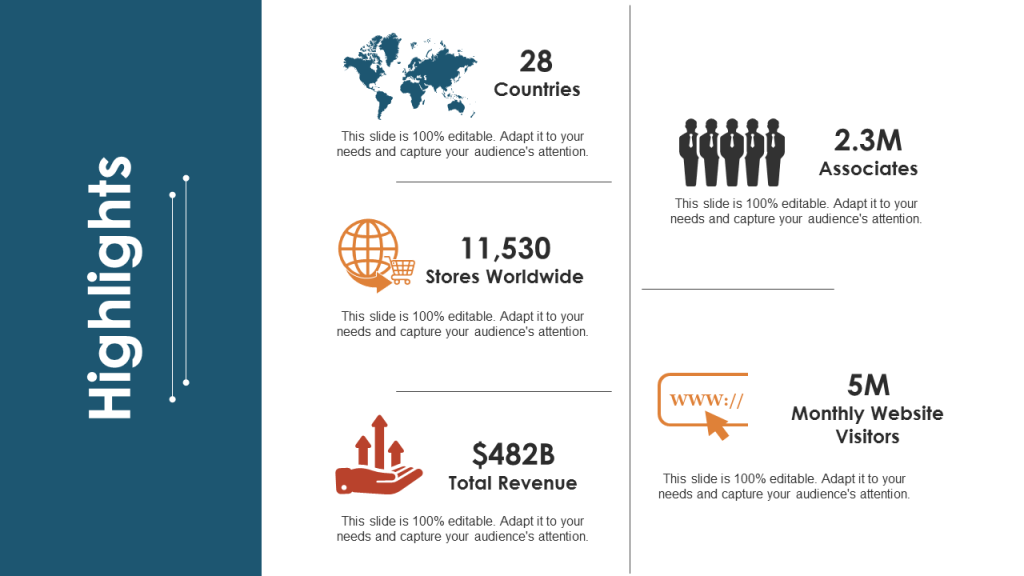
If the audience is relatively new to your business, then you can give a business overview as in the slide below:
Download Financial Highlights & Business Overview Slide (Slide 4 of Complete Deck)
Use a dashboard to show different metrics on one slide such as revenue, gross profit, net profit and earnings per share. Graphs comparing your performance over the last few quarters or years helps decision makers analyse if they are going in the right direction or not.
#2- Revenue Split by Country
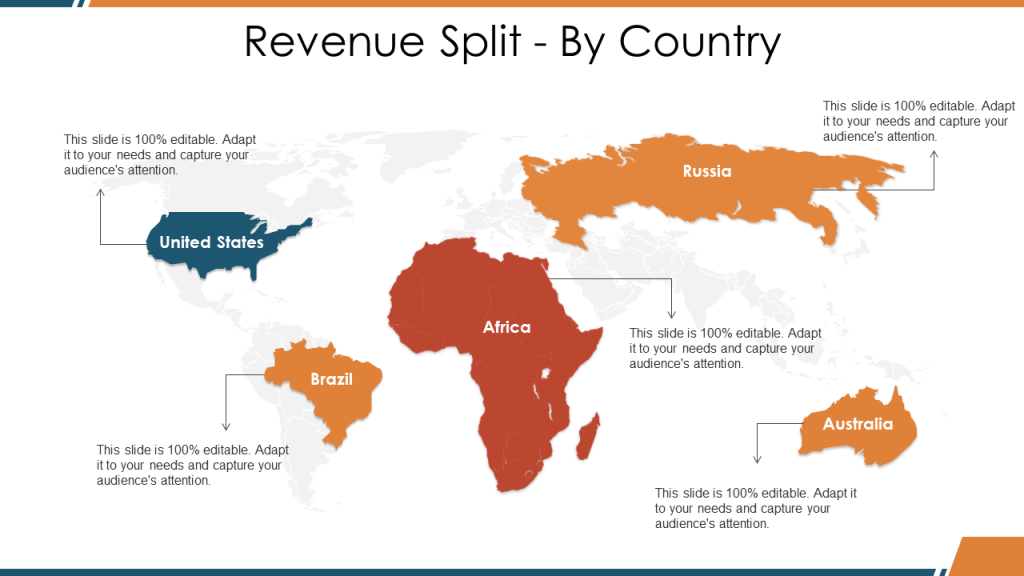
Sales manager can now take each sales metric one by one and see how the sales team fared in that. Analyse which country or countries yielded the most revenue for your team. Map out the results using a world map. This helps you make strategic decisions for the next quarter. Did adding two more sales reps to target Asia yield positive results? If not, they can be assigned to a country that is already giving you maximum ROI. If the result is a tremendous jump in sales, then you might think of adding more.
Download Revenue by Country Editable Map (Slide 7 of Complete Deck)
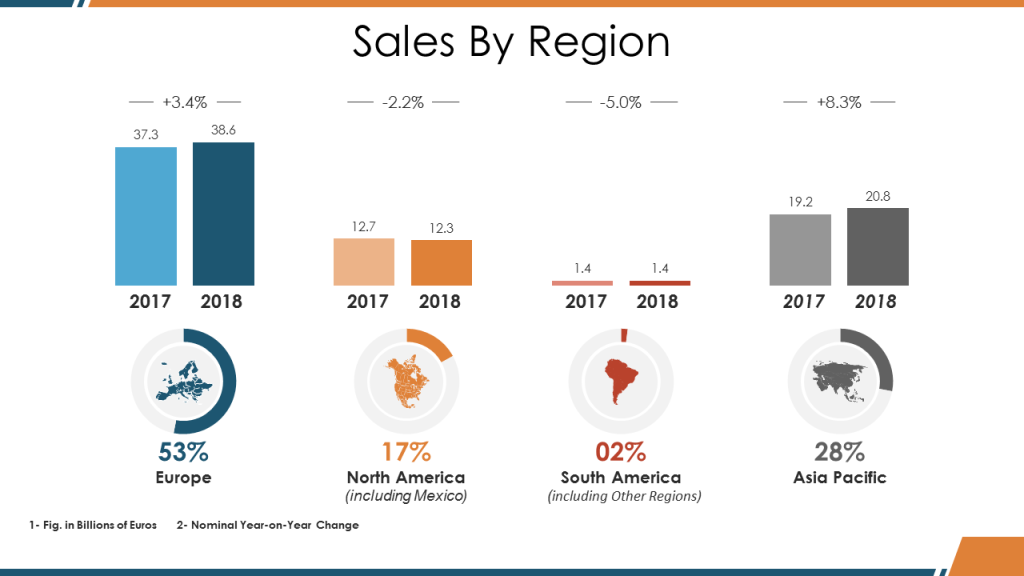
You can also compare this quarter’s or this year’s results with the last to get a better picture.
Slide 12 of Complete Sales Deck
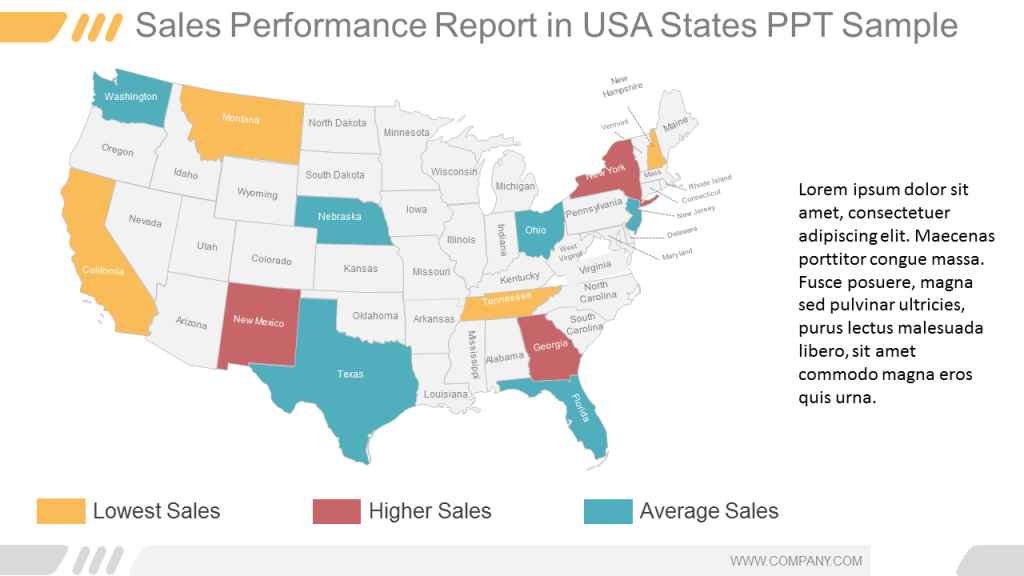
You can also drill down into country by country to identify the areas within that country that are most profitable for you. For instance, you can use US Map to identify highest selling states:
Download this Editable US Map for Sales Distribution
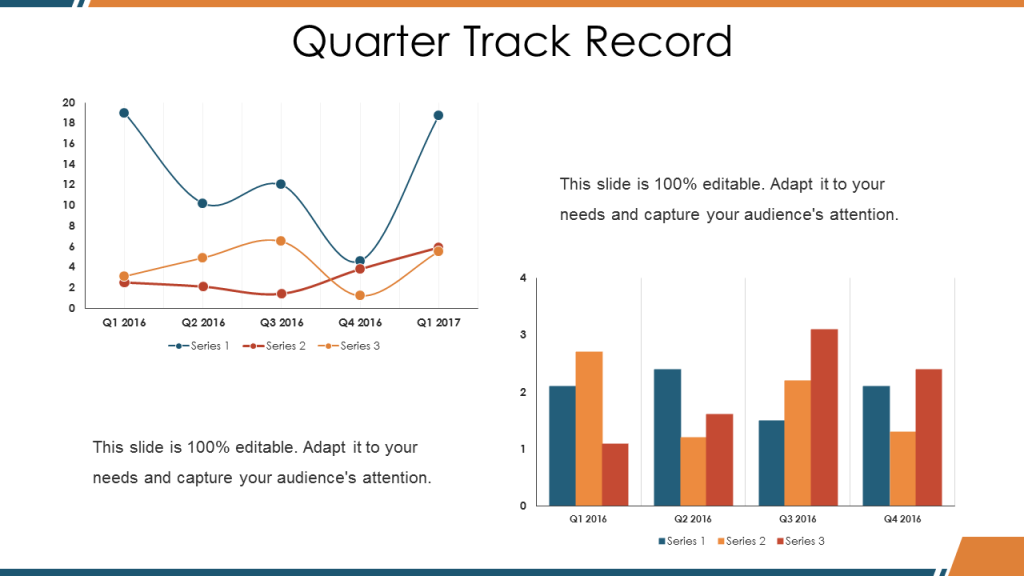
#3- Quarter Track Record
Although you have analyzed your quarterly performance in the executive summary, you might not include that slide if you are presenting to the sales team. Dedicate a slide entirely to measuring your sales performance over the last few months, quarters or years depending on whether your sales review meeting is being held monthly, quarterly or yearly. If you have multiple products, you can use a clustered bar graph or a line chart.
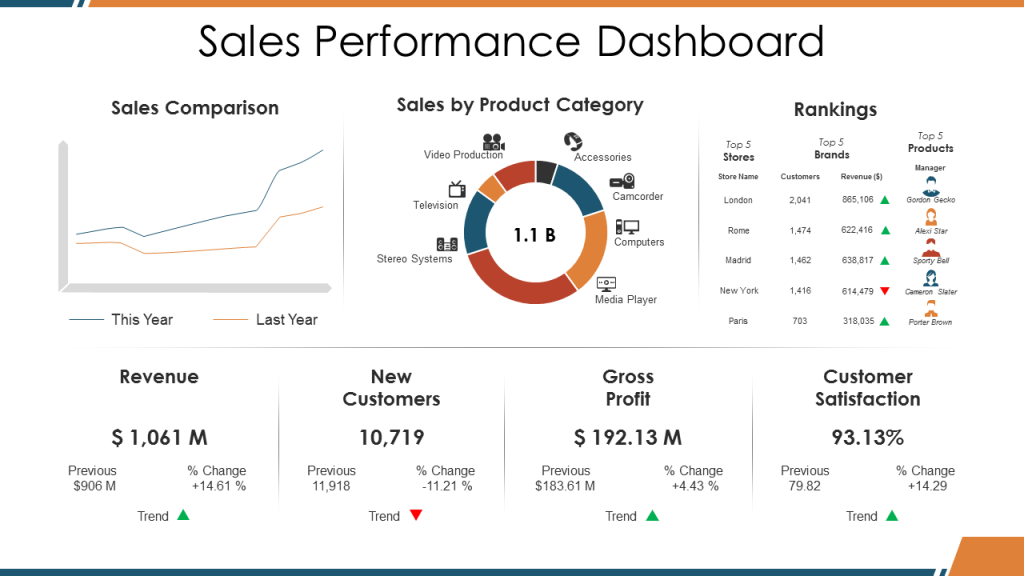
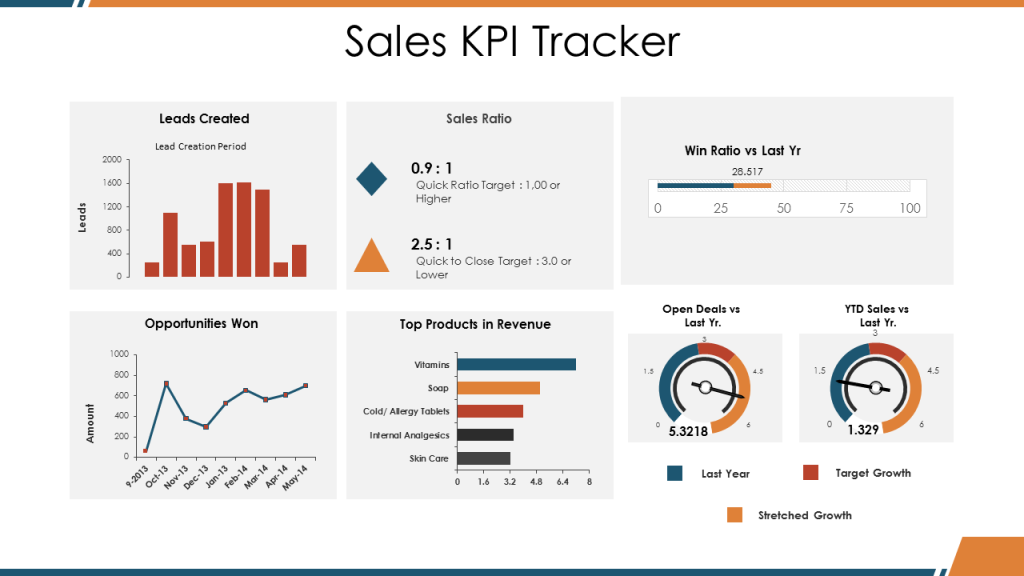
#4- Sales Performance Dashboard
Visualize the most important metrics on one slide using a dashboard template. That ways you are able to compare many metrics together on one slide without going back and forth. The total revenue and gross profit jumped up? That’s great. But the new customers acquired were less in number as compared to last year. Get insights about the fluctuating trends using a sales performance dashboard.
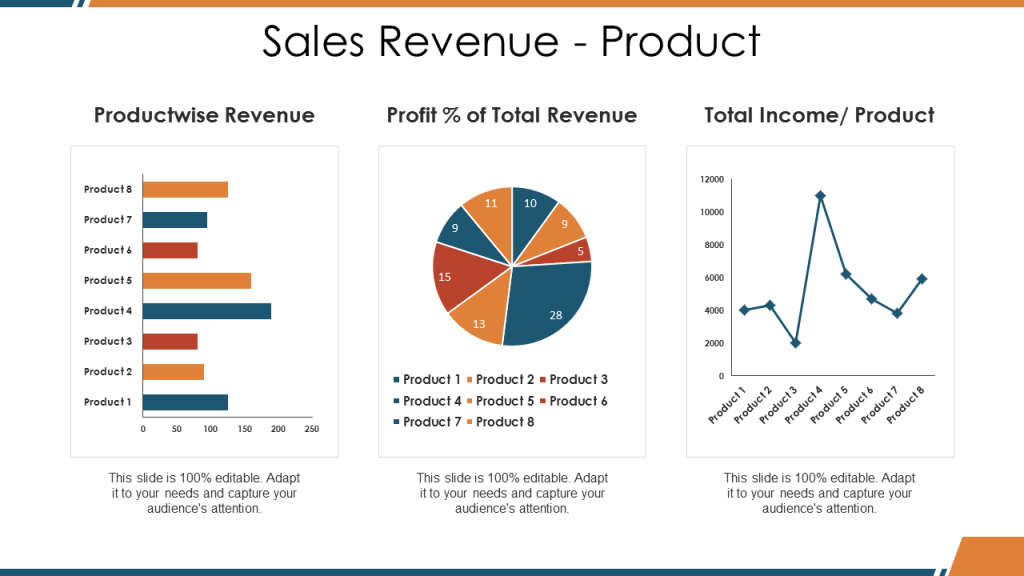
#5- Sales Revenue by Product
If you have a product line, then the top management will be most interested in knowing which products are selling the most and which is performing the lowest. But this alone is not enough to derive any insight. You also need to know the profit percentage of total revenue of each product.
Product A for instance might be selling less in quantity as compared to other products but the product or service’s selling cost might be so high that even a few sales bring in a lot of revenue. On the other hand, Product C might sell a lot but the sale cost or profit margin might be quite less which makes the high numbers not such an impressive feat. Look at sales revenue from different parameters before you reach any conclusion.
#6- Sales Budget vs Actual
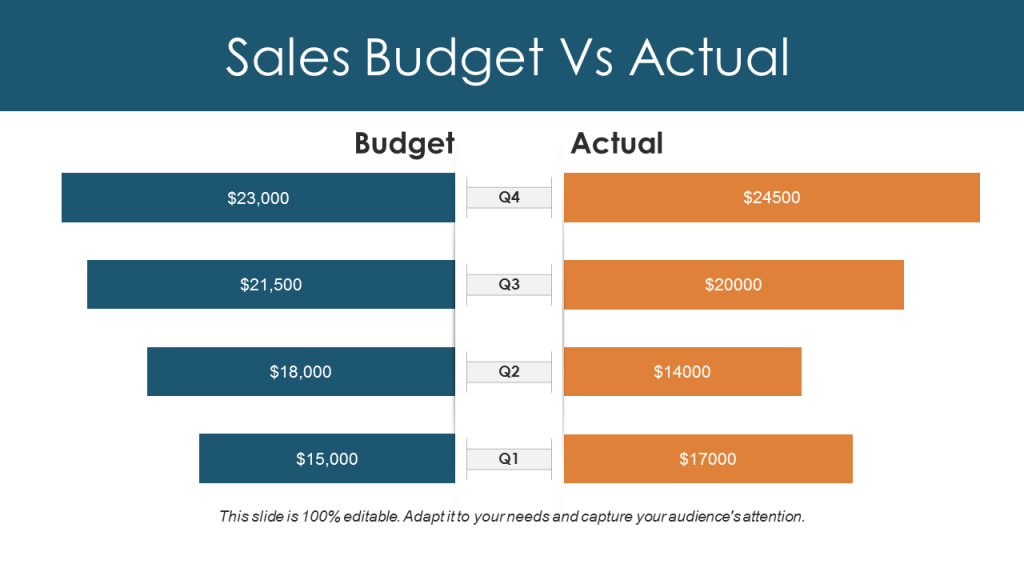
What was the expected sales revenue proposed in the budget? What were the actual sales? This comparison is called as sales budget vs actual and helps the management see the success or failure of the sales team to meet proposed targets. It also helps the management and the sales manager to set realistic goals for the next quarter or year.
#7- Key Sales Performance Metrics
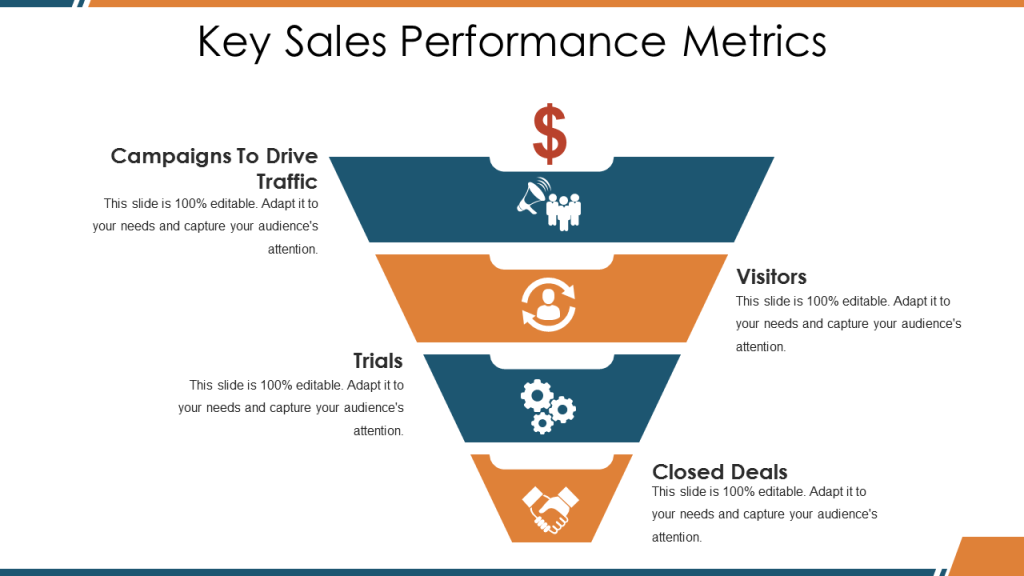
We looked at some sales KPIs above such as sales revenue by region, product and so on. But there are so many other metrics that you have to take into account such as total visitors, number of leads, lead conversion rate, average deal size, and many more. You can present all such important metrics on one slide. You could also showcase your sales funnel to identify where it is leaking the most. In other words, where are leads dropping out. This is can help you identify the problems and improve your sales funnel.
#8- Sale Rep Performance Scorecard
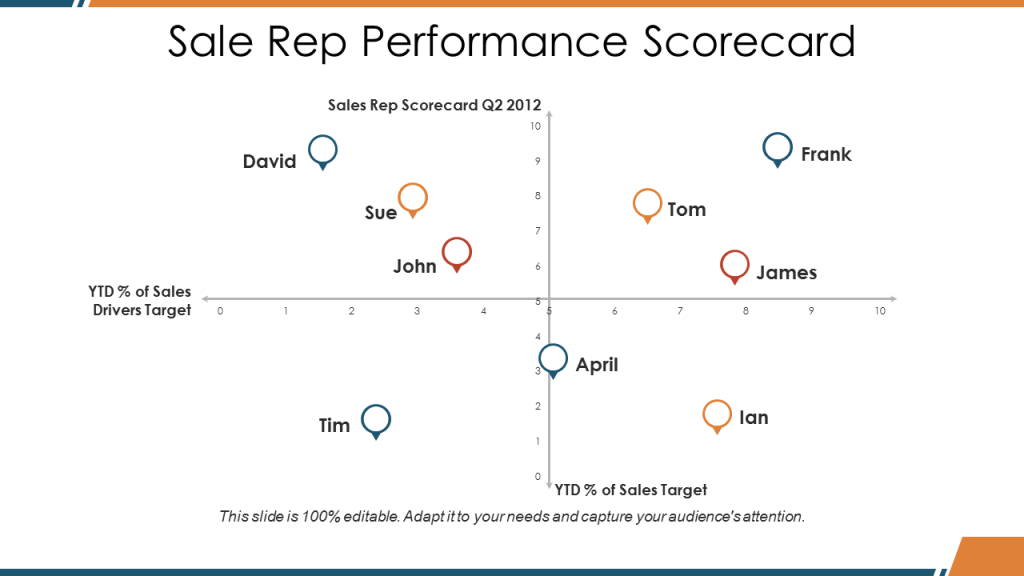
How is the sales team performing overall? How many reps are hitting the sales quota and how many are missing it? The top performers need to be recognised and rewarded and the low performers too need to be identified and helped. A Sales Rep Performance Scorecard template can consist of a 2x2 matrix where each rep falls in one of the quadrants. The X axis is the percentage of sales driver target i.e. the sales initiatives that need to be taken to meet target. The Y axis is the actual sales target meaning who are fulfilling their quotas and who are not.
The ones in top-right are the ideal sales reps who are playing by the book and meeting their numbers. Those in top-left are not playing by the rules but for now are managing to hit numbers. They need to be guided so that they move in to the top-right quadrant. The bottom right comprises of those reps who are doing what is asked of them but are not meeting their quotas. Their problems need to be identified and with training and motivation they will move upwards. The bottom left are neither doing what they should be doing nor any close to their target. These reps need a warning. Perhaps the sales rep performance scorecard itself is a warning and recognition tool and fosters healthy competition within the sales team.
#9- Sales KPI Performance - Summary
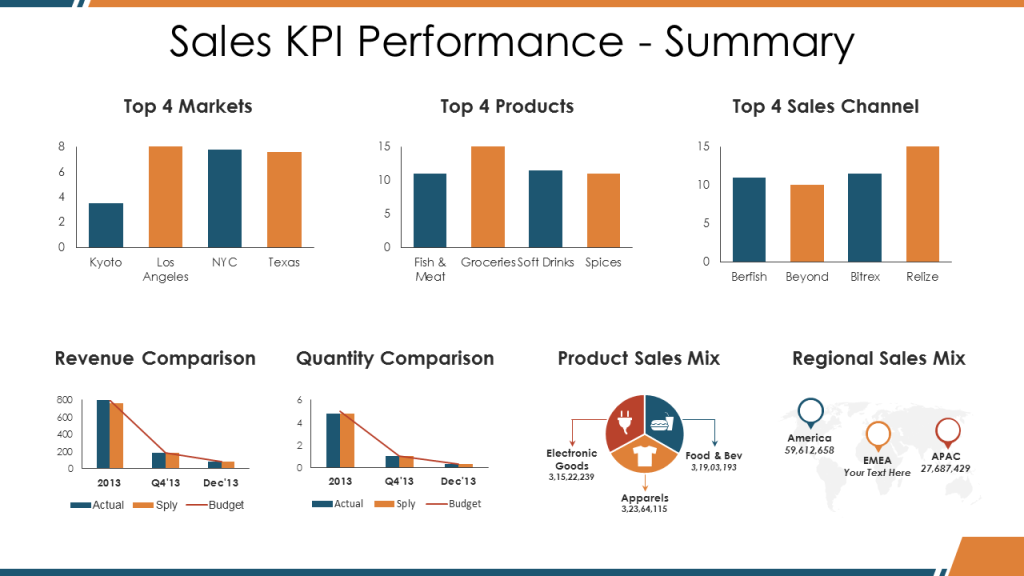
You can provide this report towards the end to summarize the main findings and trends observed over the last quarter, month or year. Which were the top 4 or 5 selling products? Which were the top markets? Top sales channels? Basically, a snapshot of the sales performance of the last quarter and its comparison with last.
Here is another dashboard template measuring sales performance against other key performance indicators:
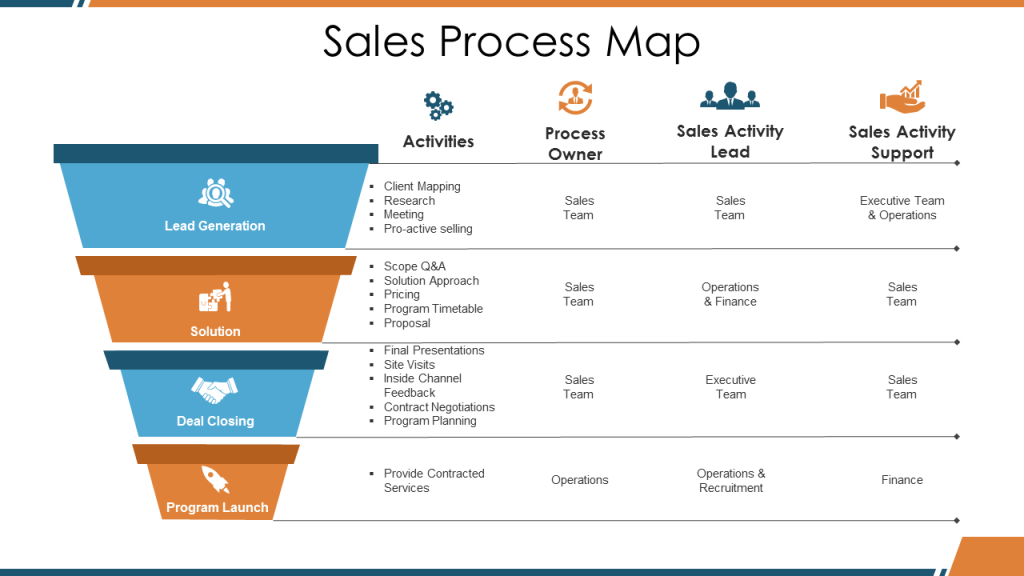
#10- Sales Process Map
Your sales process starts right at finding new prospects and continues till they are a customer. It is a series of steps that your sales reps follow at each stage to get a higher win rate. You have obviously developed this sales process after years of experience and learning from success and failures. It is imperative that the Sales Process Map is on the fingertips of every sales rep so that maximum prospects are converted into loyal customers.
Here is a sales process map template that describes what most sales team typically do at each stage of the sales funnel. It also identifies the support needed from another team such as that of the accounts team for flexible pricing, operations team for introducing a product feature and so on. This should definitely be a part of every sales report.
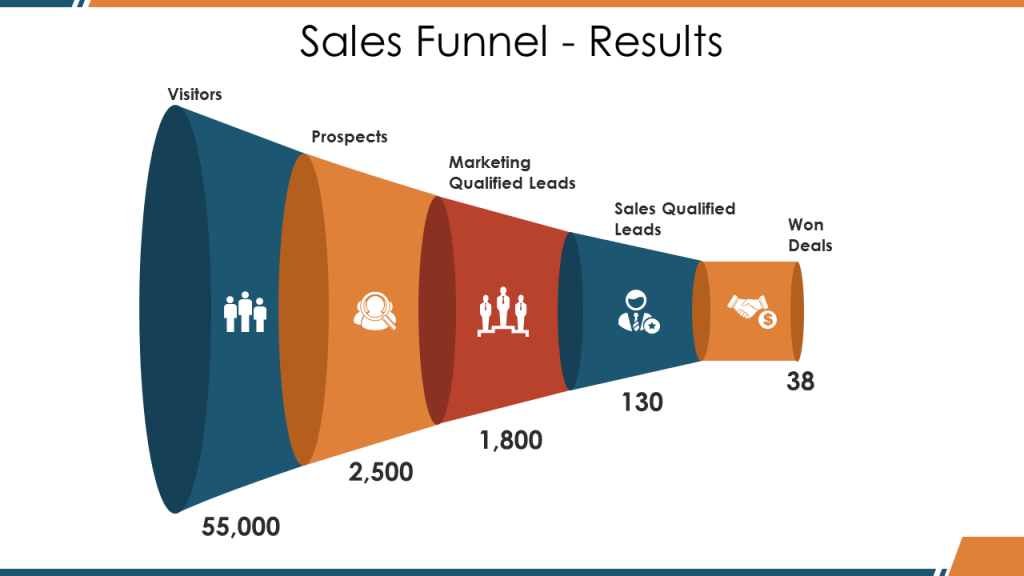
#11- Sales Funnel Results
Now track your team’s performance at each stage of the sales funnel. How many visitors entered the website? How many of those were qualified as prospects? How many did marketing team qualify and pass on to the sales team? How many were further nurtured by the sales team? And finally how many were turned into paying customers? Analysing sales funnel results helps you identify the stage where improvements need to be made to get better results next time.
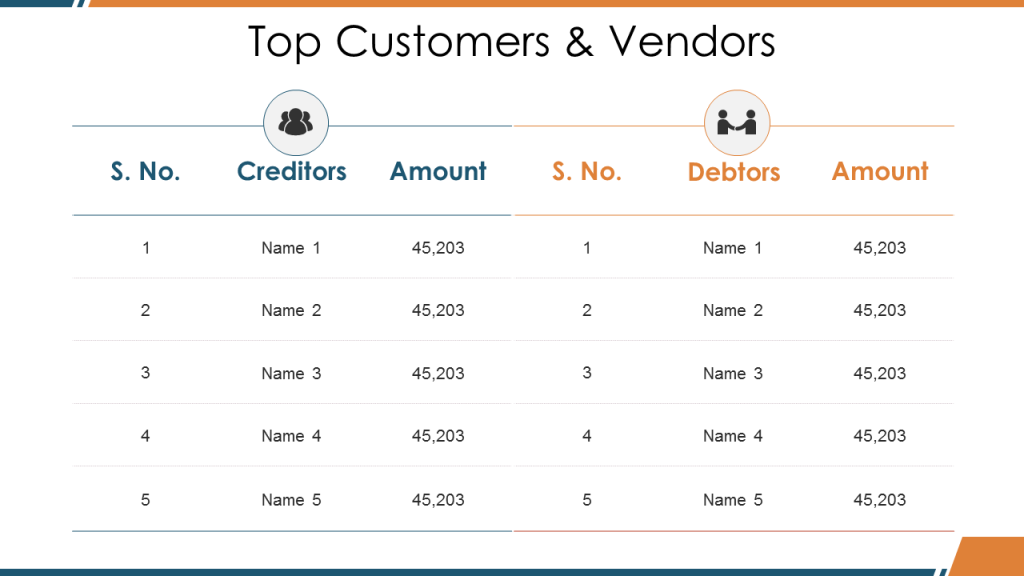
#12- Top Customers & Vendors
Identifying the top customers and vendors is a good practice as you want them to be repeat customers. This category of your customers has to be kept engaged and satisfied with your product and service at all times. Customer support has to give priority to their concerns. Operations, marketing and sales team have to let them know of latest features and offerings first.
In your focus to acquire new sales, don’t forget the old ones. If they remain happy customers, they will refer others besides being loyal to your service.
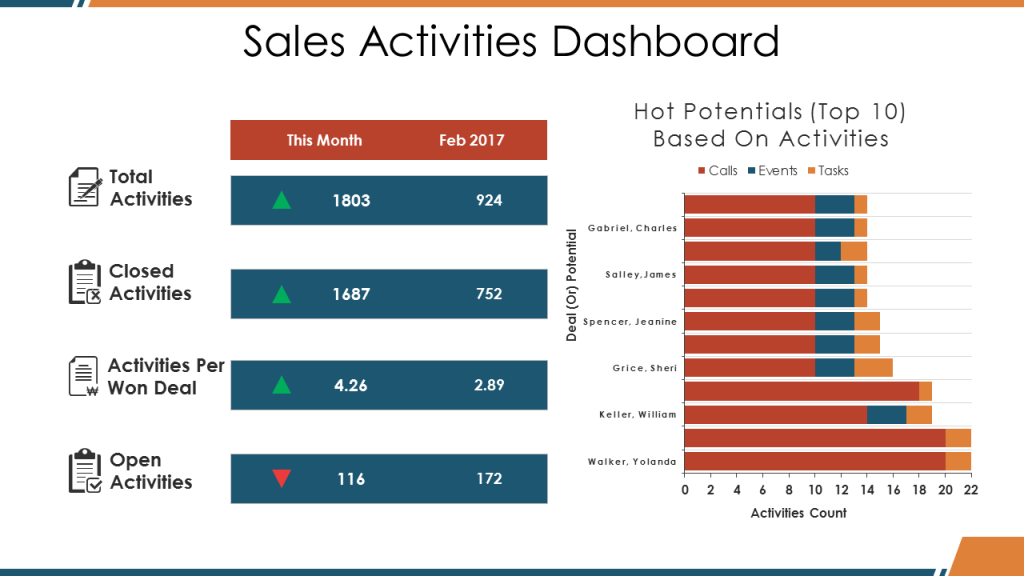
#13- Sales Activities Dashboard
Sales reps perform a number of sales activities at each stage such as calling, emailing, giving demos, presentation, and so on. Track the number of total activities - closed and open. How many activities on average did the sales rep make to close a deal? Sales activities dashboard is another way to improve the performance of the team. This slide also helps you identify the hot potentials to become a customer based upon activities. A prospect who downloaded your case study, attended a call from the sales rep, even attended an online demo arranged by him is definitely a hot potential for you and his or her concerns should be of top priority to the sales rep.
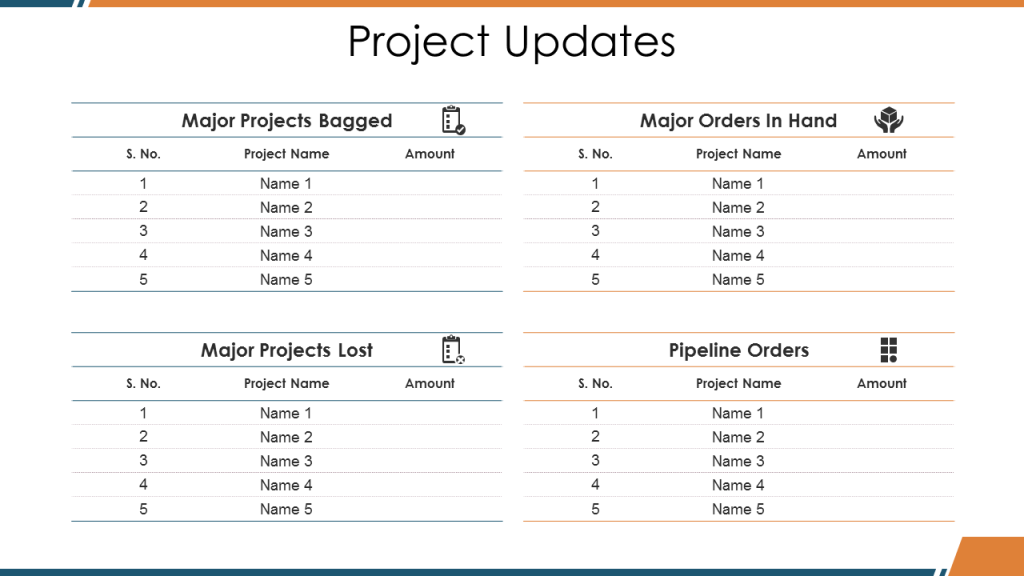
#14- Project Updates
Also include a slide on project updates covering major deals won, deals lost, deals in pipeline, and orders in hand. The deals lost and won in the last quarter motivate sales reps to grab big deals that will be proudly presented in next review. The orders in pipeline are an opportunity to win those deals.
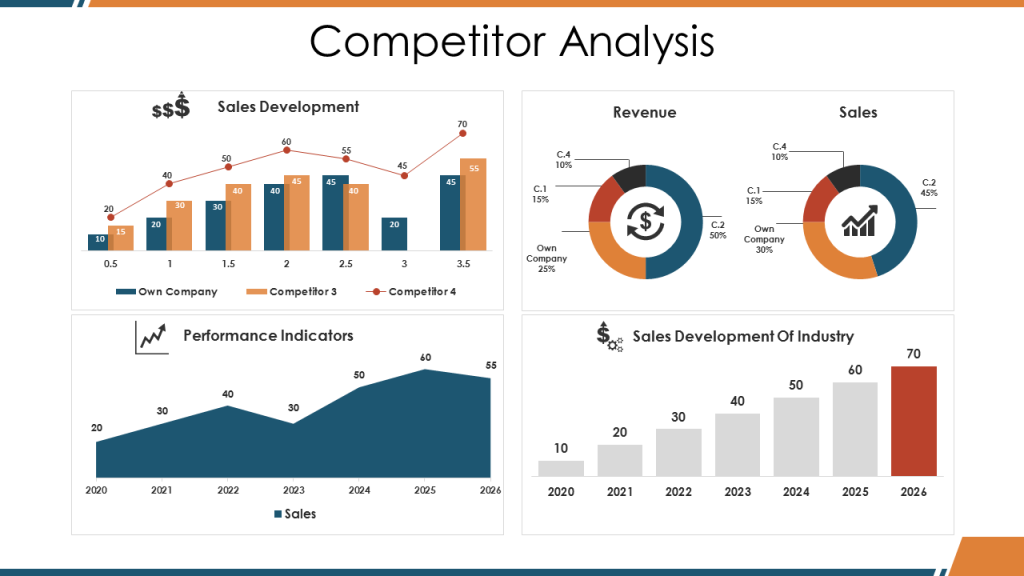
#15- Competitor Analysis
You are not fighting the war of sales alone. As much as your team is strategizing every move, so are your competitors. You should know what strategies they are using and their performance vis-a-vis yours. That gives you a realistic picture of where you stand. Use a dashboard to compare competitor analysis and industry analysis.
Download Competitor Analysis Dashboard (Slide 30 of Complete Deck)
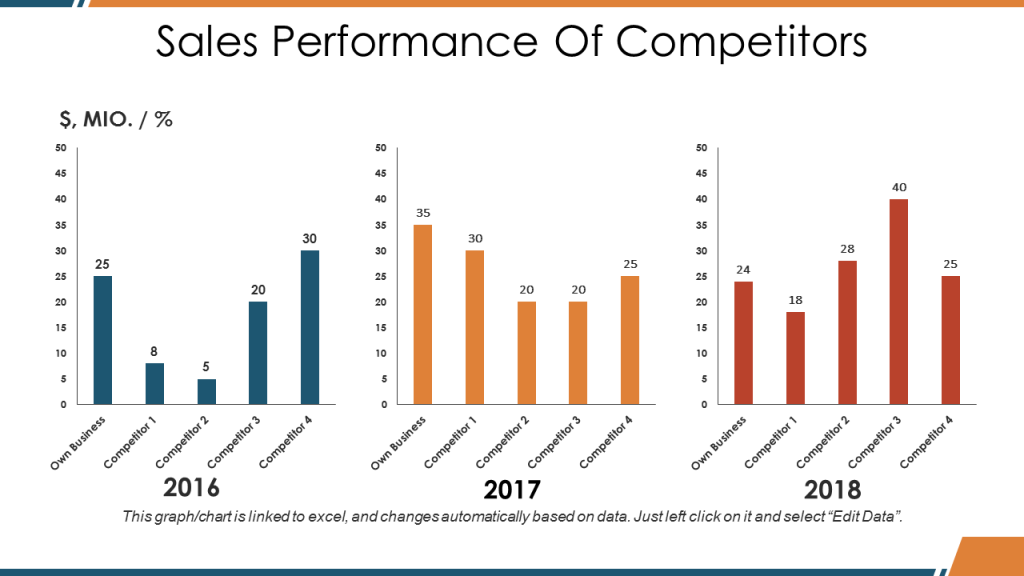
Also compare sales performance of you and your competitors over the last few years to see who is stealing the lead in the race. If it’s your team, congratulations. If not, the race is not yet over.
#16- Future Perspective (Product Roadmap)
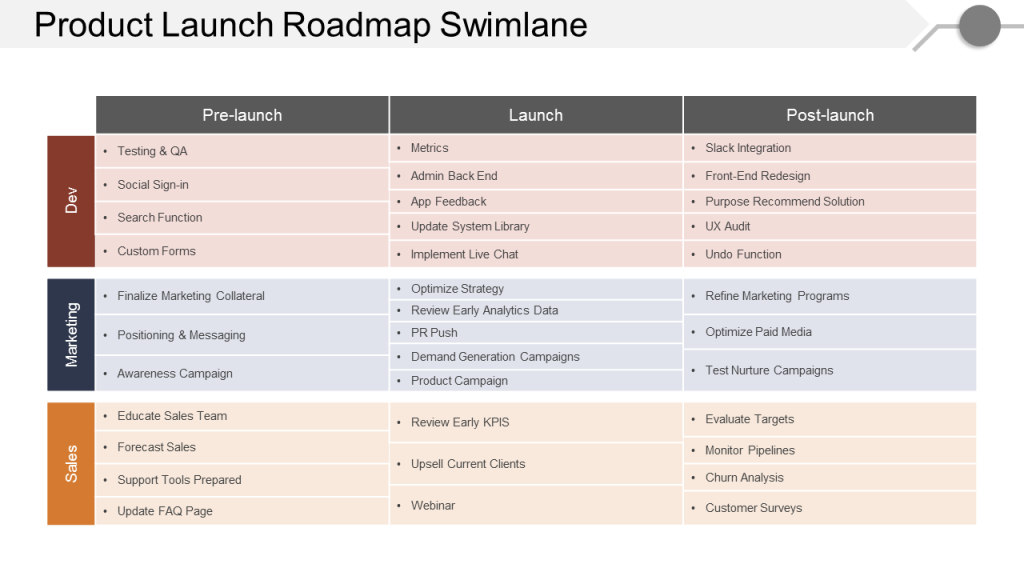
How is the product likely to evolve over the coming quarters? What new features are going to be integrated in the existing product? A Product Roadmap is created by product manager to set a direction for development of product in a time-bound manner. This is useful for the sales team as they have to create sales strategies accordingly.
If the management has decided to roll out a product or a special feature by the last quarter of the financial year, the sales team has to start creating a market for the new launch in advance. Share this roadmap with your sales reps so that they are prepared and utilize the time to build interest in the market.
Download this Product Roadmap Template
Related Blog: Types of Product Roadmaps & Roadmap Templates For Successful Launch
#17- Sales Roadmap
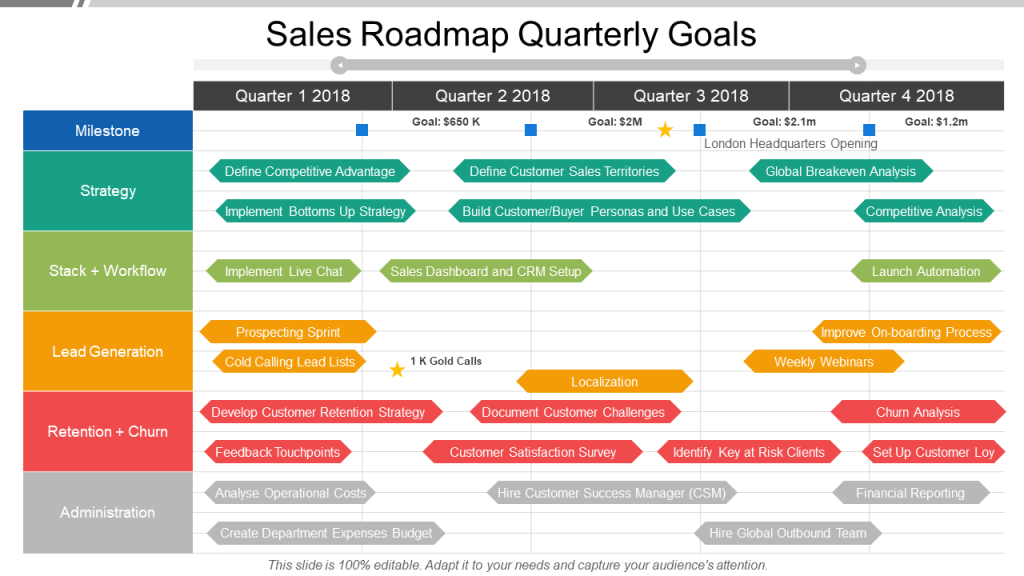
Most efficient sales managers map out their sales strategies in the form of a sales roadmap template. This is a high-level overview of sales initiatives you will take to better your selling prospects. A sales roadmap doesn’t fetter you in chains as you keep updating it as requirements change. However, a roadmap serves as a guide and helps you reach your destination i.e. sales targets faster. Share the sales roadmap with your sales reps so that they see the big picture and align their efforts to achieve the big goal accordingly.
Download this Editable Sales Roadmap Template
Sales professionals and the sales manager have to be good at presenting. And they are. They have to ensure their internal sales reports look professional and presentable too. Of course we know that they do not have time to create charts, tables and so on. Yet they can’t do away with it. Fall back on professional sales PowerPoint templates to make a quick quarterly sales review report and rock it!


 Customer Reviews

