Total quality management lets you focus on quality improvement by eliminating waste and thus increasing efficiencies.
Execute quality management process to ensure that the deliverable or products that are produced meet the customer’s requirements. Hence, boost the quality of your products and achieve your goals.
Run a quality management process in your organization to deliver high quality products to the consumers.
Download Quality Management System Complete Deck
21 Templates To Ensure Good Quality:
- TQM Pyramid:
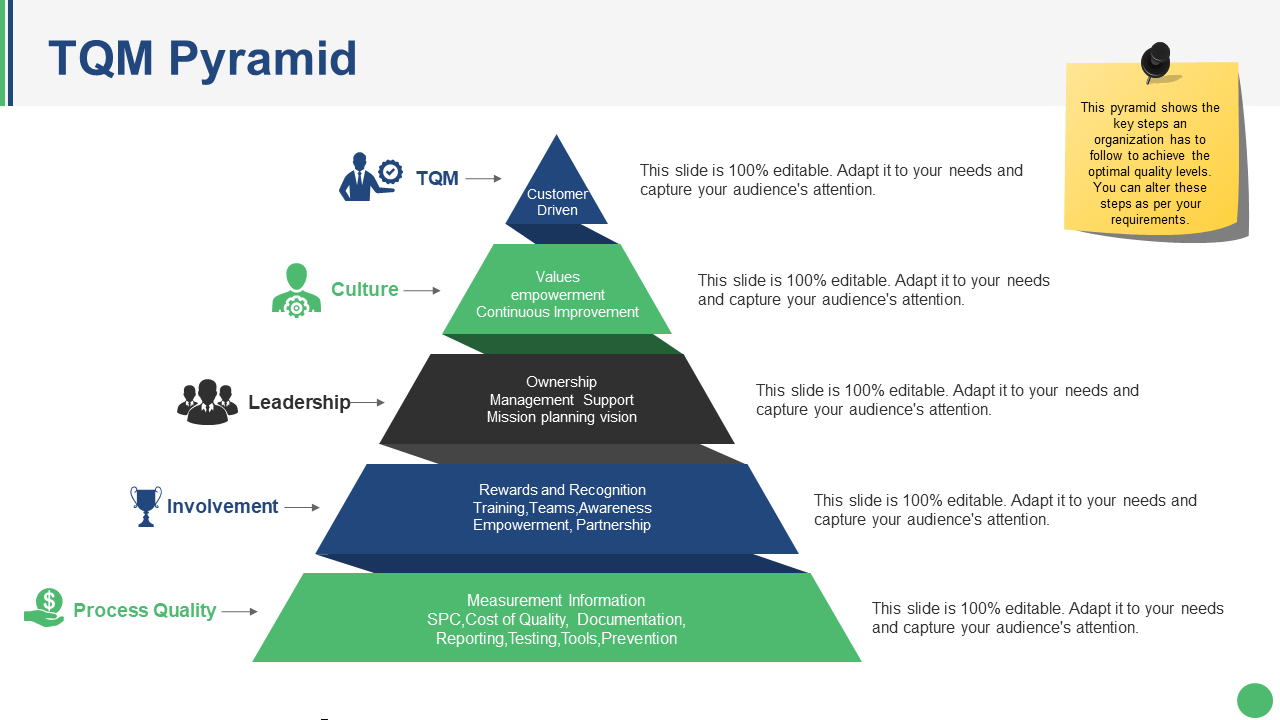
TQM pyramid ensures that the organization meets or exceed the customers expectations. This pyramid shows the key steps an organization must follow to achieve the optimal quality levels. The process aims to ensure that the final output or result meets the need of the stakeholders. You can achieve the highest quality level by going through step by step using this TQM pyramid.
- TQM Model:
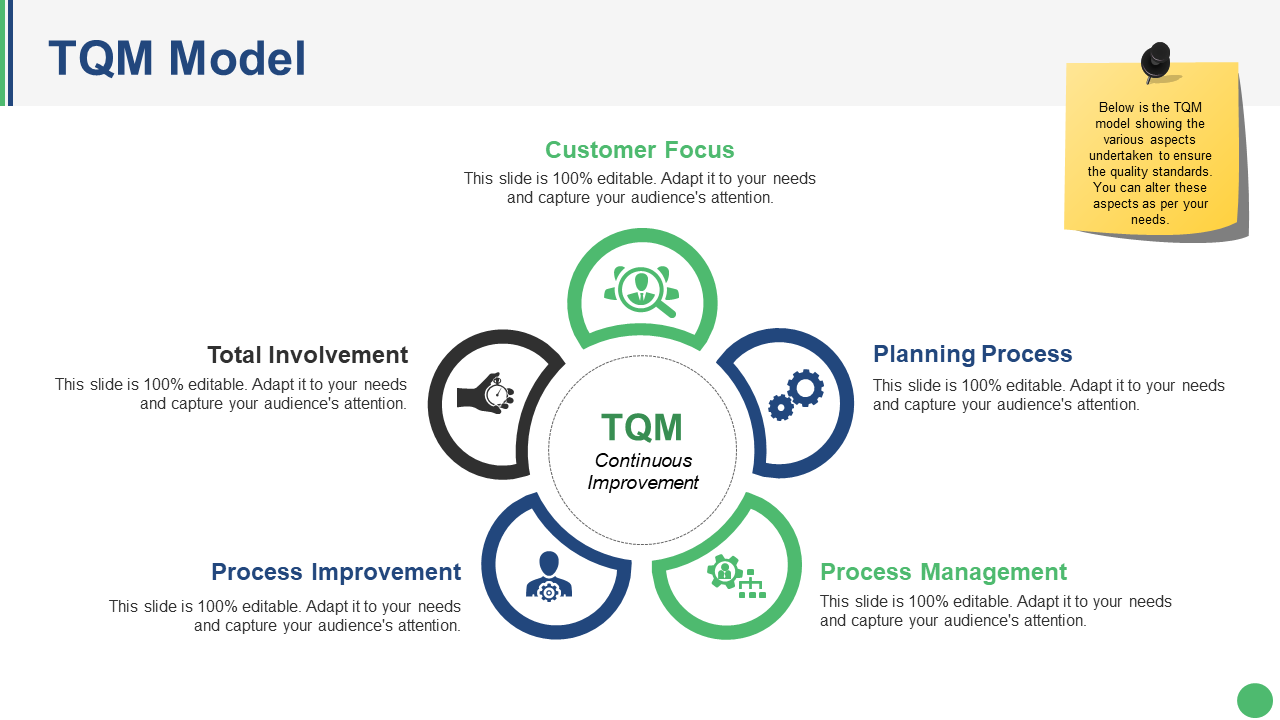
Above is the TQM model which shows the various aspects undertaken to ensure the quality standards. It starts with understanding the customers and their needs. Collect information and data to further analyze and act accordingly.
- Customer Focus in TQM:
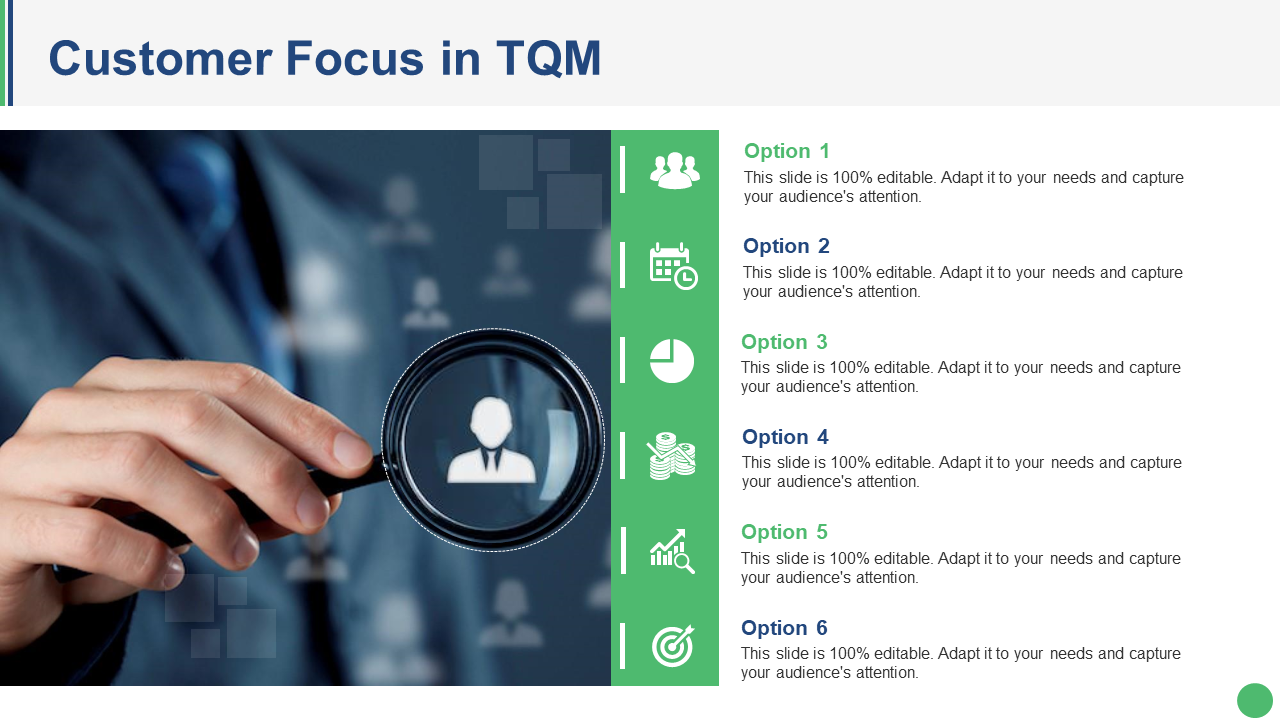
One of the most important success factors for business is customer satisfaction. Find out what customers want, their needs, how often do they buy and how their post purchase satisfaction will be ensured. Use above template to ensure customer satisfaction in total quality management.
- Planning Process in TQM:
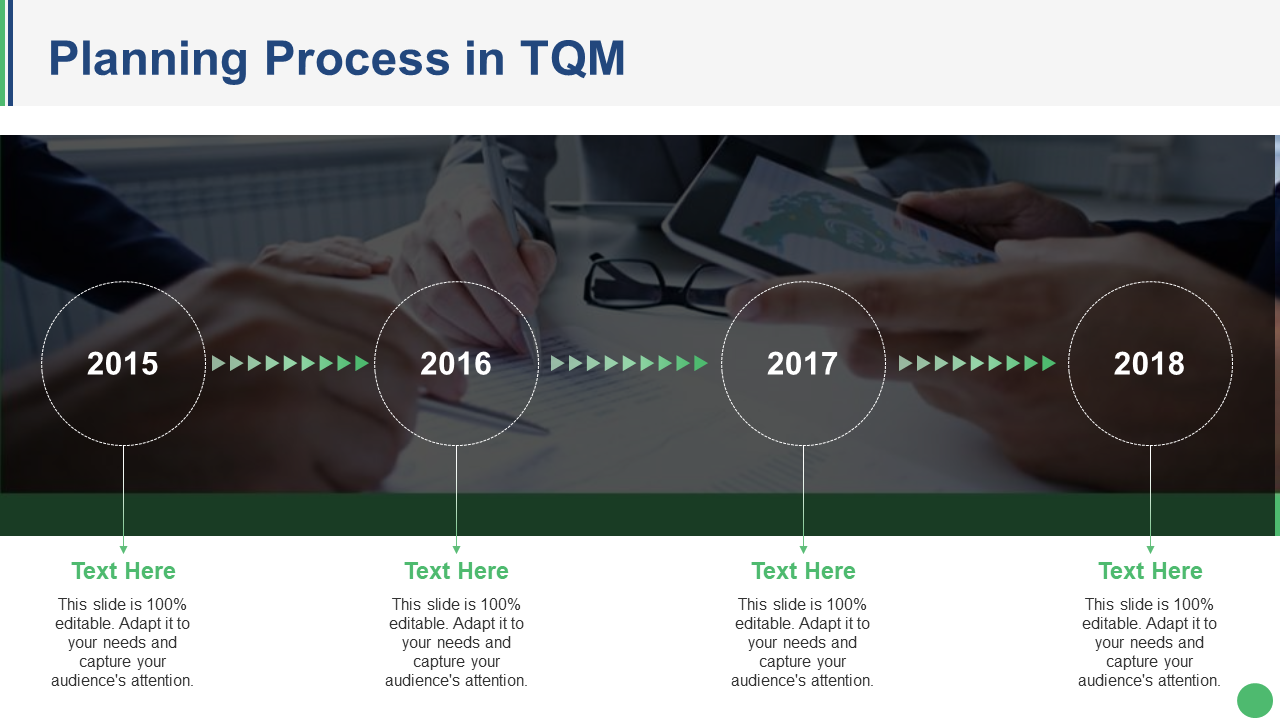
Once you gather the information about the customers, create a strategic plan to meet those needs. Planning process in TQM requires an organization to determine the best approach to make the customers happy. Assess and evaluate the customers and come up with a plan to improve the quality of an organization.
- Process Management in TQM:
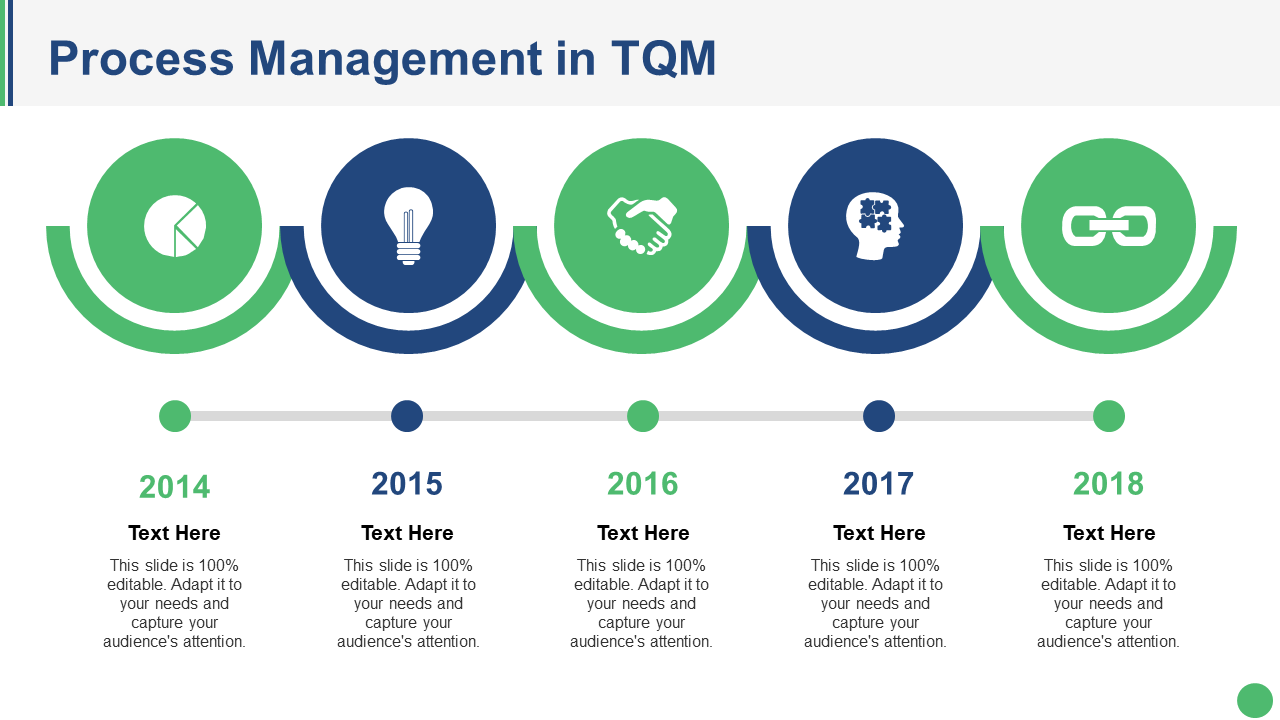
Business process management lets you deliver value added products and services to clients and customers. It is an important part of an organization. Because of which it needs to be managed and understood. Use above template to implement this process to provide customers what they want.
- Business Process Improvement:
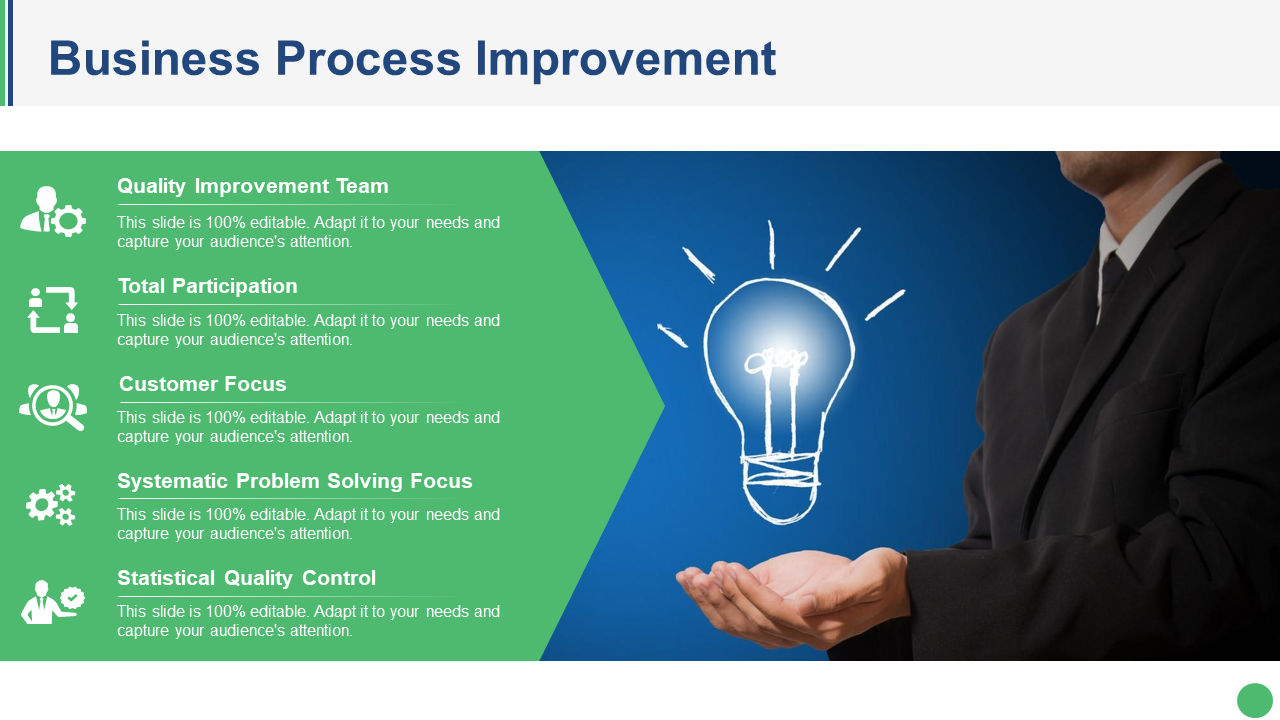
It is a discipline that helps management improve the efficiency and accuracy of their business processes. Use this methodology to find those areas in the processes which can improved and redesign those processes again.
- Involvement of People:
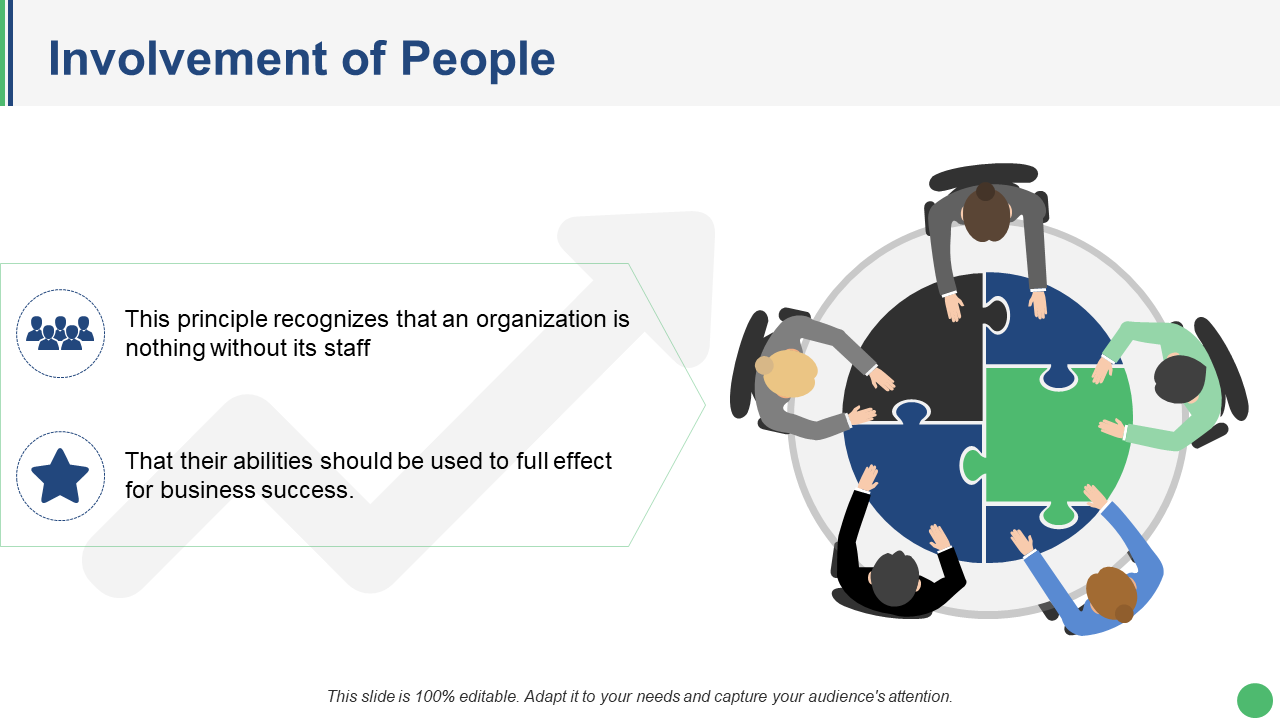
Employee involvement form the foundation of TQM. Employee’s abilities should be used to full effect for business success. However, managers or employees who like patronizing will make it difficult for TQM to work.
- Determinants of Product Quality:
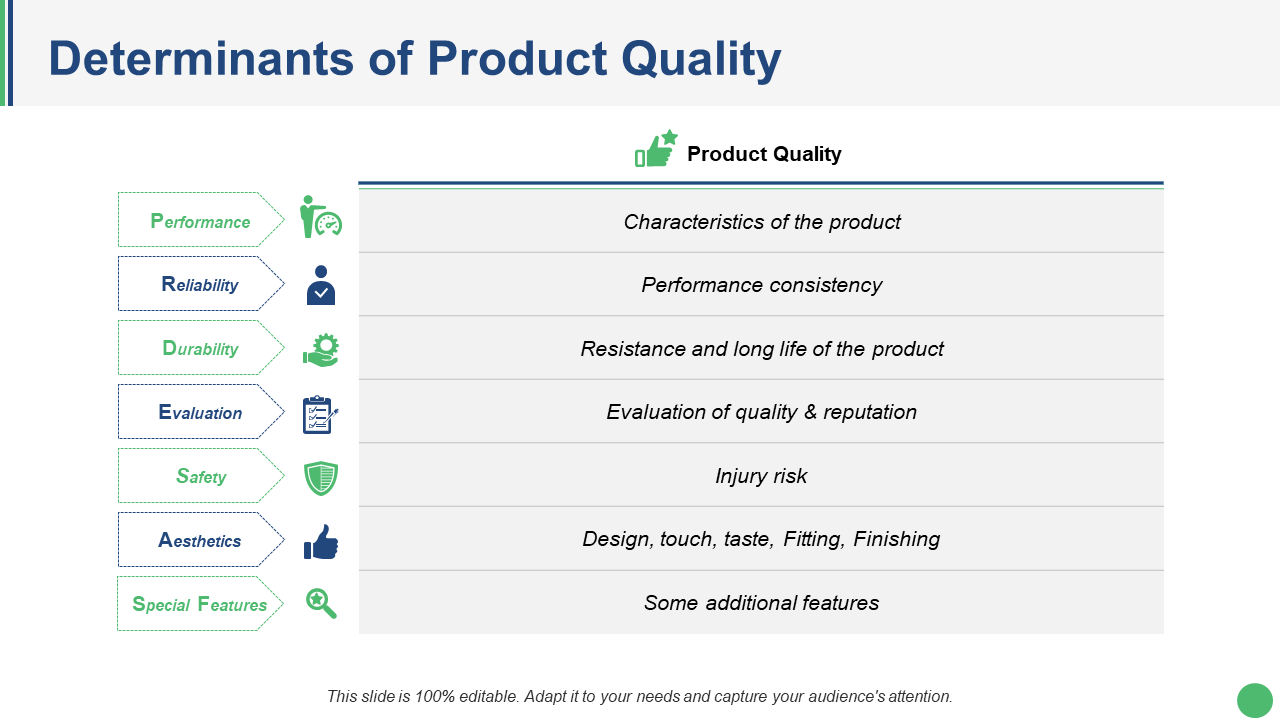
Incorporate this template to showcase basic features that a product needs to have to satisfy consumer demand, increase market share and therefore remain competitive in the market. You can add or delete the features as per your need.
- Determinants of Service Quality:
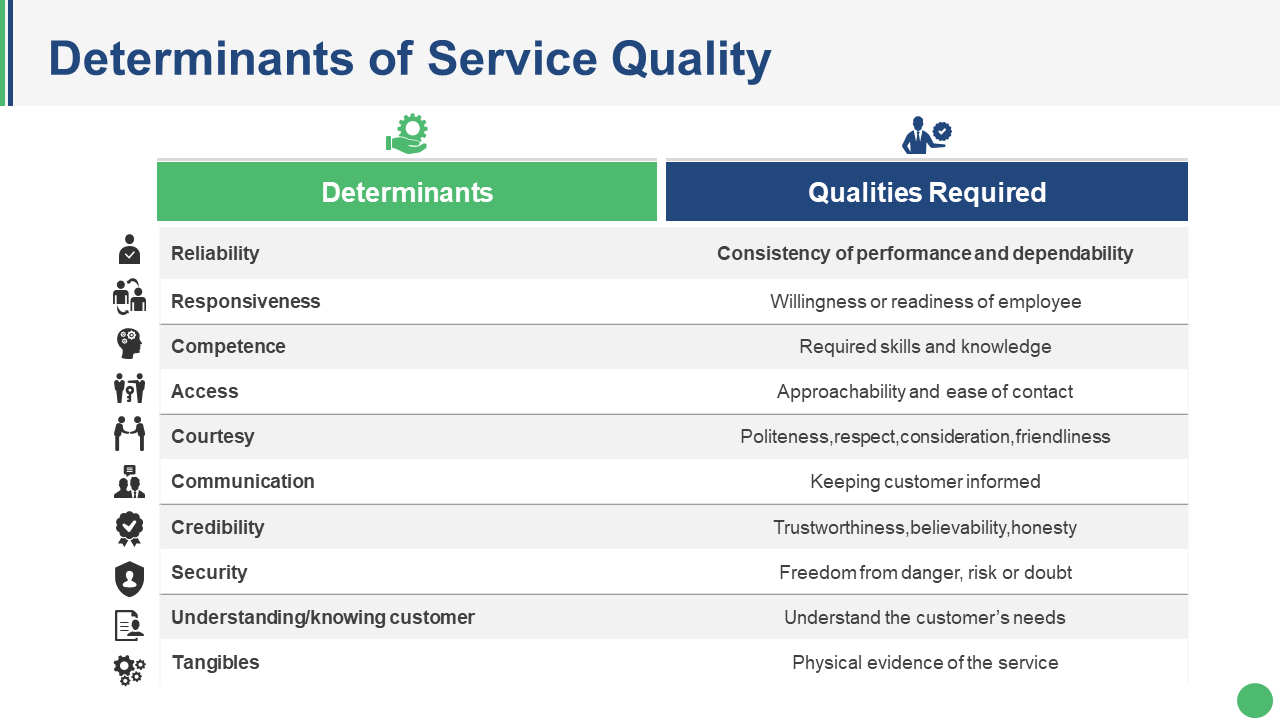
Use above slide to show the determinants of service quality. The various determinants associated with service quality in TQM are reliability, credibility, access, communication and more.
- Importance of Good Quality:
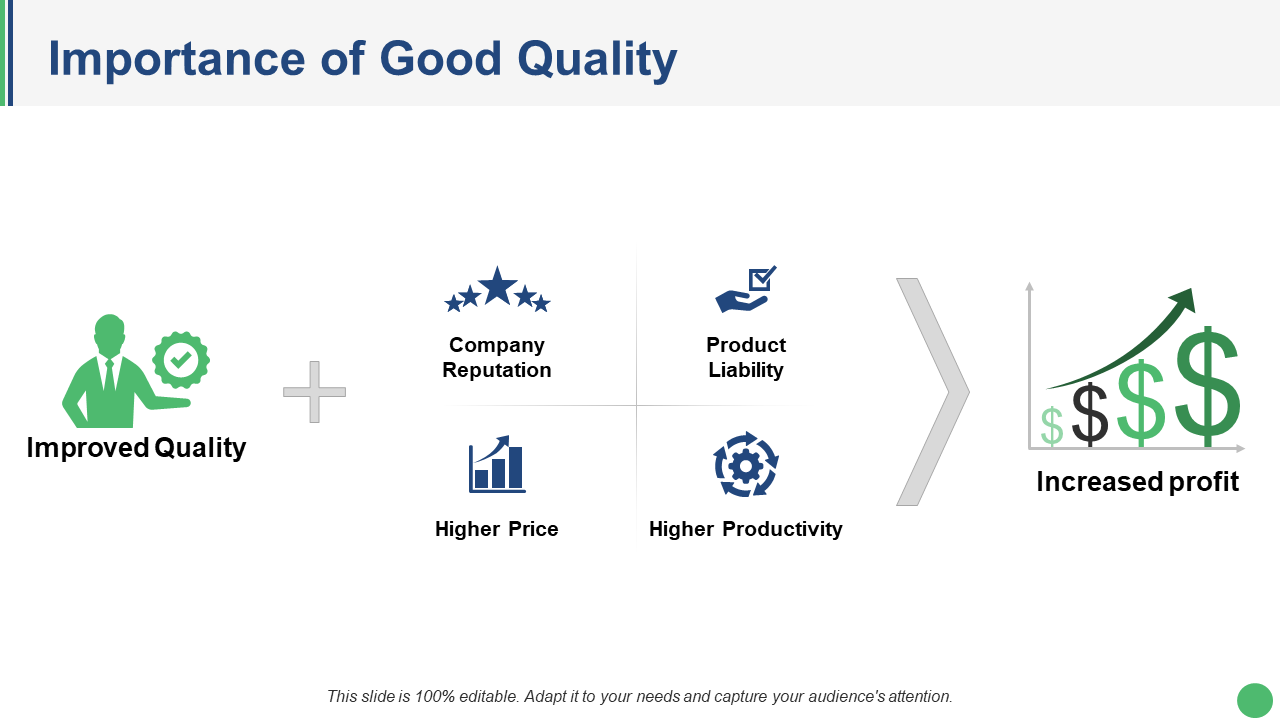
Explain why it is important to have a good quality with this visual. Good quality ensures customer’s loyalty. It also contributes to long term revenue and profitability.
- Consequences of Poor Quality:
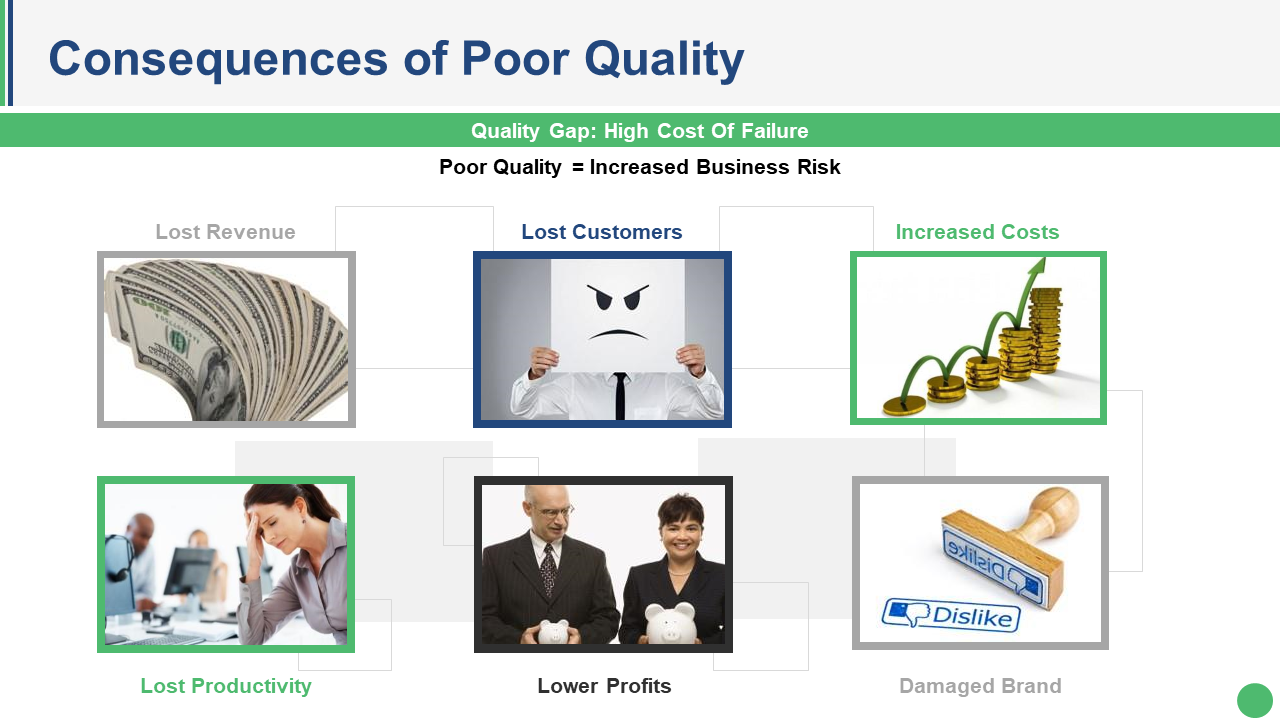
Poor quality leads to customers loss, revenue loss, lower of profits and more. Use the above template to showcase the consequences of poor quality.
- ISO Certifications:
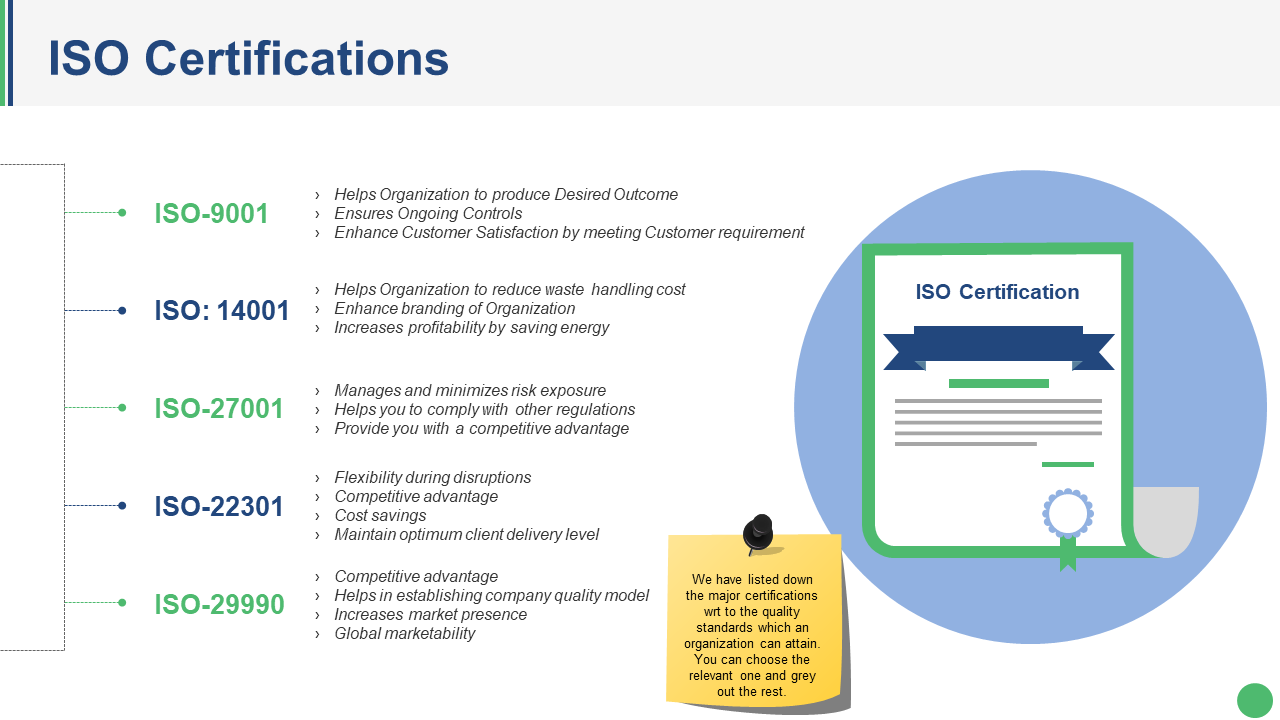
Achieving an ISO certification shows that an organization is following well established industry standards. Above template shows the major certifications related to the quality standards which an organization can attain. You can choose the relevant one and leave the rest.
- Pareto Chart:
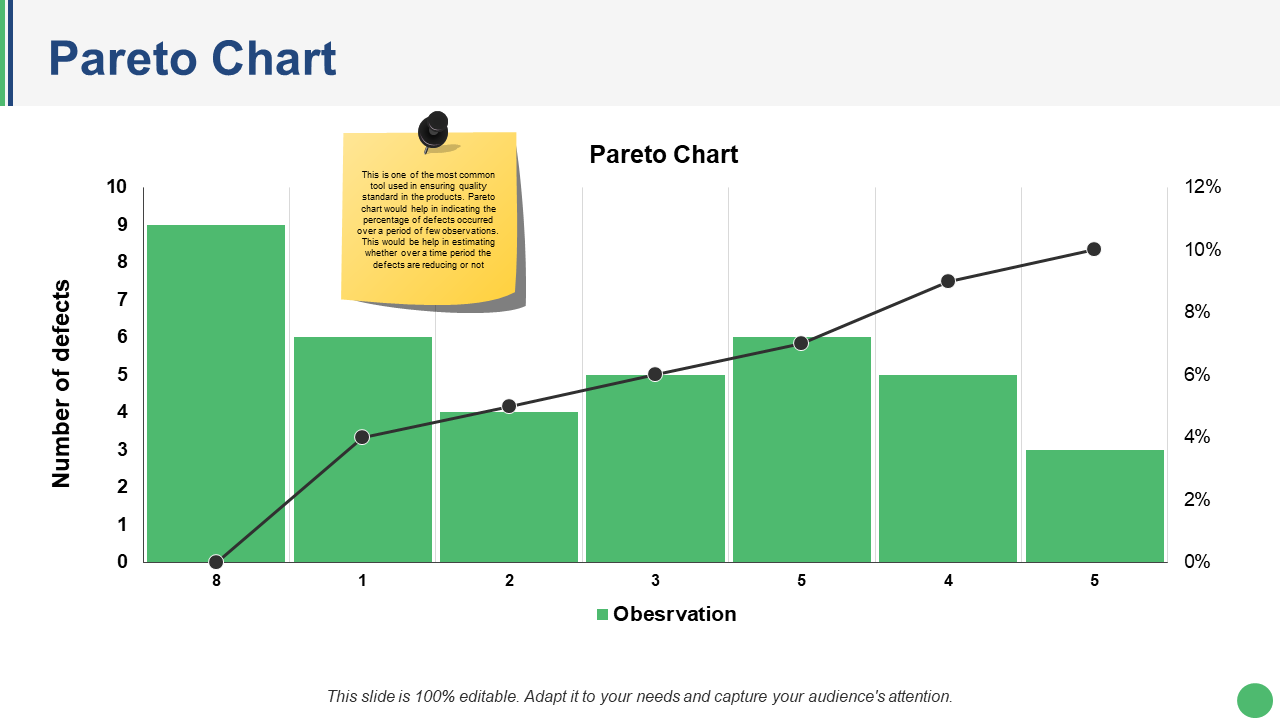
This is one of the most common tools used in ensuring quality standard in the products. This will help in troubleshooting the issues related to quality. Pareto chart would help in indicating the percentage of defects occurred over a period of few observations. This would help in estimating whether the defects are reducing or not over the time.
- Fishbone Diagram:
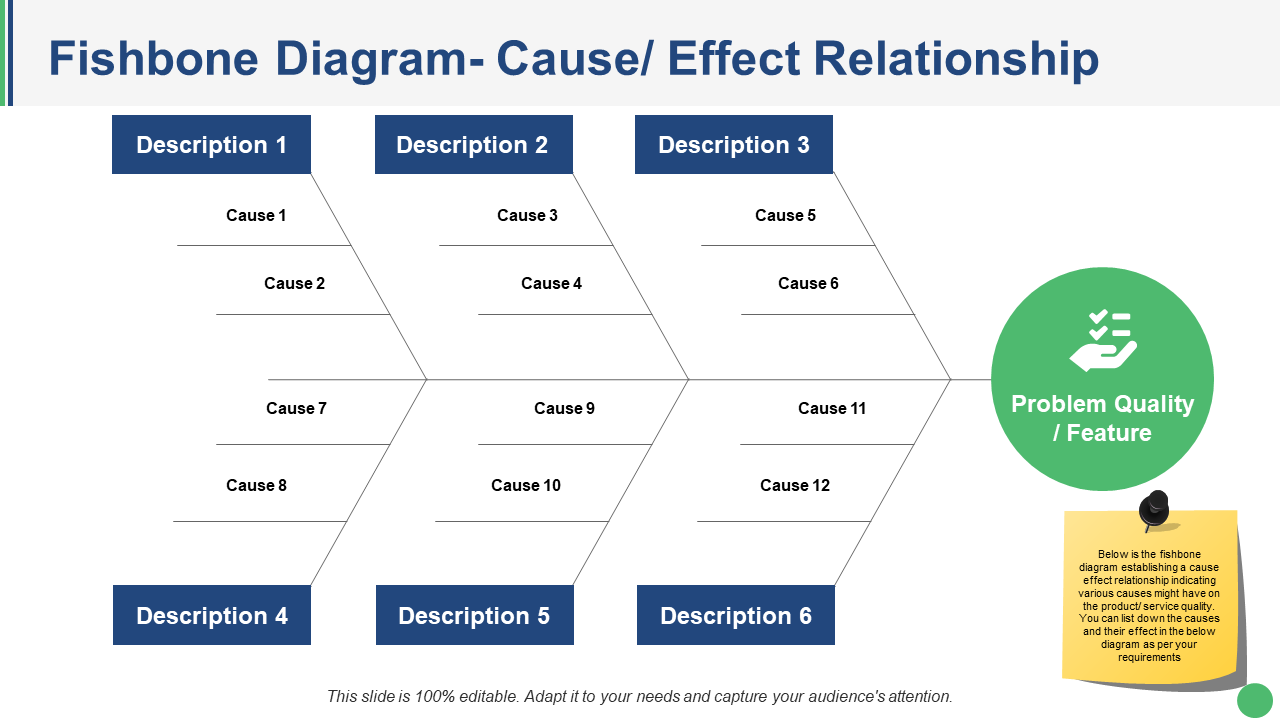
This is another commonly used tool in determining the quality. Above is the fishbone diagram establishing a cause effect relationship indicating various causes product or service quality might have. You can list down the causes and their effect in the diagram as per your requirements.
- Root Cause Analysis:
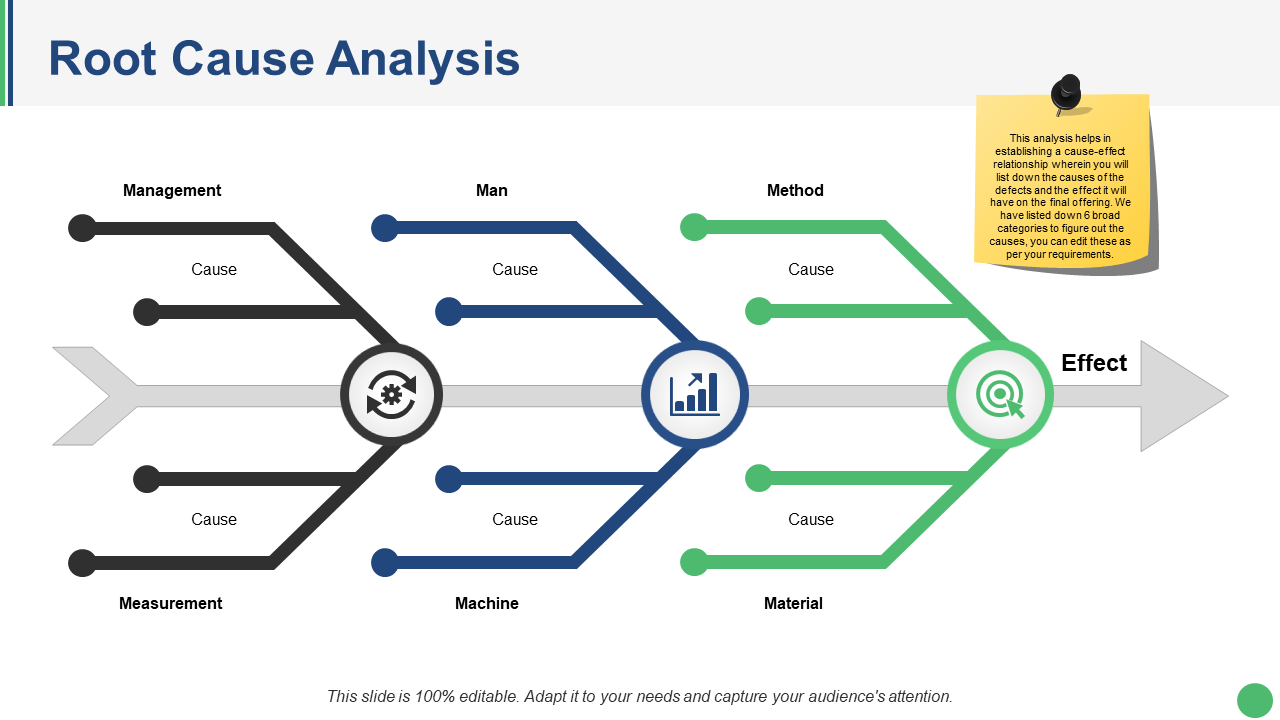
This analysis helps in establishing a cause-effect relationship wherein you can list down the causes of the defects and the effect they will have on the final offering. We have listed down 6 broad categories in the above template to figure out the causes. You can edit these as per your requirements.
- Force Field Analysis:
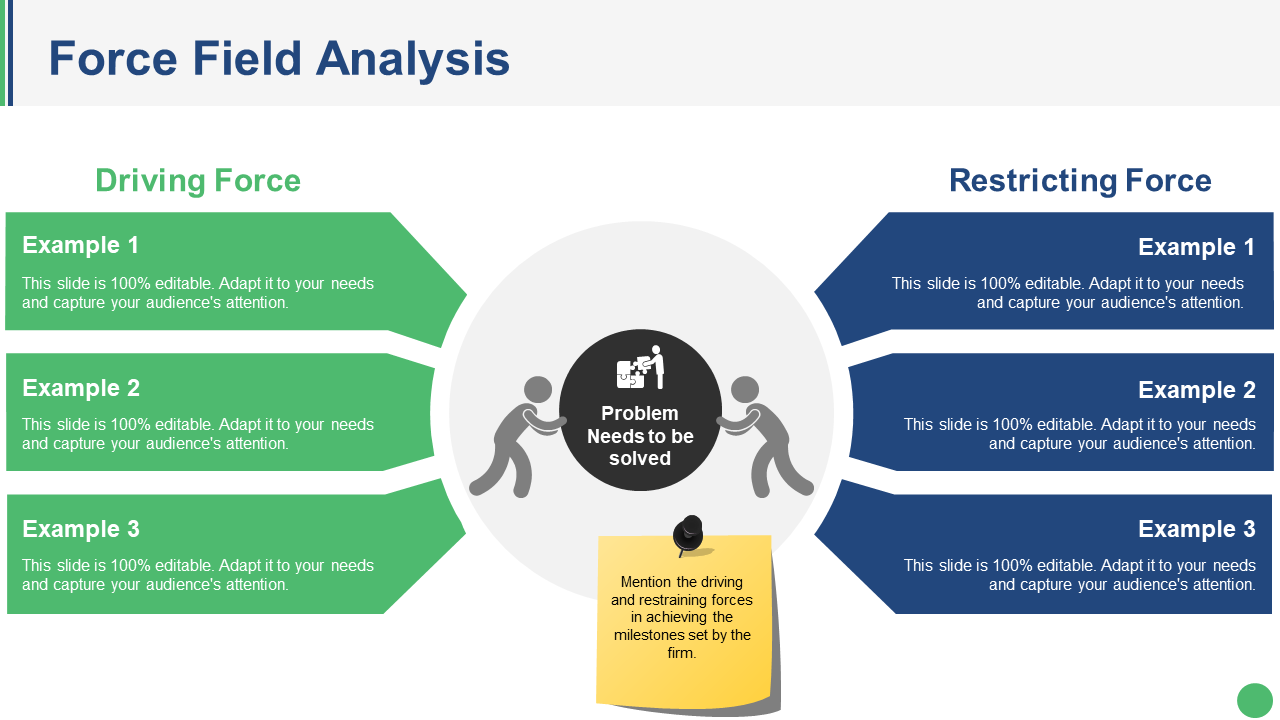
It is technique to identify the forces that help or hinder a change that you want to make. Use the above template to mention the driving and restraining forces in achieving the milestones set by the firm.
- FMEA:
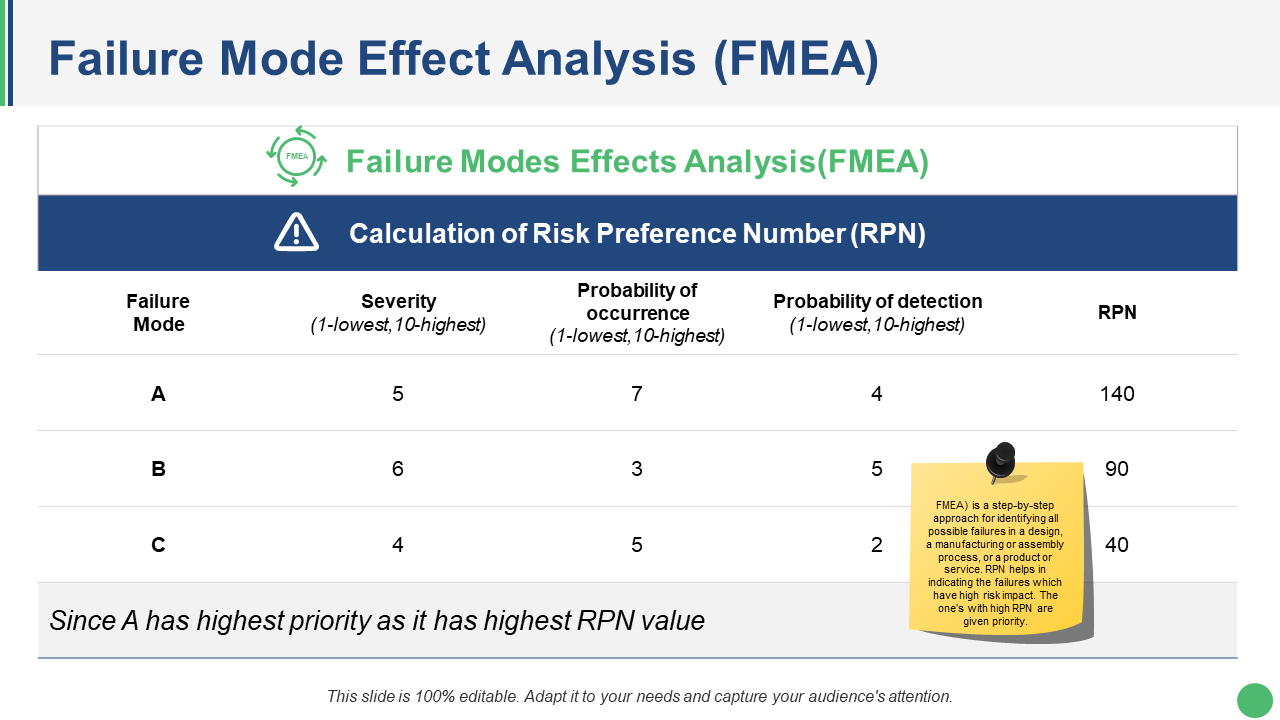
It is a step-by-step approach for identifying all possible failures in a design, a manufacturing or assembly process, or a product or service. RPN (risk preference number) helps in indicating the failures which have high risk impact. The one’s with high RPN are given priority.
- Cost of Quality:
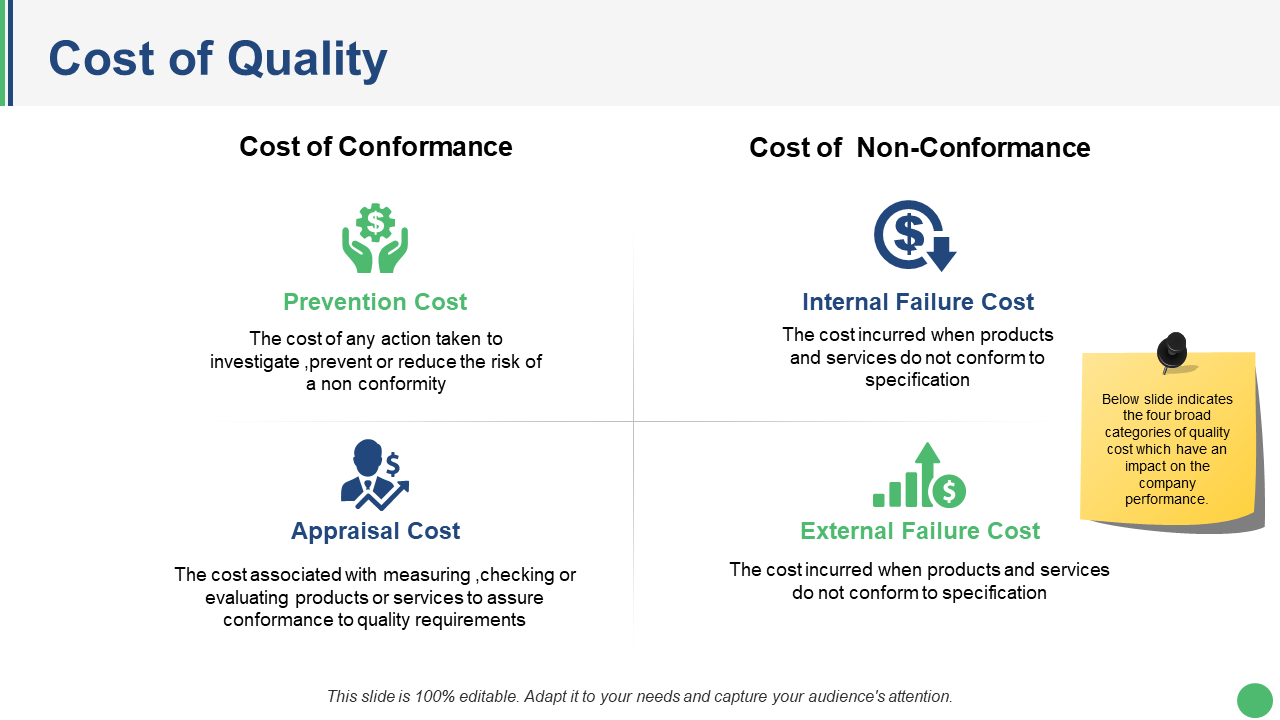
Quality costs are associated with preventing and detecting product issues related to quality. It involves creating and delivering a product that meets the customer’s expectations. Above slide indicates the four broad categories of quality cost which have an impact on the company performance.
- Prevention cost: You sustain prevention cost to keep a quality problem from occurring. It covers proper employee training in assembling products and statistical process control.
- Appraisal cost: This is same as prevention cost. You sustain an appraisal cost to keep a quality problem from occurring. It includes destruction of goods as part of the testing process, supervision of the testing staff and more.
- Internal Failure Cost: The cost incurred when products and services do not conform to specification. It is the case when a defective product is produced.
- External Failure Cost: It is like the internal failure cost, but the only difference is that cost is more extensive due to the cost pf product recalls, warranty claims, field service and more.
- Quality Cost Report:
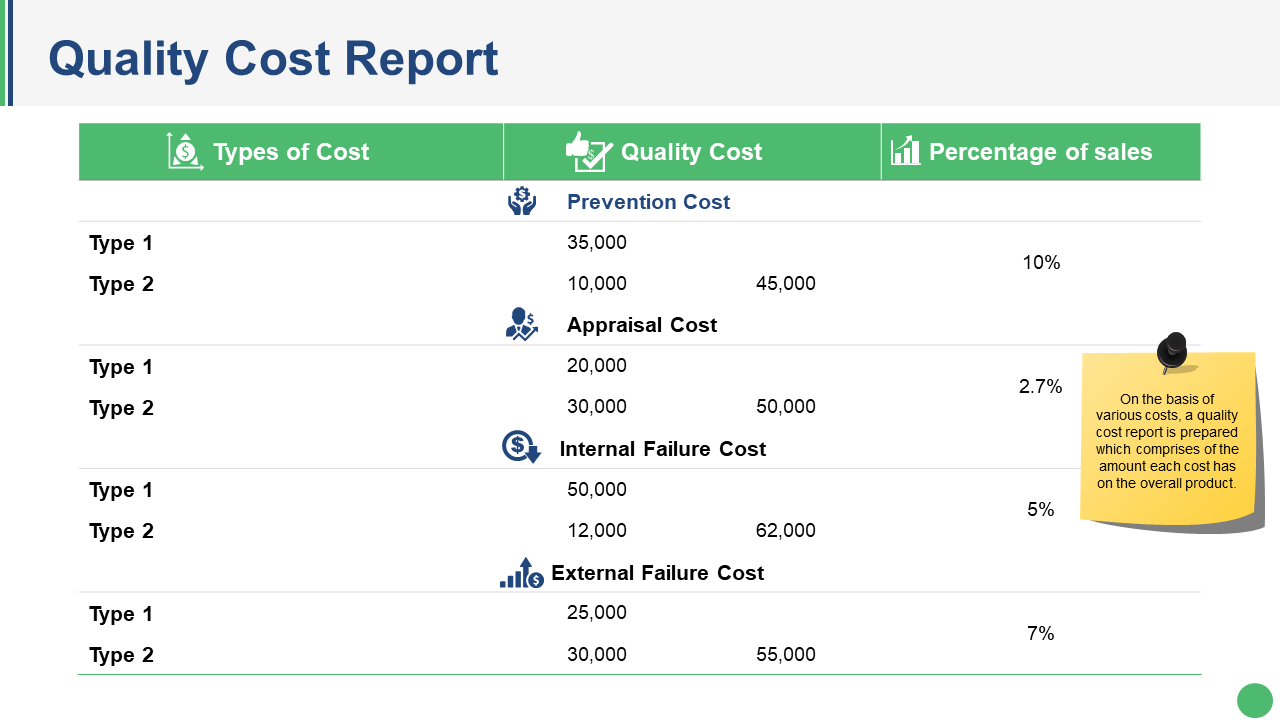
Based on various costs, a quality cost report is prepared which comprises of the amount each cost has on the overall product.
- Quality Control Check Sheet:
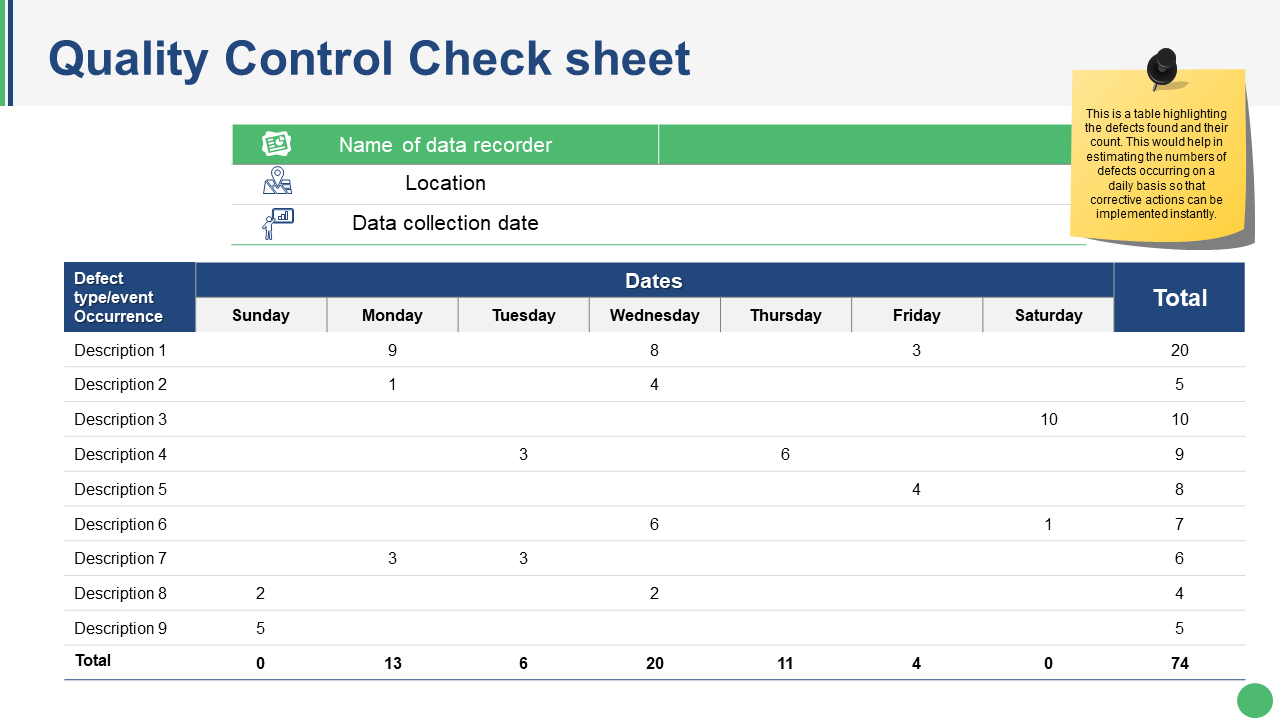
Above is a table showing the defects found and their count. This would help in estimating the numbers of defects occurring daily so that the corrective actions can be implemented instantly.
- Quality Control Chart:
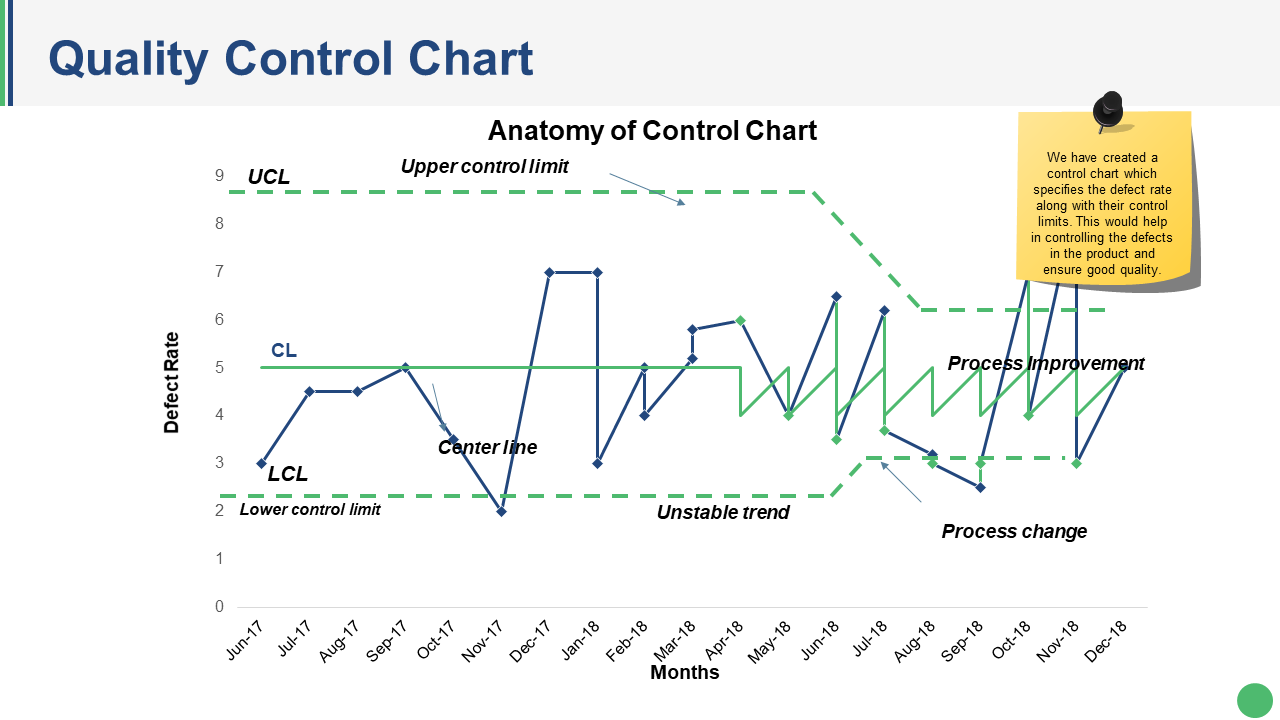
It is a graphical representation that shows whether the products or services are meeting their intended specifications. In case they are not, so to what extent they vary from those specifications. Above chart would help in controlling the defects in the product and ensure good quality.
Download Ready Made Quality Management Complete Deck
Get access to the content ready quality management deck to achieve customer satisfaction.


 Customer Reviews


