The Internet solves every query of an individual. Although most of the queries are resolved by a single search, there are a few topics that have innumerable definitions, leaving the individual in a state of confusion. A similar thing happens in the case of statistics. There are a gazillion statements regarding this term which often baffles us. But, in this blog one can discover a simple meaning to the statistical method. STATISTICS is an easy-to-go technique that gathers and interprets numerical data. In broader terms, the word ‘statistics’ gives a clear picture of data to the business professionals which later can be turned into fool-proof information.
More than 50% of the companies use statistical interpretation to solve crucial problems and make predictions about their organization's health, status, operational efficiency, and several other aspects. Similarly statistics have been used by entrepreneurs for a long time to focus on their present and future data outcomes. The added advantage of statistical methodology is that it gives information about particular data visually. One can easily collect and analyze data through stats (usually known as statistics). Stats help business enthusiasts rock every presentation. Whether it is a director of a renowned business or an employee of a firm, statistics assists all. Want to know how? Just take a look at our below-mentioned 25 ways which are explained via intuitively designed Statistics PowerPoint Templates!
25 Ways to Show Statistics in a Presentation Through Our PowerPoint Templates
Template 1: Social Media Key Statistics
Our professionally designed statistics PowerPoint templates are a must for you to deliver an engaging presentation to the audience. With the aid of this specific slide, you can highlight the key statistics of social media activities. Spectators generally like to see information visually. This statistics PPT template helps you in conveying your message diagrammatically to the audience.
Download Social Media Key Statistics
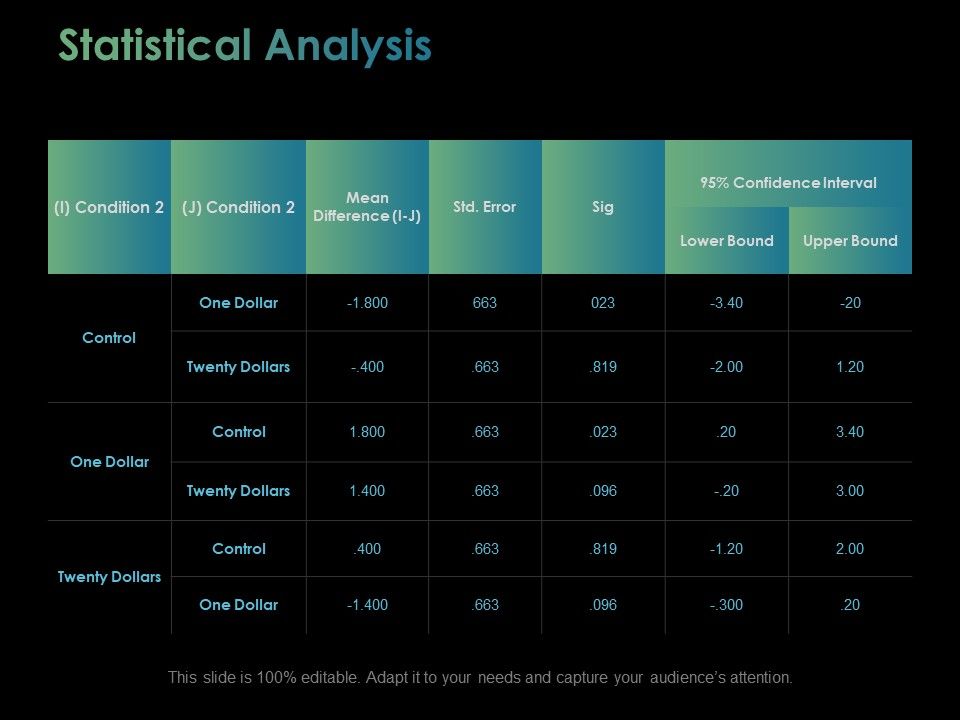
Template 2: Statistical Analysis Control PPT
Incorporate this ready-to-use statistics PowerPoint template to explain your company data to your stakeholders with ease. Take the help of this slide and deliver an outstanding presentation to your senior management team showcasing your previous projects and its desired result.
Download Statistical Analysis Control PPT
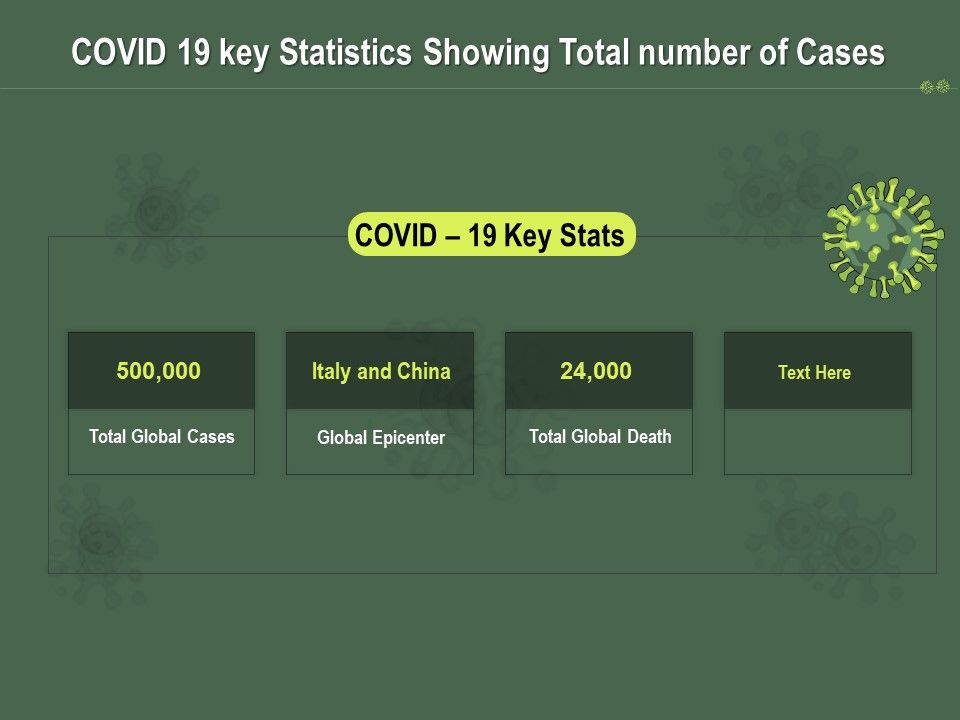
Template 3: COVID 19 Key Statistics
This template can largely be used by medical professionals to display the key stats of COVID-19 cases. You can use the high-grade icons present in this slide to make your presentation more impressive and knowledgeable.
Download COVID 19 Key Statistics
Template 4: Key Statistics Of Customer Mapping Journey
Employ this amazing statistics PowerPoint template to portray the overall experience your customers receive from your proposed services. You can create an outstanding presentation on a customer mapping journey and deliver it to your respective stakeholders.
Download Key Statistics Of Customer Mapping Journey
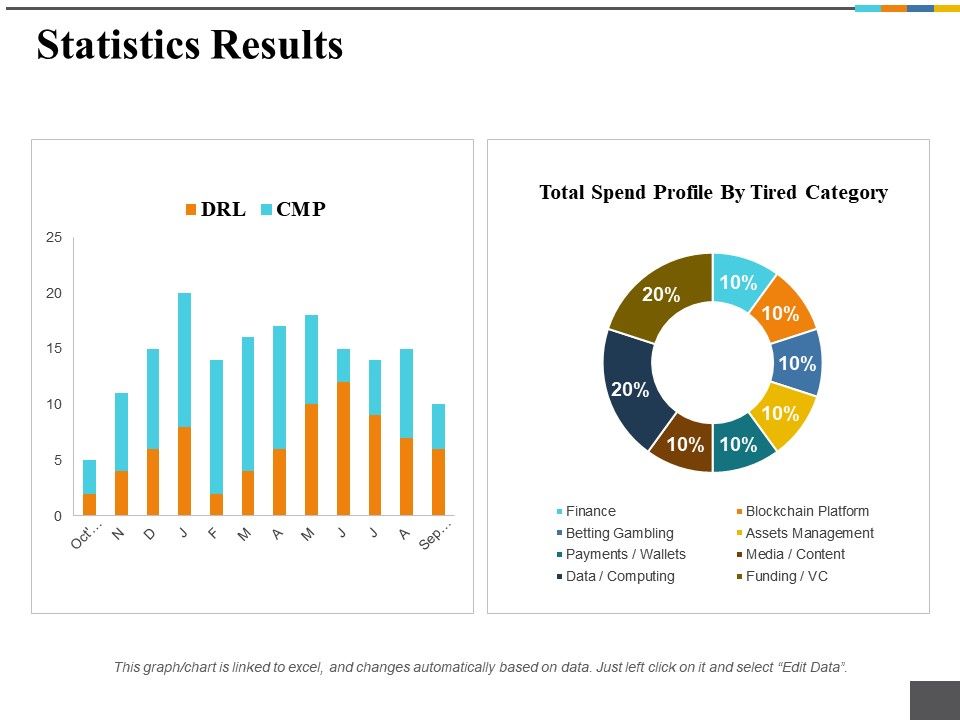
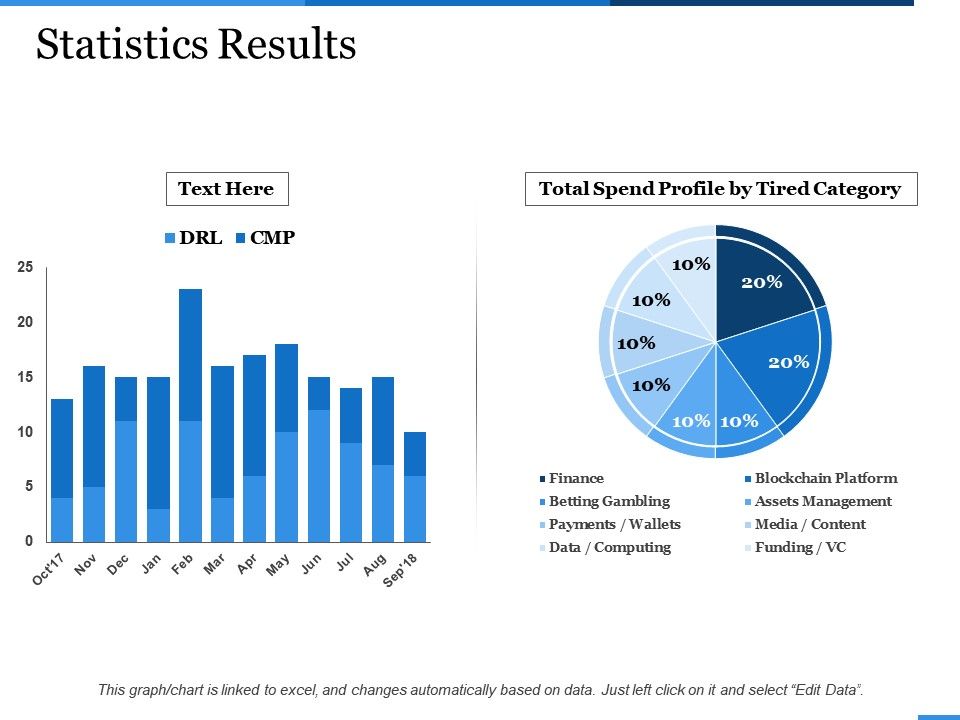
Template 5: Statistics Results PPT
Organizations can easily use this attention-grabbing statistics PowerPoint template to estimate the revenue of different tasks or projects. The slide has good visualization effects which makes your presentation more reliable and understandable. With the graph present in this template, you can show the economic value of various business categories simply.
Download Statistics Results PPT
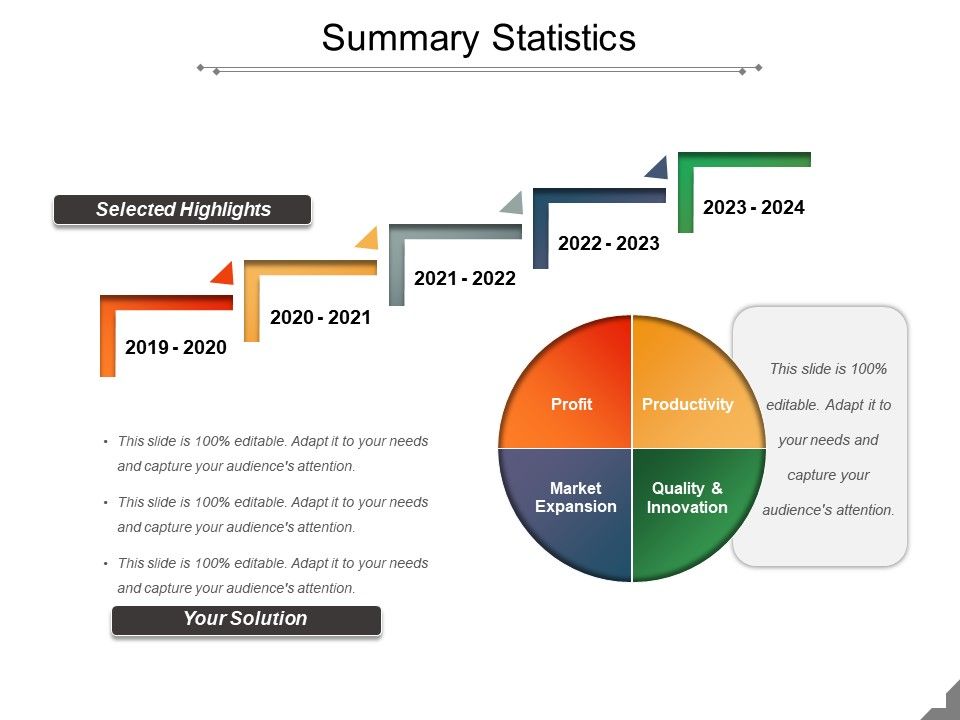
Template 6: Summary Statistics PPT Samples
Illustrate your businesses’ expansion graphically by incorporating our visually-attractive statistics PowerPoint template. In this presentation, you can showcase your growth in the market over the past few years. Use vibrant colors present in this slide to make your presentation more catchy.
Download Summary Statistics PPT Samples
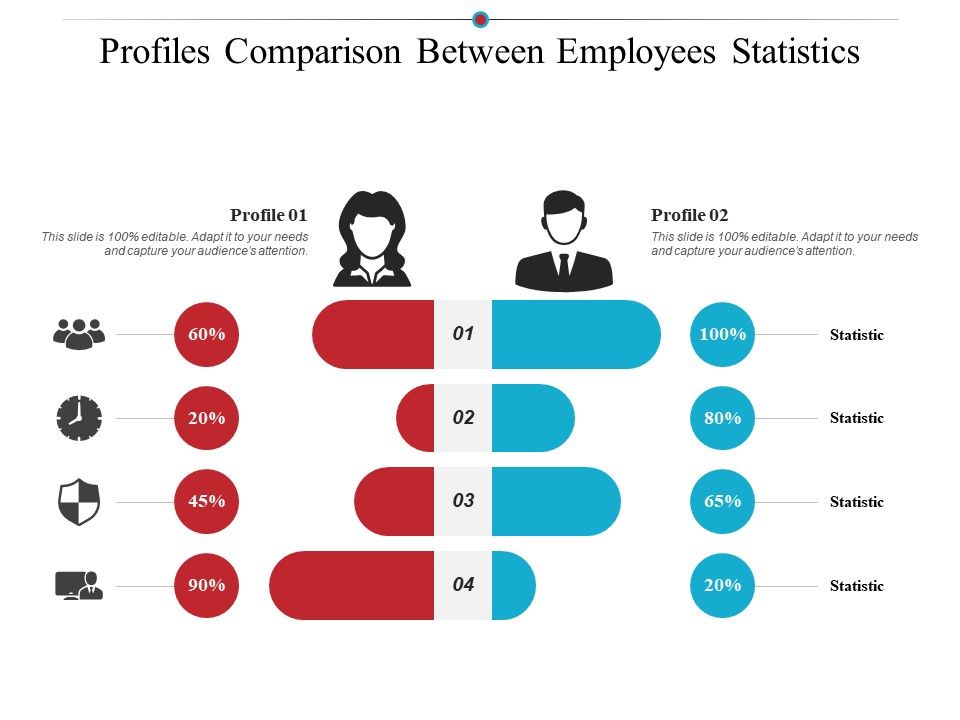
Template 7: Profiles Comparison Between Employees Statistics
While recruiting more candidates for your organization, deliver a presentation to your managers showcasing the total number of female and male employees already present in the workplace. Portray this information with creative icons and graphs that grab the respective authorities’ attention in one go.
Download Profiles Comparison Between Employees Statistics
Template 8: Statistics Results Finance Analysis PPT
This eye-catching statistics PowerPoint template assists you in displaying your financial highlights quickly. The slide comes up with apple space where you can jot down the other statistical analysis you want. Make a compelling presentation and shine before the investors with our easily accessible statistics PPT slide.
Download Statistics Results Finance Analysis PPT
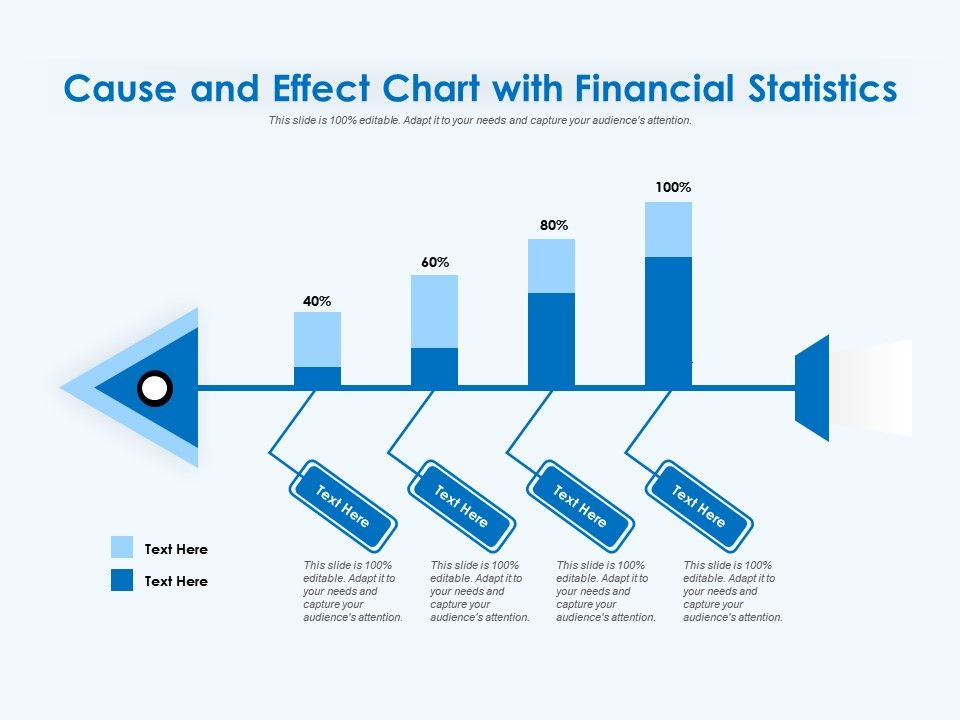
Template 9: Cause And Effect Chart With Financial Statistics
Let your readers know about the prediction of future activities or events through the statistics approach. Use this statistics PowerPoint template to create a detailed presentation on different approaches involved in implementing stats and deliver it to the spectators.
Download Cause And Effect Chart With Financial Statistics
Template 10: Representation Of Data Through Statistics
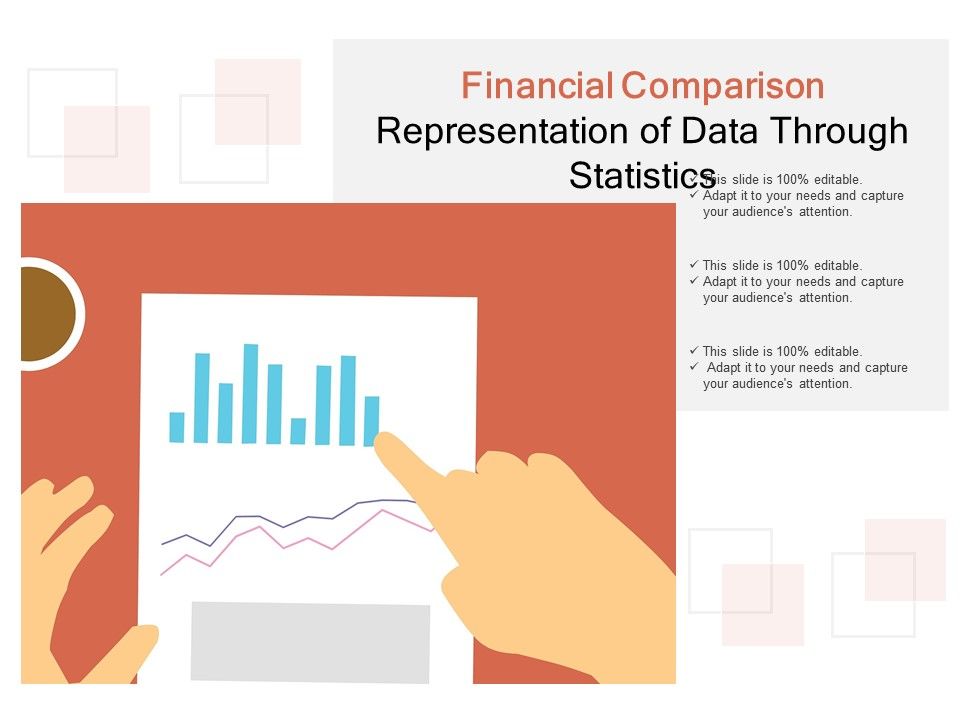
Based on your past project revenue, you can create a statistics presentation highlighting the forecasting you have to make in your upcoming events. Project every detail with utmost clarity with the aid of our creatively designed statistics PowerPoint template.
Download Representation Of Data Through Statistics
Template 11: Bar Chart For Business Statistics
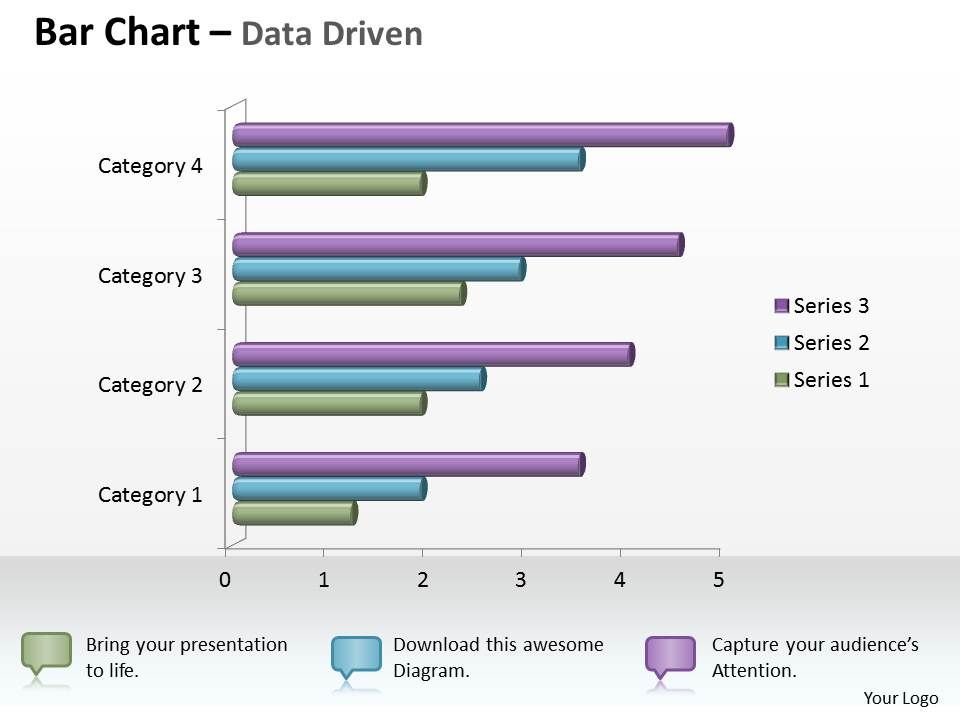
Categorize your information graphically and make readers understand your presentation thoroughly by using this eye-catching statistics PowerPoint template. Use advanced features and highlights present in this slide to make your presentation more engaging.
Download Bar Chart For Business Statistics
Template 12: Global Market Statistics Pie Chart
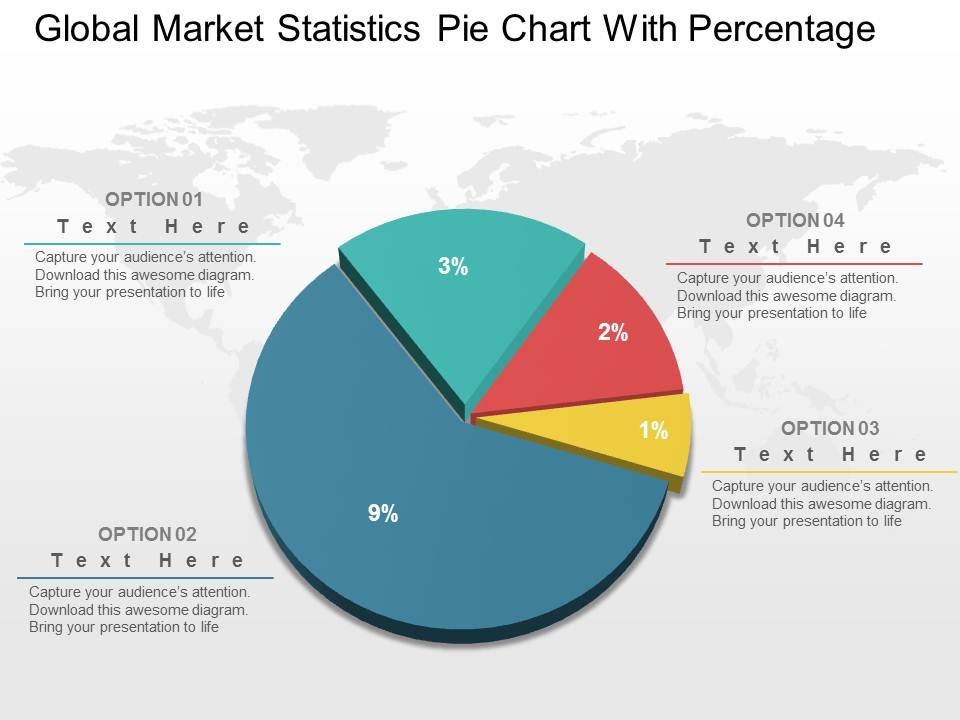
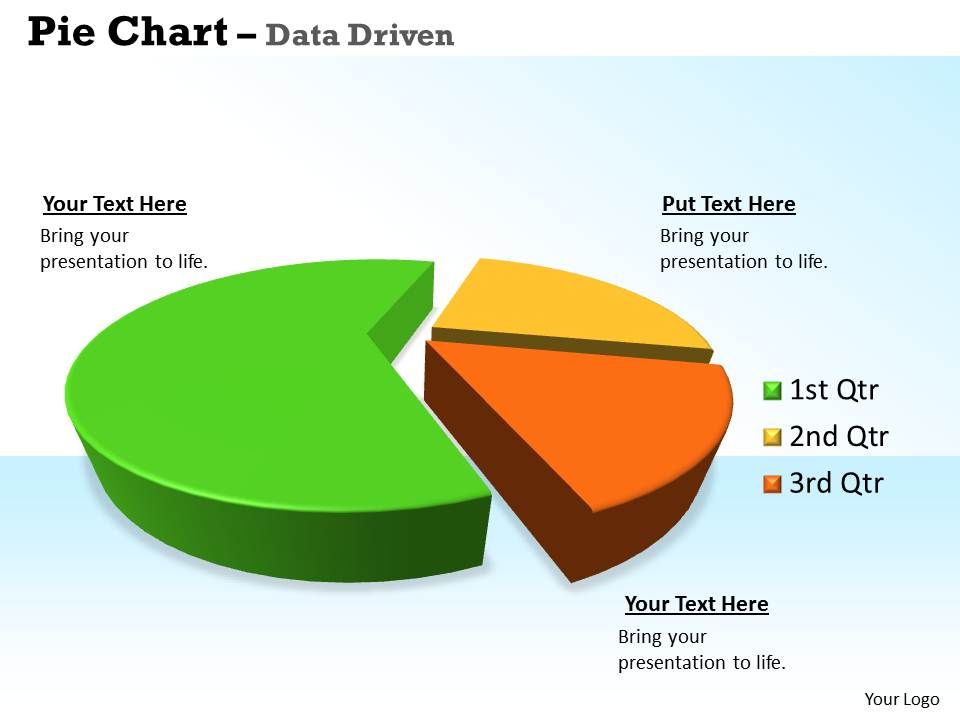
Give your readers a clear idea of how your company is performing globally with a colorful statistics pie chart PowerPoint slide. In your presentation, you can state the percentage of each business segment separately that makes your information even more interesting and valuable.
Download Global Market Statistics Pie Chart
Template 13: Process Improvement Statistics
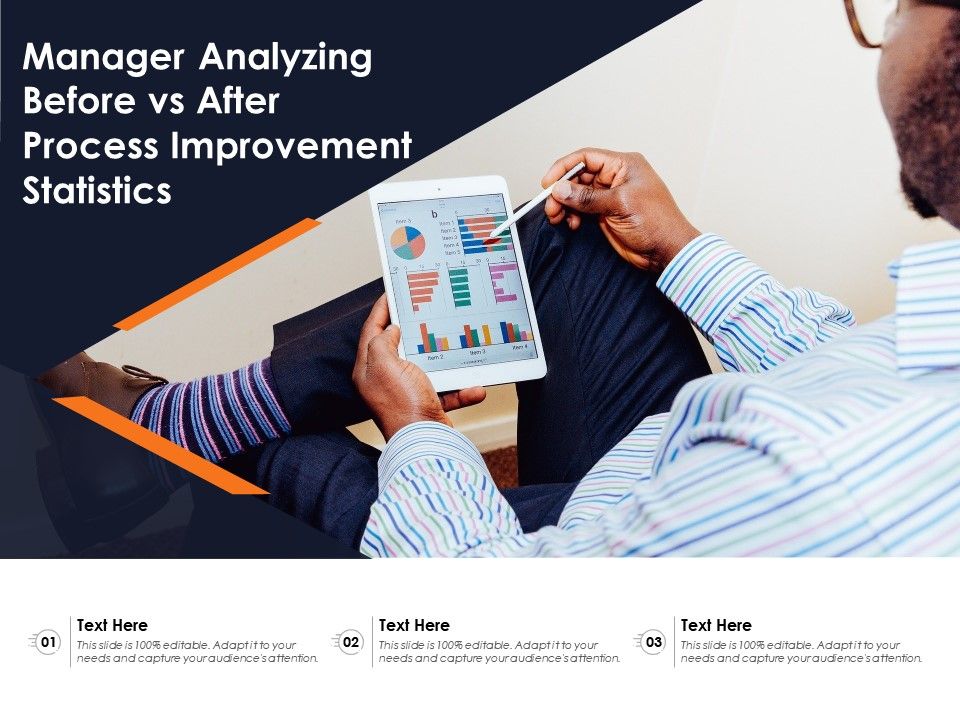
This statistics PPT slide can be used by managers to keep track of previous and current economic trends. The template can also be used in improving the statistics of future business goals or objectives.
Download Process Improvement Statistics
Template 14: Statistics At World Economics Forum
Roughly calculate the stats of your ongoing business project by utilizing this ready-to-use statistics PowerPoint template. Connect the readers to your presentation and make them understand the gist of your stats in the form of information.
Download Statistics At World Economics Forum
Template 15: Interpretation Of Statistics PowerPoint Slides
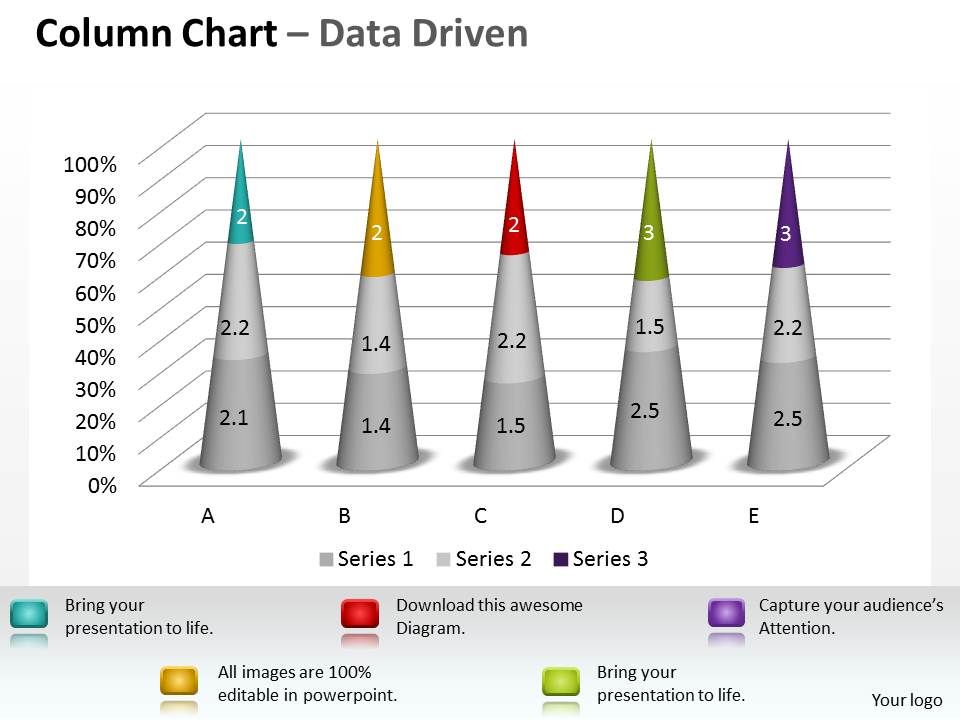
Showcase different categories of data with the discrete bars present in this visually-appealing statistics PowerPoint template. You can give your presentation a unique look by displaying the information in various colors and formats.
Download Interpretation Of Statistics PowerPoint Slides
Template 16: Business Statistics PowerPoint Slides
Hold your clients’ attention by delivering them a compelling presentation that explains the sales of your products in the market. With the aid of this statistics PowerPoint template, you can win over your potential customers effectively.
Download Business Statistics PowerPoint Slides
Template 17: Basis Statistics Decision Making
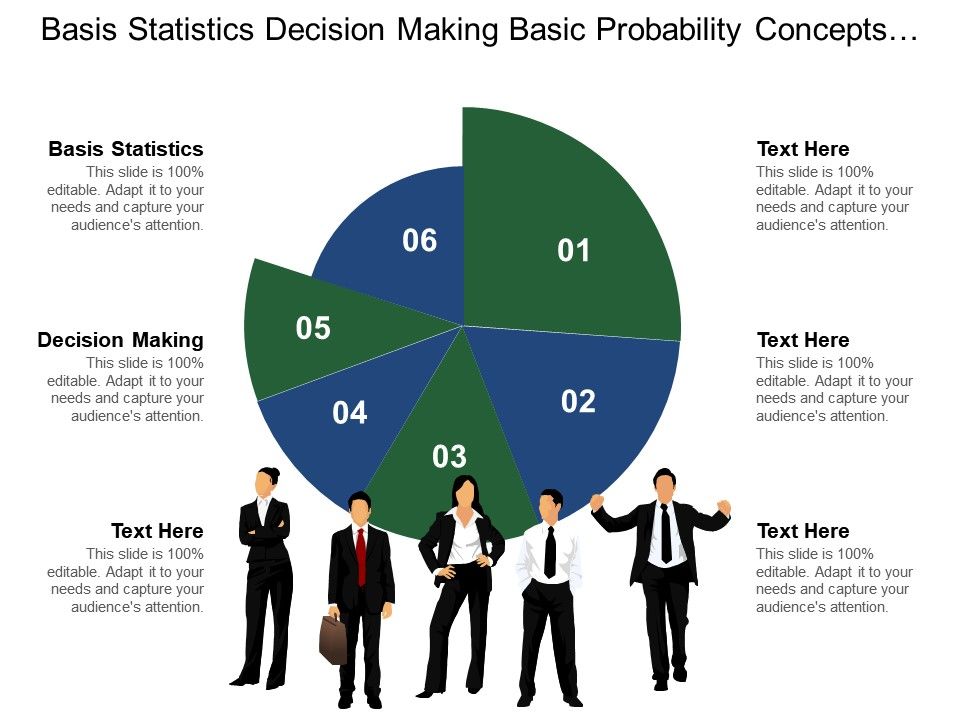
Incorporate this statistics PowerPoint template into your presentation and talk about the basic probability concept that leverages your business. In this spacious template, you can put the logo of your company that brings out the essence of your valued information.
Download Basis Statistics Decision Making
Template 18: Employee Recognition Key Statistics PPT
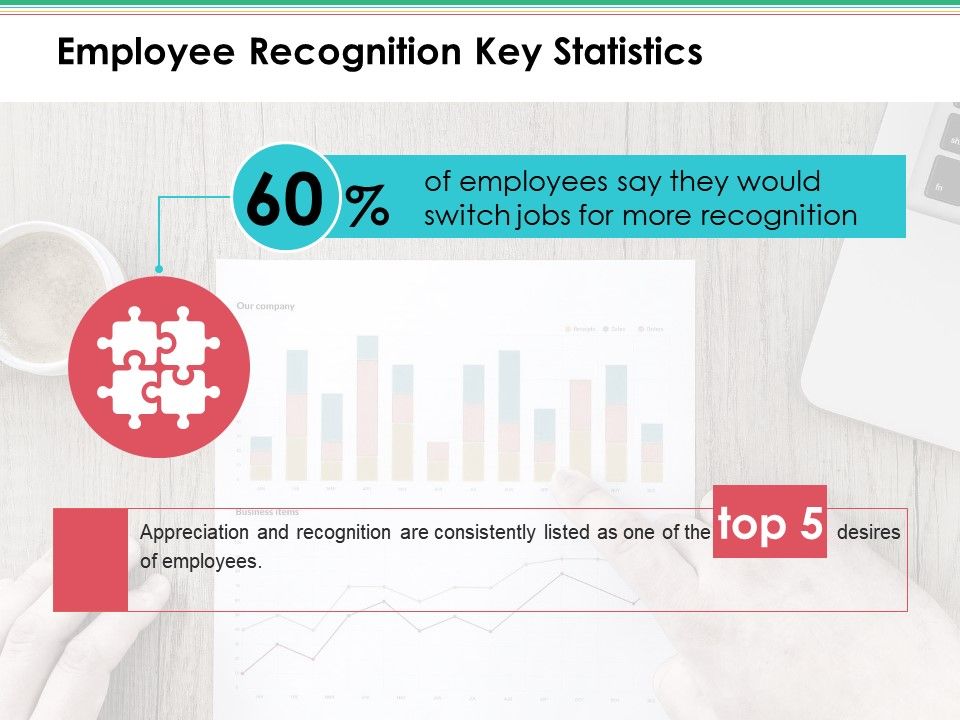
Appreciation and recognition are a must in organizations. So, take advantage of this statistics PowerPoint template to illustrate the number of employees who want to switch their jobs due to lack of attention.
Download Employee Recognition Key Statistics PPT
Template 19: Company profile overview financials and statistics
Showcase a company profile for a big company like Amazon with its key statistics, history, competitor comparisons, revenue, and more with this PPT Deck. Download it now to create an impact on the reader through visual data.
Download company profile overview financials and statistics
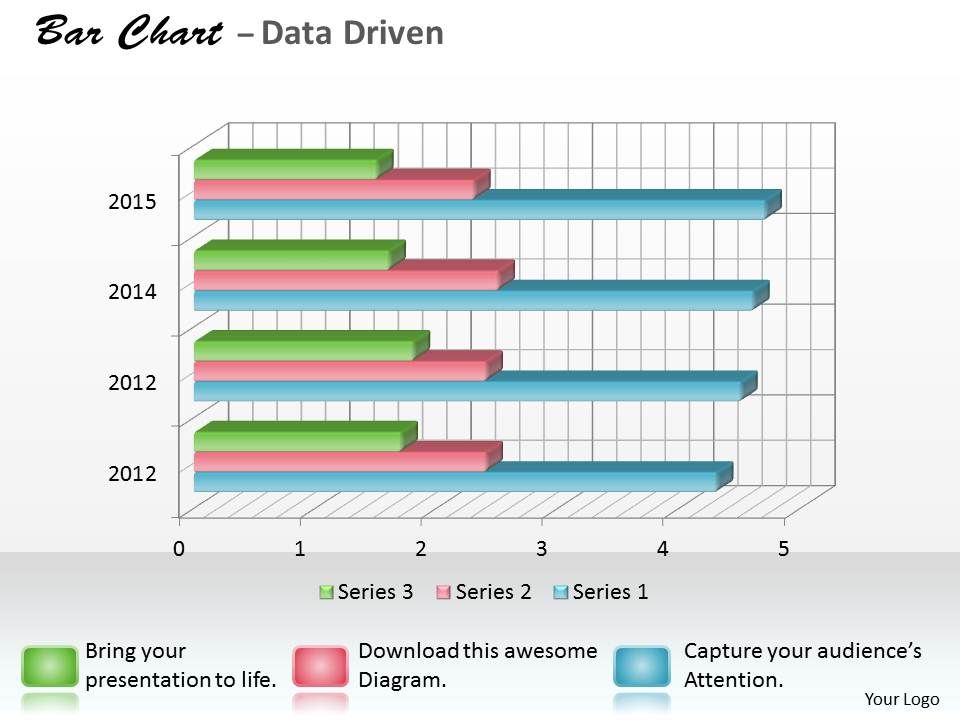
Template 20: Bar Chart For Research In Statistics
This template includes a bar-graph and sheet with which you can showcase your business productivity statistics in your presentation. Use vivid colors and creative fonts and add a modern touch to your full-blown presentation.
Download Bar Chart For Research In Statistics
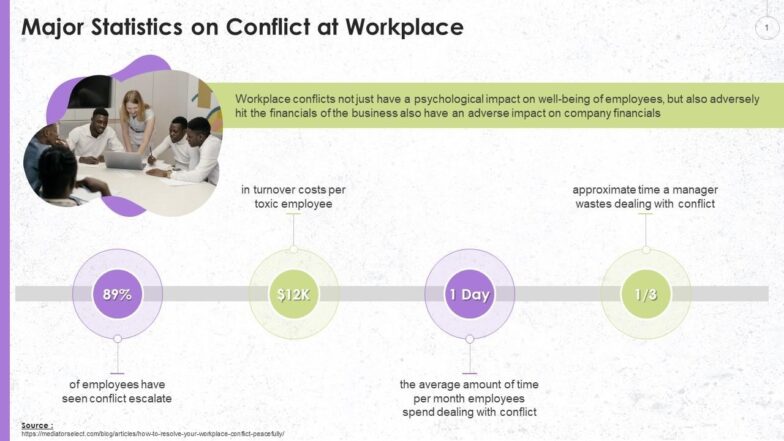
Template 21: Major Statistics On Conflict At Workplace Training Deck
Train your employees on how conflict at the workplace operates and how it can be solved amicably with this PPT Set. Make your presentation attractive and noticeable by using our statistics PowerPoint template.
Download Major Statistics On Conflict At Workplace Training Deck
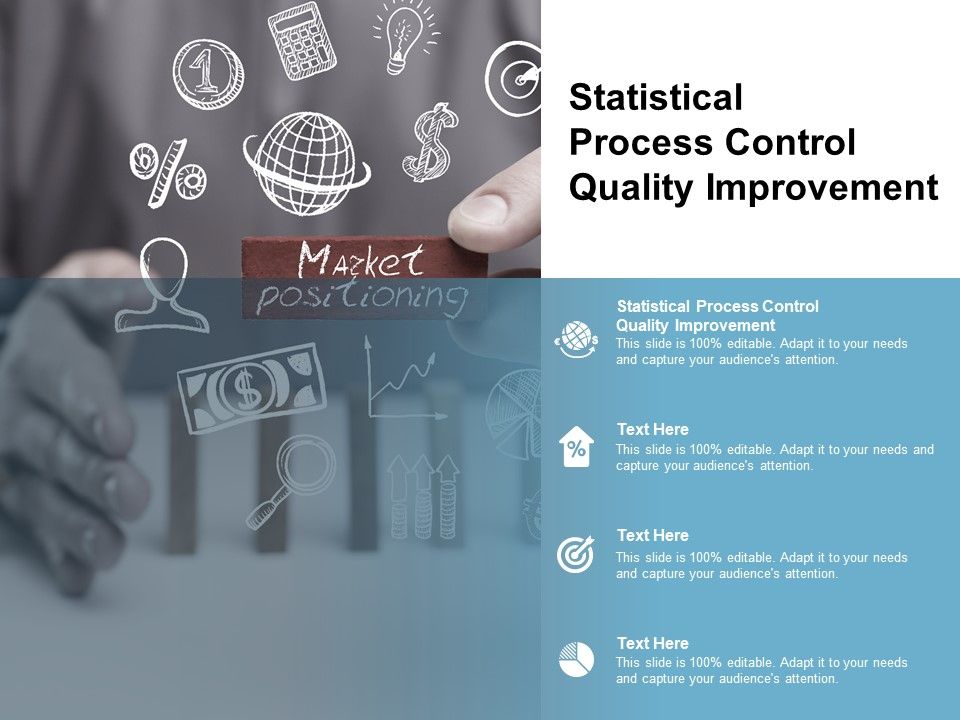
Template 22: Statistical Process Control Quality Improvement PPT
Give an overview of your business stats by employing this beautifully designed PowerPoint slide. With the aid of our statistics PPT slideshow, create a presentation that explains the market positioning of your company.
Download Statistical Process Control Quality Improvement PPT
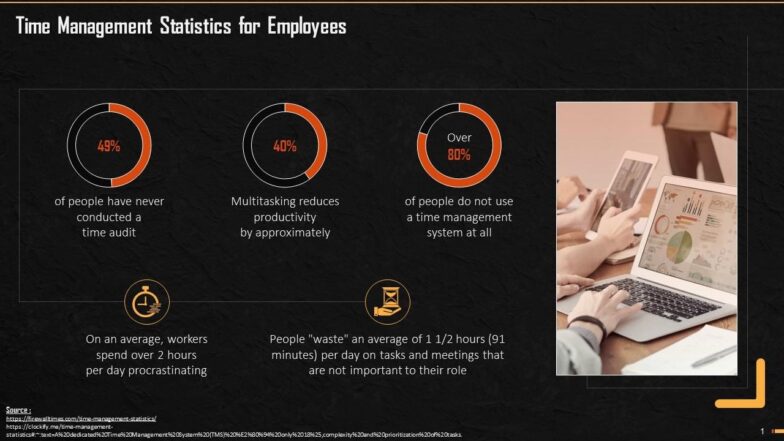
Template 23: Statistics On Time Management And Productivity Training
Understand the math behind how to be better at time management and productivity to be the best worker you can be with this PPT Bundle. The slide is fully customizable. So, you can modify the content and personalize it as per your requirements.
Download Statistics On Time Management And Productivity Training
Template 24: Measurement Plan Statistical Process
Take the assistance of this statistics PPT slide to describe the timeframe your company needs to fulfill the desired project. The template is pre-designed and involves a pyramid-like structure in which you can put the information which needs to be conveyed further.
Download Measurement Plan Statistical Process
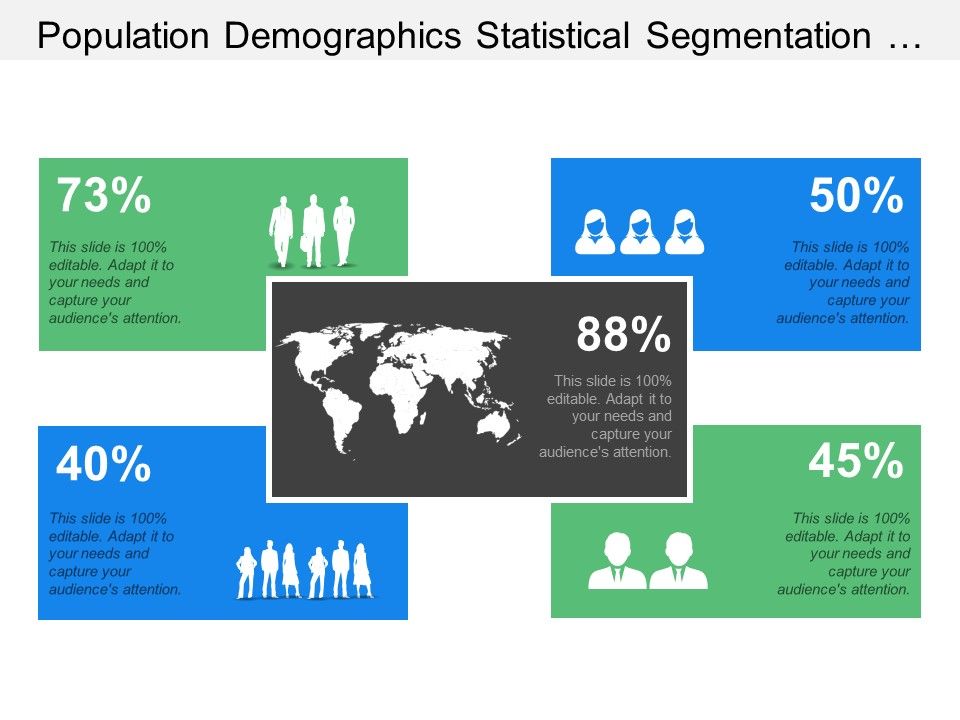
Template 25: Population Demographics Statistical Segmentation
Using this template, you can showcase the stats of the world’s population. In your presentation, keep the demographics colorful and engaging that captures the viewers’ attention quickly. Use lucrative designs present in this slide to make your presentation more enticing.
Download Population Demographics Statistical Segmentation
With the above-mentioned ways, make your presentation descriptive and profound. Just tap on the templates and download them in a single click to make your stats look more captivating!
FAQs
What is statistics and its types?
Statistics is the branch of mathematics that deals with collecting, analyzing, and interpreting data. It provides tools and techniques for summarizing, describing, and making inferences from data. Statistics can be broadly divided into two types: descriptive statistics and inferential statistics.
Descriptive statistics involves methods for summarizing and describing data, including measures of central tendency (such as mean, median, and mode), measures of variability (such as standard deviation and range), and graphical displays (such as histograms and box plots).
Inferential statistics involves using sample data to make inferences or predictions about a larger population. It includes hypothesis testing, which involves testing a claim or hypothesis about a population parameter, and confidence intervals, which provide a range of values within which a population parameter is likely to lie.
What are the 3 types of statistics?
There are generally two main types of statistics: descriptive and inferential. However, some sources may identify a third type, "applied statistics". Here's a brief description of each type:
- Descriptive statistics: Descriptive statistics involves methods for summarizing and describing data. It includes measures of central tendency (such as mean, median, and mode), measures of variability (such as standard deviation and range), and graphical displays (such as histograms and box plots).
- Inferential statistics: Inferential statistics involves using sample data to make inferences or predictions about a larger population. It includes hypothesis testing, which involves testing a claim or hypothesis about a population parameter, and confidence intervals, which provide a range of values within which a population parameter is likely to lie.
- Applied statistics: Applied statistics involves using statistical methods and techniques to solve real-world problems in various fields such as economics, psychology, healthcare, and engineering. It involves applying statistical theory to analyze data and make informed decisions based on the results.
What are the 4 basic elements of statistics?
The four basic elements of statistics are as follows:
- Data: Data are the information or facts that are collected for analysis. Data can be collected through various methods such as surveys, experiments, observations, and interviews.
- Variables: Variables are the characteristics or attributes being measured in the data. They can be classified as categorical (qualitative) or numerical (quantitative). Examples of categorical variables include gender and race, while numerical variables include age and weight.
- Measures of central tendency: Measures of central tendency are used to describe the center of a data distribution. The three commonly used measures of central tendency are the mean, median, and mode.
- Measures of variability: Measures of variability are used to describe the spread or dispersion of data. The two commonly used measures of variability are the range and standard deviation.


![[Updated 2023] 25 Ways to Show Statistics in a Presentation [PowerPoint Templates Included]](https://www.slideteam.net/wp/wp-content/uploads/2020/09/size1001-436-9-1001x436.jpg)


 Customer Reviews






![[Updated 2023] Top 25 Fishbone Diagram PPT Templates To Conduct Root Cause Analysis](https://www.slideteam.net/wp/wp-content/uploads/2020/07/size1001-436-3-335x146.jpg)
![[Updated 2023] Top 20 Balanced Scorecard Templates in PowerPoint PPT for Business Management](https://www.slideteam.net/wp/wp-content/uploads/2020/07/size1001-436-23-335x146.jpg)

![[Updated 2023] Top 15 One-Page Project Management Templates to Make Your Planning Go Smooth!](https://www.slideteam.net/wp/wp-content/uploads/2020/09/size1001-436-2-335x146.jpg)


