“It doesn’t matter whether a company is big or small. Capital structure matters. It always has and always will.” - Michael Milken
A company’s capital structure — primarily, its mixture of equity and debt financing —is a substantial factor in valuing the business. The relative levels of equity and debt have effects on risk and cash flow. In turn, it affects the amount that an investor would be willing to pay for the company or an interest in it. Capital structure can have a severe impact on the return a company earns for its shareholders. It also determines if a firm can survive a recession or depression.
The financial manager should choose a capital structure for the firm that maximizes wealth for the company’s stakeholders as a whole. In order to do that, it is crucial to find the ideal mix of debt and equity. This takes us to another significant concept, Optimal Capital Structure, which is the mix of debt and equity that maximizes a firm’s return on capital, thereby maximizing its value.
In this blog, we will provide you with our top picks of financial management templates that you can use to optimize your firm’s capital structure. These templates result from extensive research and aim to assist you in making financial strategies that can maximize your company’s profit and corporate value.
But before that, let us dive into the basics of capital structure.
An Introduction to Capital Structure
In simple words, the term capital structure refers to the money deployed by the company for its operations and financing its assets. Usually, it is in two forms, i.e., debt and equity capital. Equity capital is raised from ownership shares in a company and claims to its future cash flows and profits. Equity may also come in the form of common stock, preferred stock, or retained earnings. Debt capital in the company’s capital structure refers to the borrowed money that is at work in the business. It’s raised in the form of bond issues or loans. Additionally, short-term debt is also considered to be part of the capital structure. Capital structure is demonstrated as a debt-to-equity or debt-to-capital ratio. A ratio higher than 1.0 signifies that the company is financed more by debt than equity.
In a simple capital structure example, if a firm’s assets come from a $30 million equity issuance and lending that amounts to $70 million, the capital structure can be said to be 30% equity and 70% debt.
Optimal Capital Structure
The basic question is, what is the appropriate or optimum capital structure that a company should follow to achieve the highest profitability? The answer is the proportion of debt and equity that results in the lowest cost to obtain it. This ideal proportion of debt and equity refers to the optimal capital structure. It is the best combination of debt and equity that results in the firm's lowest weighted average cost of capital (WACC). The determination of the optimal capital structure aims to increase the shareholders’ wealth, by maximizing the profit and corporate value. For optimizing the structure, a firm can issue either more debt or equity. The firm may use this newly acquired capital to invest in new assets or to repurchase debt/equity that’s currently outstanding, as a form of recapitalization.
Ready to Use PowerPoint Templates to Download and Incorporate
Here are our hand-picked templates that will help optimize your company's capital structure. These PPT templates are ready-to-use, eliminating all the hassle of creating anything from scratch. Easily modify the slides with the required details, and you are good to go!
Template 1
Taking advantage of this slide, you can showcase the sources of your company's capital structure funding. You can modify the provided table with details of sources of funding and amount. Additionally, you can highlight the share of funding sources in the pre-designed pie chart. Lastly, you can jot down the significant insights taken from the projected data.
Download Source of Capital Structure Funding Template
Template 2
This PowerPoint template will aid you in capturing a financial analysis of your company's capital structure. It presents details of the company's capital structure showing the compositions of the company's financial performance. The financial performance is showcased in terms of levered beta, asset to equity ratio, asset to debt ratio, equity to debt ratio, WACC, percentage of the cost of ownership, and cost of debt.
Download Financial Analysis of the Company’s Capital Structure PPT
Template 3
The below-displayed PowerPoint template is a helpful tool to analyze the debt-equity ratio. This slide highlights the relative proportion of shareholder's equity and debt used to finance a firm's assets. You can easily modify the provided table with your company's debt and equity capital details. Also, you can jot down the key points related to the slide in the note section for readers' further assistance.
Download Analyzing Debt Equity Ratio PPT Slide
Template 4
This slide will assist you in capturing the present situation of your company's debt situation. You can provide the debt structure of your company by adding the various debts in the particulars section. Further, you can add the amount of debt for two consecutive years. This slide will also be helpful to compare the current debt situation of the company with the last year. Which, in turn, will be valuable to gather insights into your business performance.
Download Present Debt Situation of Company PowerPoint Template
Template 5
Analyzing the current equity situation of your company will become easy with this PPT slide. Similar to the previous slide, you can highlight the equity structure of your company in this template for two consecutive years. By doing so, you can compare your company's previous year's equity structure to that of the current year.
Download Current Equity Situation of Firm Slide
Template 6
Financial leverage denotes the reliability of a business on its debts to run its operations. Calculating the financial leverage is essential to determine a business's financial solvency and its dependency upon its borrowings. The below-showcased PPT slide will arm you in calculating the financial leverage of your company. You can mention the details for earnings before interest and tax, profit before tax for the period of five years. Further, you can jot down the ratio of the company's financial leverage. Additionally, use the finely-crafted graph to project the financial leverage of various years. Also, you can highlight keynotes of the projected data in the next section of this PPT slide.
Download Analyzing Financial Leverage of Firm PPT Slide
Template 7
This slide is a nifty tool to determine the pattern of the cost of equity vs. debt. Incorporating this template, on one side, you can highlight the cost of equity, and on another part, you can showcase details for the cost of debt. Lastly, you can mention the inferences about the patterns of the cost of equity vs. debt in the next section. For instance, the sample data provided in this slide represents that the firm is experiencing a decrease in the cost of equity as the firm's value is decreasing.
Download Cost of Equity vs Debt PPT Template
Template 8
The template provides sample data for an over-leveraged firm looking to shift to an optimal debt ratio with a minimum cost of capital. This PPT slide summarizes the costs of debt, equity, projected firm value, stock prices, etc. values on different debt ratios. Taking the assistance of this template, you can modify the values with your company-specific statistics for estimating the optimal debt ratio.
Download Estimating Optimal Debt Ratio Template
Template 9
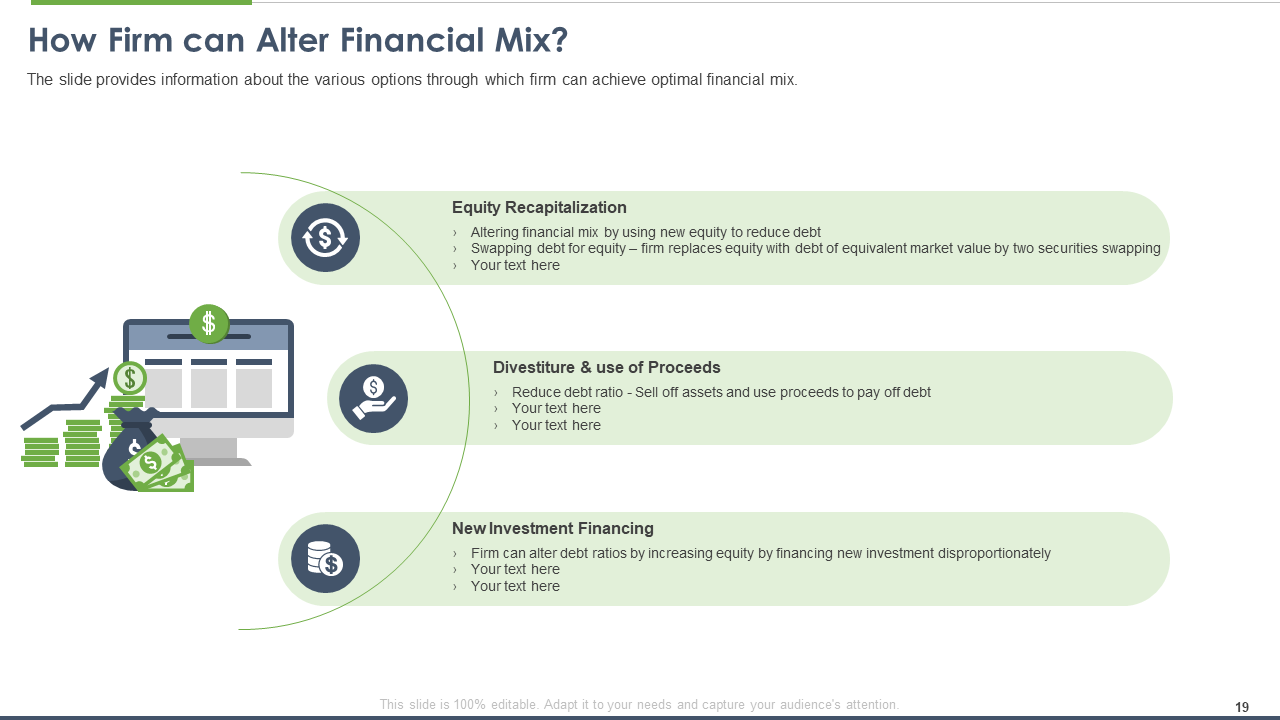
This PPT slide is resourceful in providing readers with the various options through which a firm can achieve an optimal financial mix. The multiple options to alter the financial mix covered in this side are, Equity Recapitalization, Divestiture & use of Proceeds, and New Investment Financing. The stylish and modern layout of this slide makes it visually appealing.
Download Ways to Alter Financial Mix PowerPoint Template
Template 10
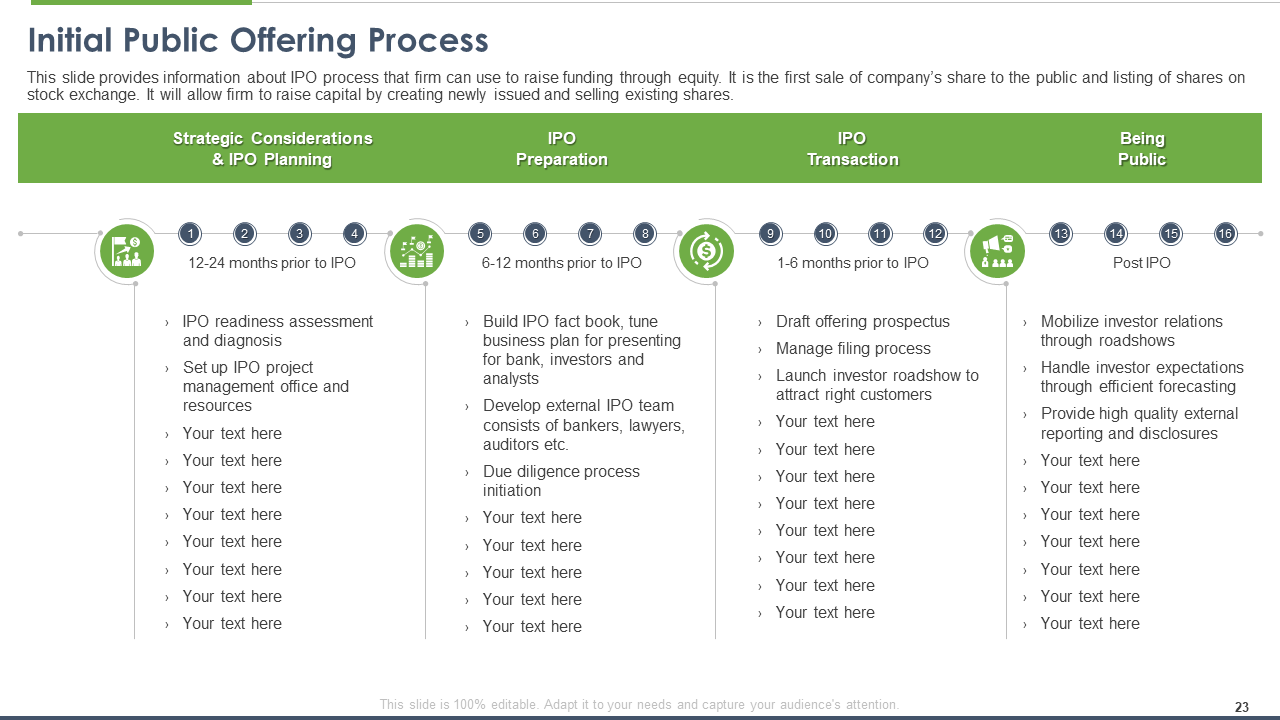
An initial public offering (IPO) represents the process of offering shares of a private corporation to the public in a new stock issuance. Public share issuance enables the company to acquire capital from public investors. This PPT template gives information about the IPO process that the company can use to raise funding through equity. Incorporating this slide, you can take reference and further modify the text values to set the IPO process for your company.
Download Initial Public Offering Process Template
Template 11
The following slide showcases details about the leveraged buyout process to raise equity funding. It is how a company can reduce its outstanding debt and significantly increase equity returns. This bar graph covered in this PPT template signifies the use of debt in a leveraged buyout transaction. In addition to that, it showcases how this process significantly increases the equity returns.
Download Leveraged Buyout Process to Raise Equity Funding PPT
Template 12
The slide is useful to determine the relation between net debt and asset trends. The data covered in this template showcases that the netblock is increasing whereas the debt is decreasing. Therefore, the new assets added to the system are being financed through equity and internal financing. Downloading upon this slide, you can easily modify the graph and key results section to cater to your requirements.
Download Impact on Debt PPT Template
Template 13
The below-displayed PPT template captures the equity distribution of a company and analyzes the value of equity issued to equity subscribed for a year. It determines the entire shares which are published and subscribed. Further, it covers the critical points taken that are deduced from the showcased data.
Download Impact on Firm Equity Pattern Template
Template 14
In the previous slides, we have explained how the company has taken initiatives to optimize its capital structure. This slide showcases the achievement of the optimal debt equity mix in the company. It covers a pre-developed table with five columns. It covers Debt-Equity Mix, Cost of Debt %, Cost of Debt %, and Composite cost of Capital % for four quarters. The sample data covered in this slide determines how the firm will gradually reach the optimal financial mix of debt and equity to incur a minimum cost of capital in the next year. The firm will have the lowest cost of capital with 19% debt and 81% equity.
Download Achieving Optimal Debt Equity Mix Slide
Template 15
This slide aims to analyze the firm's financial performance with the help of a balance sheet statement. This template provides a glimpse of the firm's balance sheet with information about assets, liabilities, and shareholder's equity for the current year. Companies can also make use of this pre-developed accounting tool to ease their work and, in turn, smoothen the work processes of their company.
Download Balance Sheet Statement PPT Template
In Conclusion
Needless to say, that the companies that have survived all times focus on the highest or maximum profits. Meanwhile, if the companies are not profit-oriented, they get crushed by the better efficient companies. Download this deck to help your organization optimize debt ratio to maximize firm value and reduce the cost of capital. These PPT templates will also be handy for the chief financial officer to analyze and present the company's financial performance to higher-level management.


 Customer Reviews


![[Updated 2023] Top 10 Ratio Analysis Templates to Gauge Financial Performance](https://www.slideteam.net/wp/wp-content/uploads/2021/05/Top-10-Ratio-Analysis-Templates-to-Gauge-Financial-Performance-493x215.png)


