Showcase processes using amazing Circular Flow Charts templates. Not only do they look creative, they also add credibility to the information you are providing to your audience. You can incorporate a Circular Flow Chart to show comparison, process, results, data, and sales of your company. You can use them to show your business strategy, ideas, or any other piece of information. Circular Flow Charts PowerPoint slides look innovative and make complicated things simpler for audience to interpret.
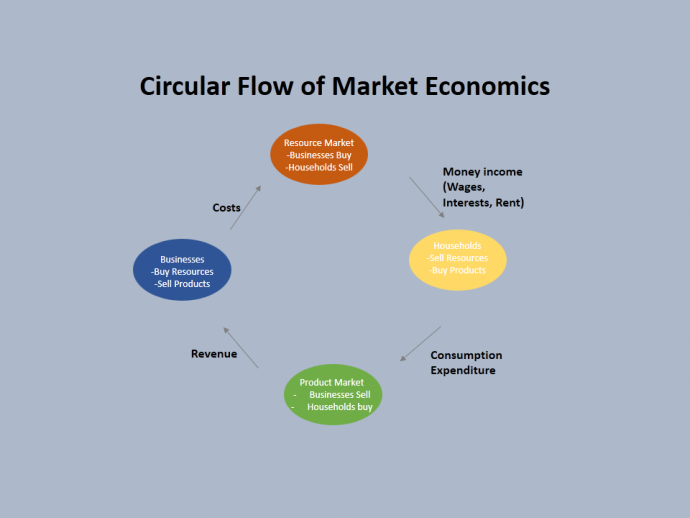
Presenting processes can be a very tiring job. It demands your precious time, energy and mind. Worst is when you bug your boss and clients with your boring presentations. Fault is not in you, the problem is ugly diagrams that you are using. Look at the below image.
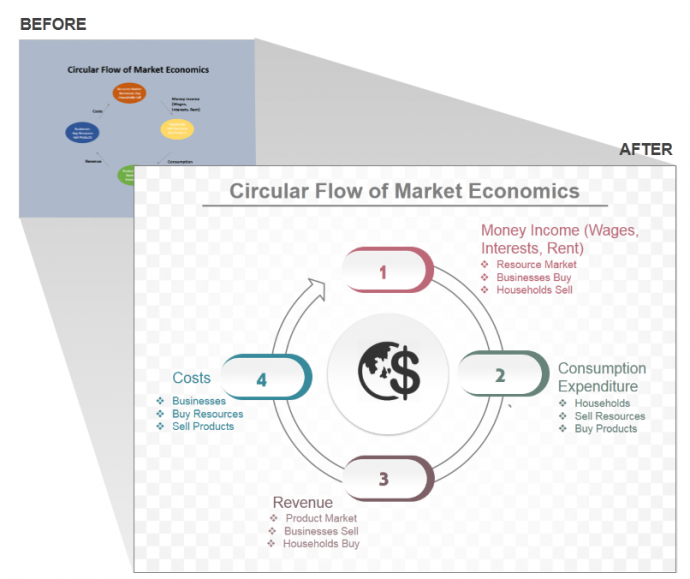
Too ugly, right? The background color, arrows, texts, everything is just wrong with this diagram. Now again, take a look at the below image:
It is clearly evident why you have been unsuccessful till now in grabbing your audience’s attention. Since we have shown you the right and better way of incorporating a Circular Flow Chart in the presentation, let’s us also help you create one.
Steps to Create a Circular Flow Chart Template:
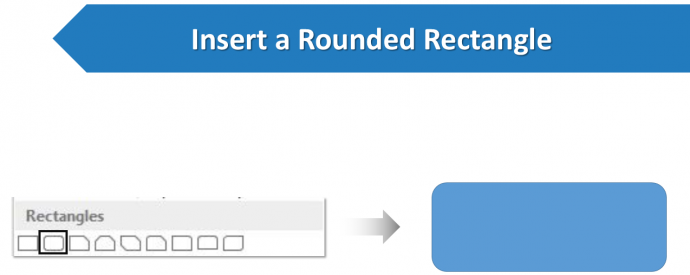
- Insert a Rounded Rectangle from the Shapes menu (under the Format tab). Go to INSERT> SHAPES> RECTANGLES> ROUNDED RECTANGLE.
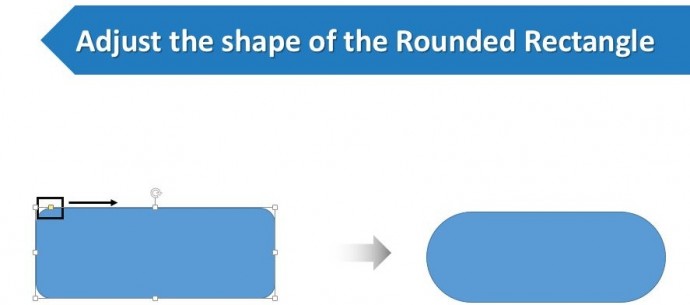
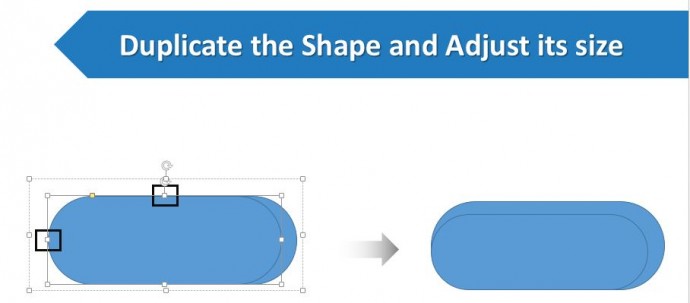
- Adjust the shape of the Rounded Rectangle with the help of yellow handle. (See the below image).
- Once the shape of the Rounded Rectangle is adjusted, duplicate the shape and place the second Rounded Rectangle inside the original Rounded Rectangle. (See the below image).
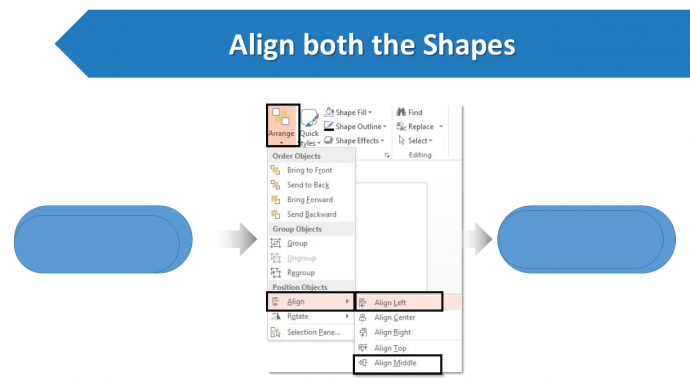
- Align both the shapes. Select the outer Rounded Rectangle first and then the inner one, Go to ARRANGE> ALIGN> ALIGN LEFT> ALIGN MIDDLE.
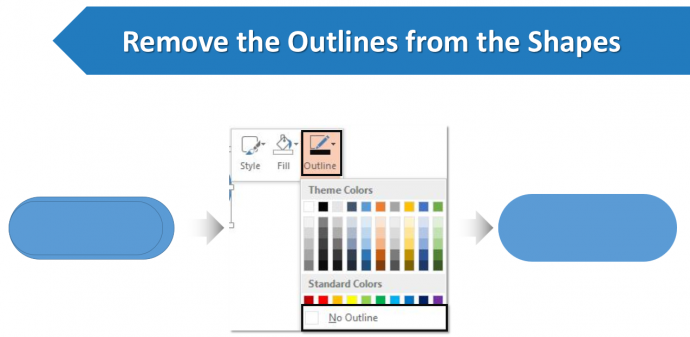
- Remove the outlines from both the shapes. Right click both the shapes> OUTLINE> NO OUTLINE.
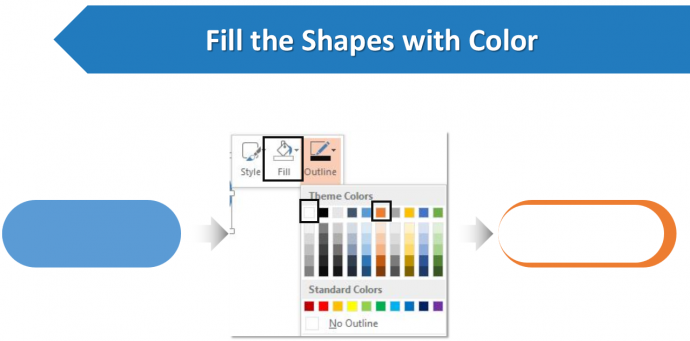
- Select the outer Rounded Rectangle and fill it with color of your choice. Fill the inner Rounded Rectangle with white color. To do so, right click the shapes> FILL> COLOR OF YOUR CHOICE.
To complete the Circular Flow Chart, let’s learn to create a Circular Arrow:
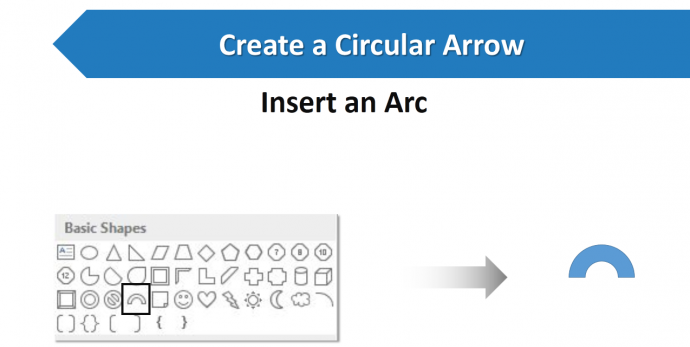
- Insert an Arc shape. Go to INSERT> SHAPES> BASIC SHAPES> ARC.
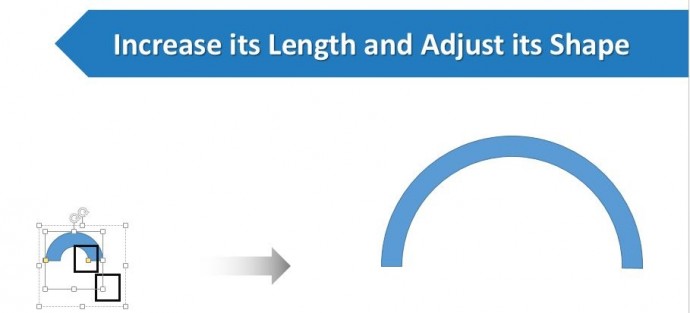
- Increase the length of the Arc shape. Adjust its shape with the help of yellow handle. (See the below image).
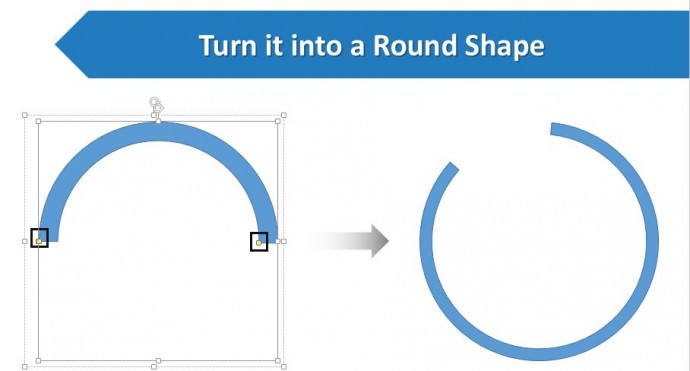
- Turn it into the rounded shape by using the cursor.
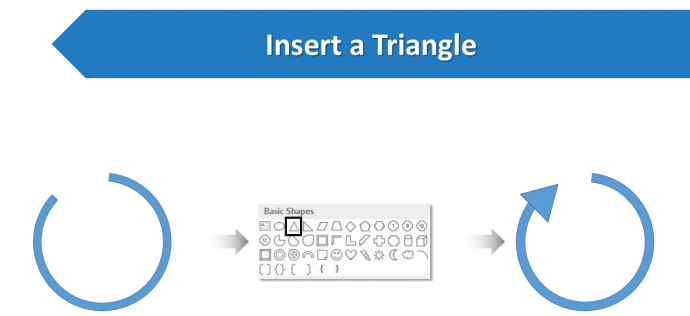
- Insert a Triangle and place it over the one end of the Arc Shaped Circular Arrow. Go to INSERT> SHAPES> BASIC SHAPES> TRIANGLE.
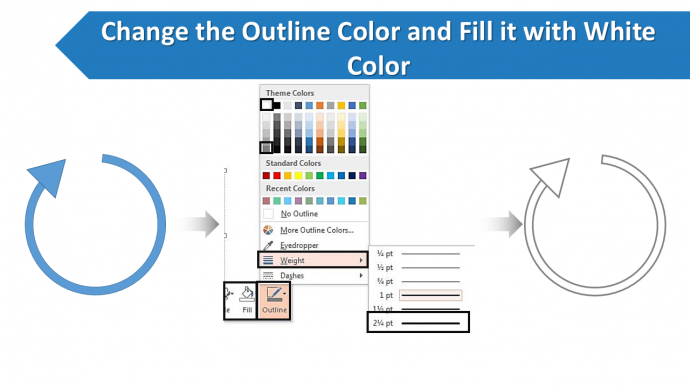
- Right click both the shapes. Change the color of the OUTLINE> PICK YOUR COLOR> WEIGHT> 2.5 Point. Go to FILL> WHITE COLOR.
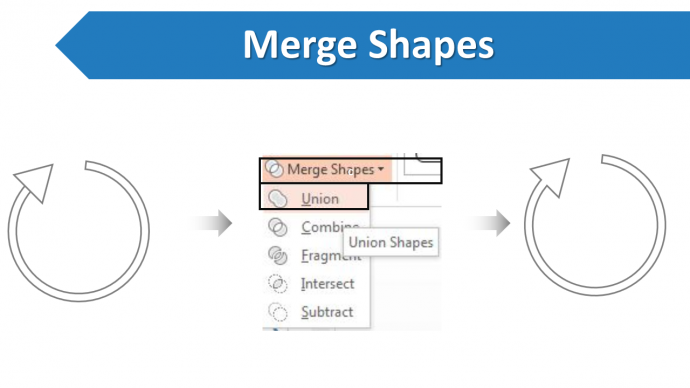
- Select both the SHAPES> FORMAT> MERGE SHAPES> UNION.
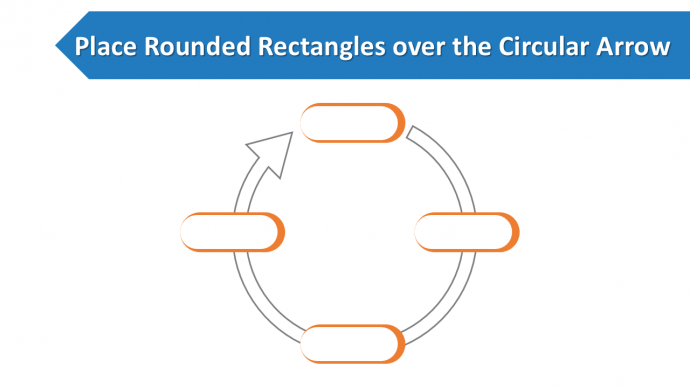
Place the Rounded Rectangles that you have created earlier over the Circular Arrows.
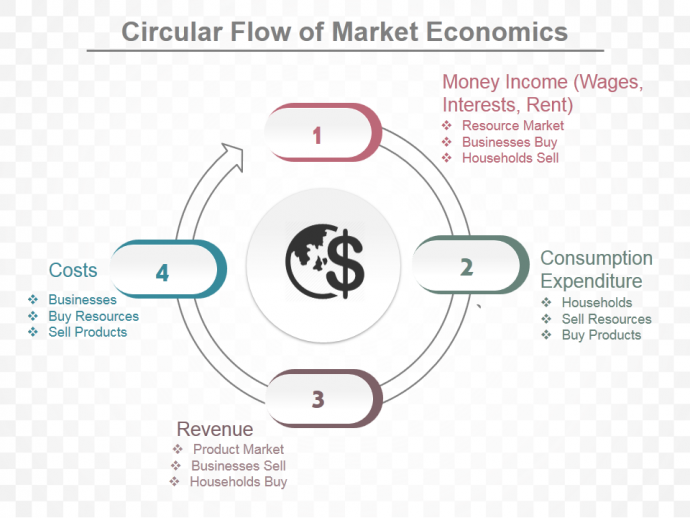
Above is an innovatively designed Circular Flow Chart which is creative, eye catchy and makes it so easier to explain any kind of process.
Download this awesome Circular Flow Chart PowerPoint template, add your content and set the right impression on your audience.
Let us show you how you can explain the Business Processes or any other process for that matter in a creative and stylish manner. Take a look at the below examples:
Business Processes That Can be Depicted Via Circular Flow Diagrams
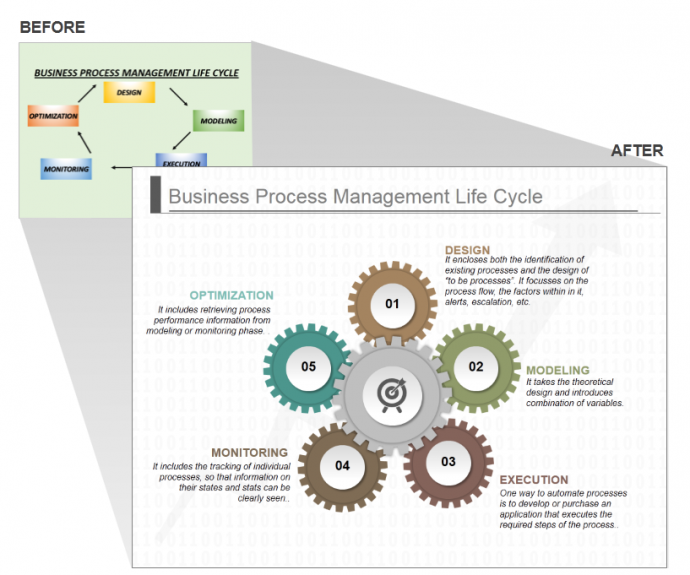
Example 1: Business Process Management Life Cycle
You can clearly see the difference between the two images. In the BEFORE image, the background color doesn’t go well with the business presentation. Arrows are not aligned properly. On the other hand, the AFTER image is professionally designed. From color combination to the design, everything is in place and proficient.
Download this awesome diagram by clicking here.
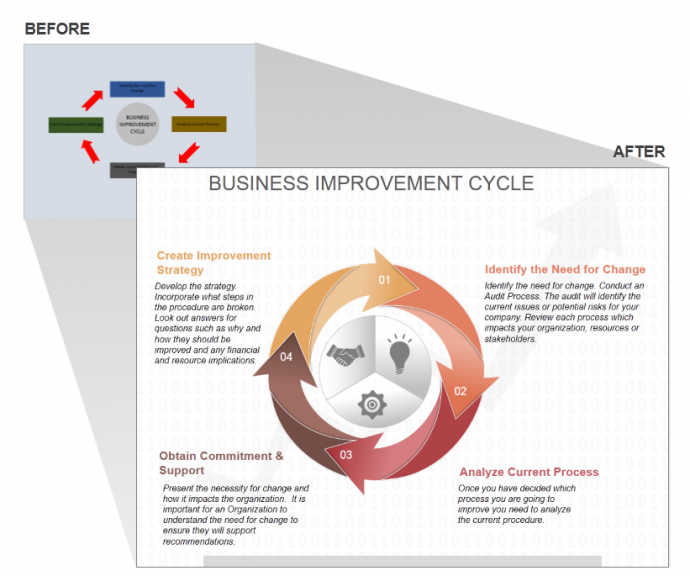
Example 2: Business Improvement Cycle
The BEFORE image looks gaudy because of the choice of color of the boxes and arrows. Look at its alternate. It is well organized. The arrows are properly aligned along with the icons. You can incorporate your text and explain it in a simple manner. The AFTER image looks visually appealing.
Click here to download this creative Circular Flow Chart PowerPoint diagram.
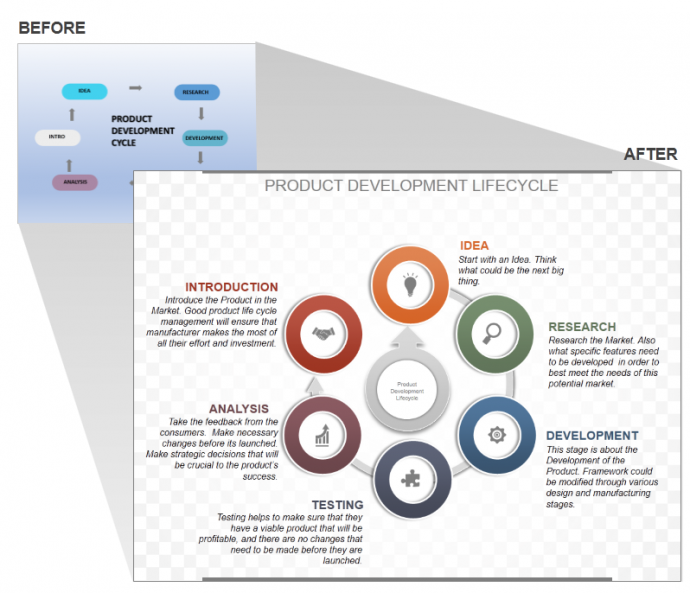
Example 3: Product Development Life-cycle
Again, the background color of the BEFORE image does not go along when it comes to a business presentation. Colors of the boxes are too bright. Boxes and arrows are not aligned with each other. It’s too plain and visually not attractive. The AFTER image of Product Development Cycle is creatively designed. Circles, Icons, Texts are aligned with each other. Color is sober. Background design is appealing to eyes.
Grab this eye catchy diagram and impress your audience.
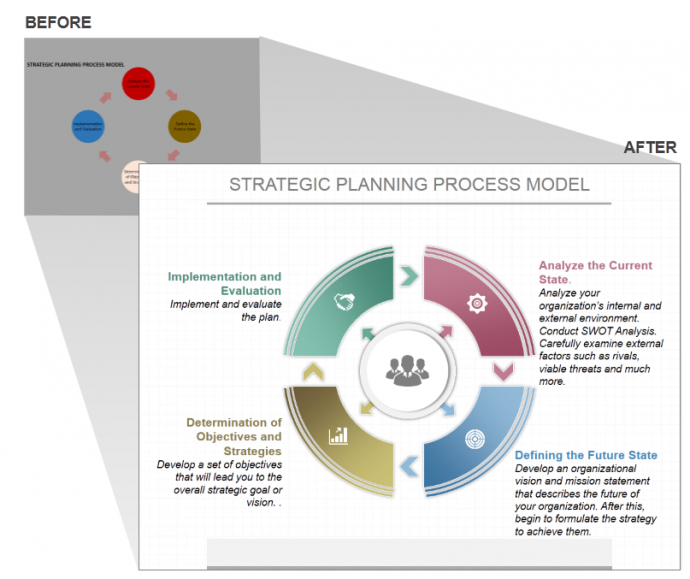
Example 4: Strategic Planning Process Model
The background drop of the BEFORE image is too dark to see anything. Color of the boxes are also dark colored making it difficult for the audience to read anything. Arrows are not professionally designed turning it into an ugly slide. Let’s look at the AFTER image, a soothing gradient is used in the steps of the diagram and arrows are small in size making it a professional slide. Icons are shown for each step to add visual impact. Texts are properly placed in order to explain the process.
Click here to download this creatively designed Circular Flow Chart PowerPoint diagram for your presentation.
Here are some additional Circular Flow Model Designs you may like:
We have shown you the difference. Now take a right decision, pick awesome templates and leave your audience awestruck.


![How to Create a Stunning Circular Flow Chart in PowerPoint [Tutorial #26]](https://www.slideteam.net/wp/wp-content/uploads/2016/10/How-to-Create-Beautiful-Circular-Flow-Diagram-in-PowerPoint-690x301.png)


 Customer Reviews

