An annual report is an in-depth report on company's financial performance over the last year and future expectations. Published annually, annual reports are sent to company's shareholders. They can also be created for other interested parties such as employees, suppliers, and the public at large.
There can be many benefits to creating an annual report:
- Inspires confidence in the current shareholders that the business in which they have invested is performing well
- It can help raise money from potential investors and venture capitalists. Investors are always looking for profitable businesses
- If you are undertaking corporate social responsibility (CSR) activities and supporting local groups, the annual report containing report of these activities can enhance your company's reputation
- It can help you earn trust from customers and cement your relationship with them
- It can motivate employees as they can see the value of their efforts. If employees are shareholders, the profit statement can reassure them that they took the right decision.
- It keeps you legally safe as it is a legal requirement for publicly held companies
- It helps you acquire loans or professional services with ease as they often ask for it
Annual Report Structure: Simple, Professional Annual Report Template
The audience you are writing an annual report for will determine its structure but more or less, all annual reports follow a similar format. Since the primary audiences are shareholders and investors, we are sharing annual report PowerPoint template for the same. It can, however, be used for creating annual report presentations for other audiences as well. Here is the right way to go about it:
Part 1 of Annual Report: Overview of Company
The first few slides of your annual report should describe what your business does, a brief history and your products and services so that new readers can become well acquainted with your business. So, you should include slides on:
Company Description
What does your company do? What industry and customers does it cater to? Are there any noteworthy achievements to your credit? When did it come into existence? Where are your offices located? Throw light on these in your company introduction slide.
Download Company Introduction Template (Slide 4 of Complete Deck)
Founders of the Company
Your audience should know who the brainchild of the company was or were? Give a face to your faceless company and help people connect with your organization as a living entity rather than a brick and mortar building.
Letter from the CEO / Chairman’s Message / Letter to Shareholders
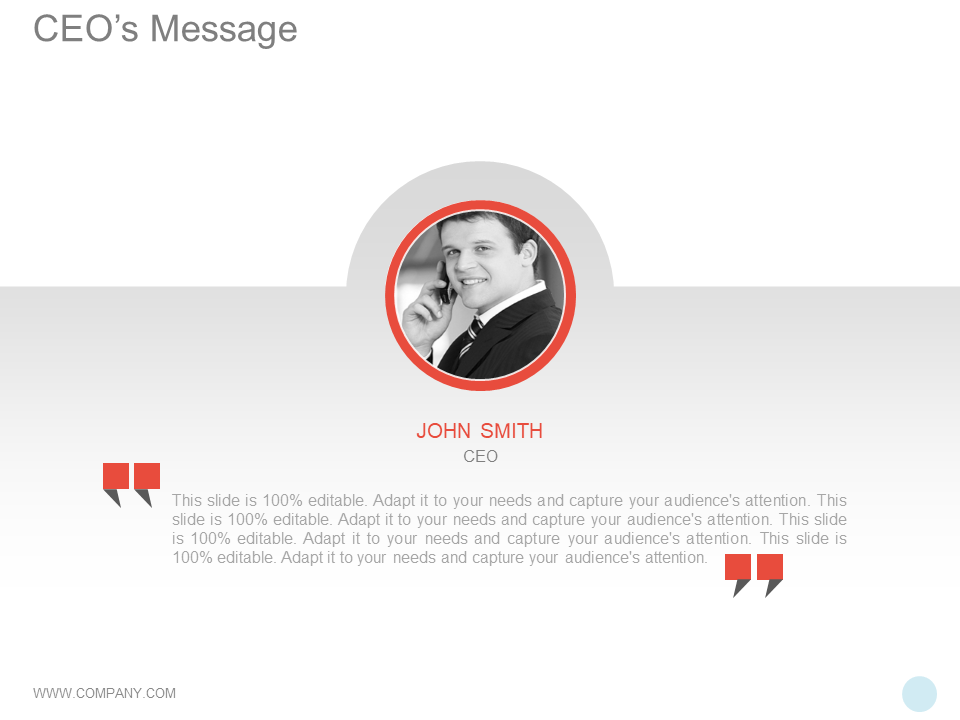
You can give any title here but it’s a must that you include a slide on the message by the CEO since it is widely read. Keep it short if you are presenting it in person. It can be lengthy if the presentation is to be read at leisure. The message is an upbeat summary of the company’s financial performance over the last year and company’s goals and prospects for the future.
Download Chairman Message Slide (Slide 6 of 60)
Vision Mission Values
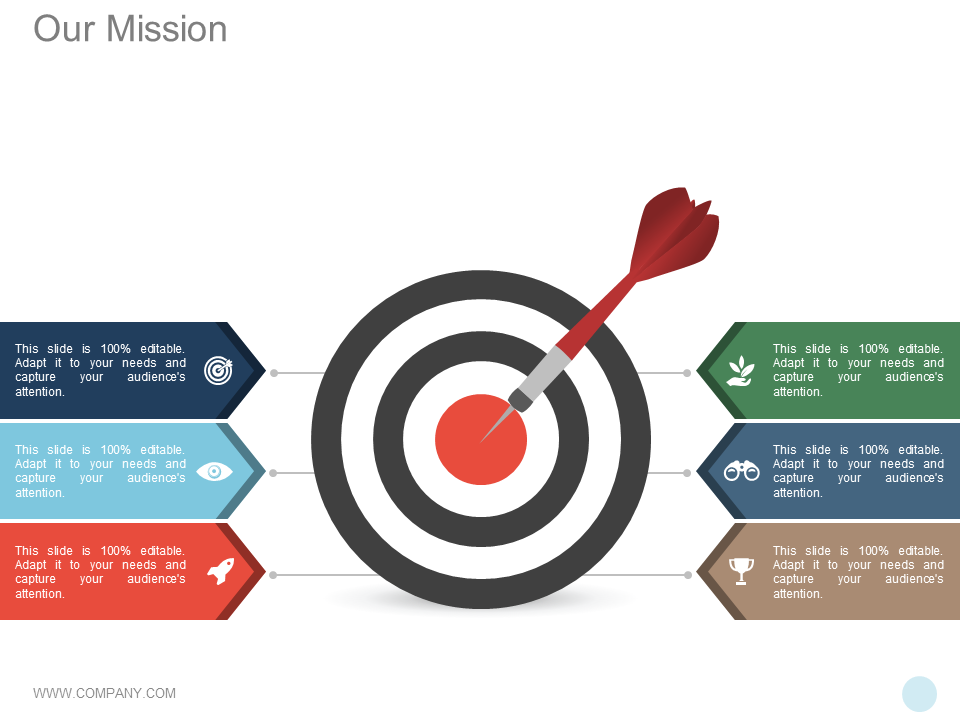
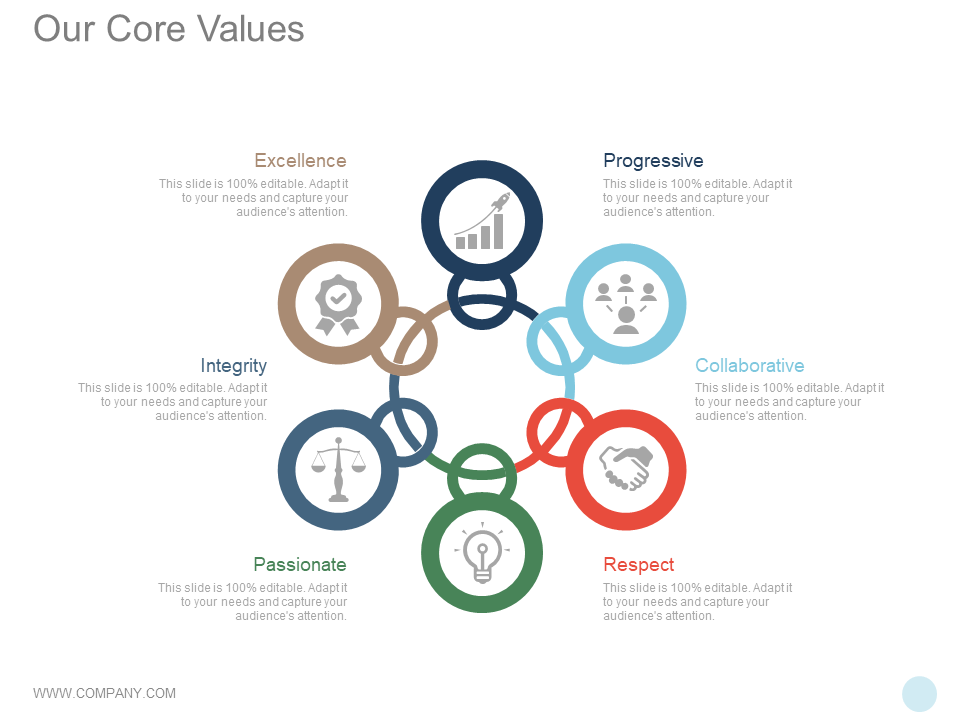
Share your business mission and vision with the audience. Mission focuses on the present while vision on the future. Make the audience a shared partner in your vision.
Also highlight the corporate values that guide you in your day-to-day operations. It helps you earn audience’s respect and admiration.
Download Mission Vision Values Template (Slide 8-11 of Complete Deck)
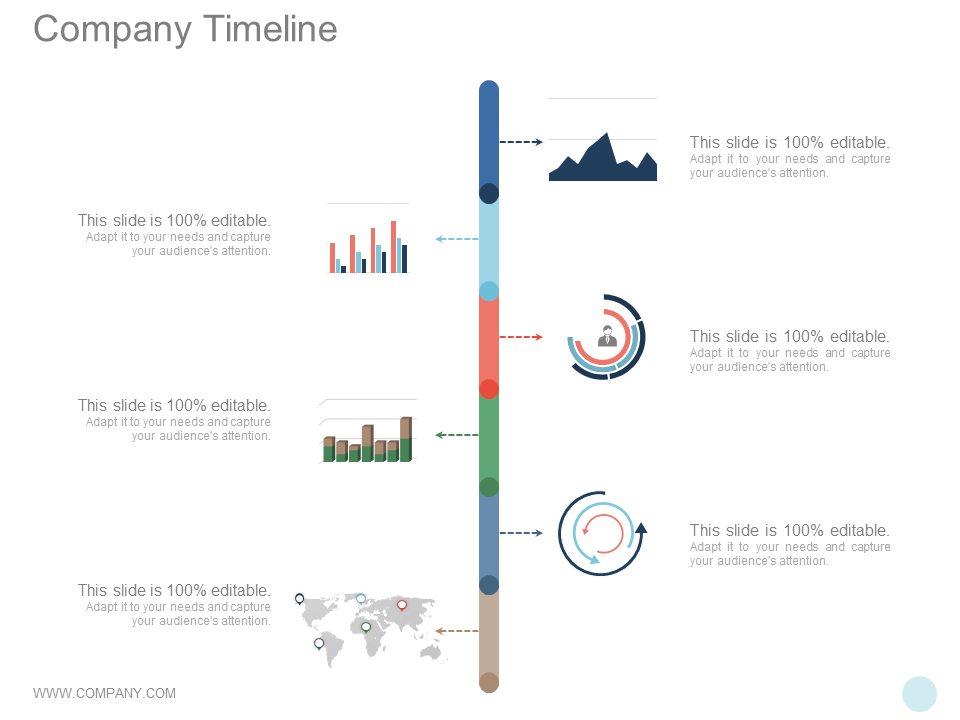
Company’s Historical Timeline & Achievements
How far has your business come since its inception? What were the key achievements along the way? Present your visual story through a timeline.
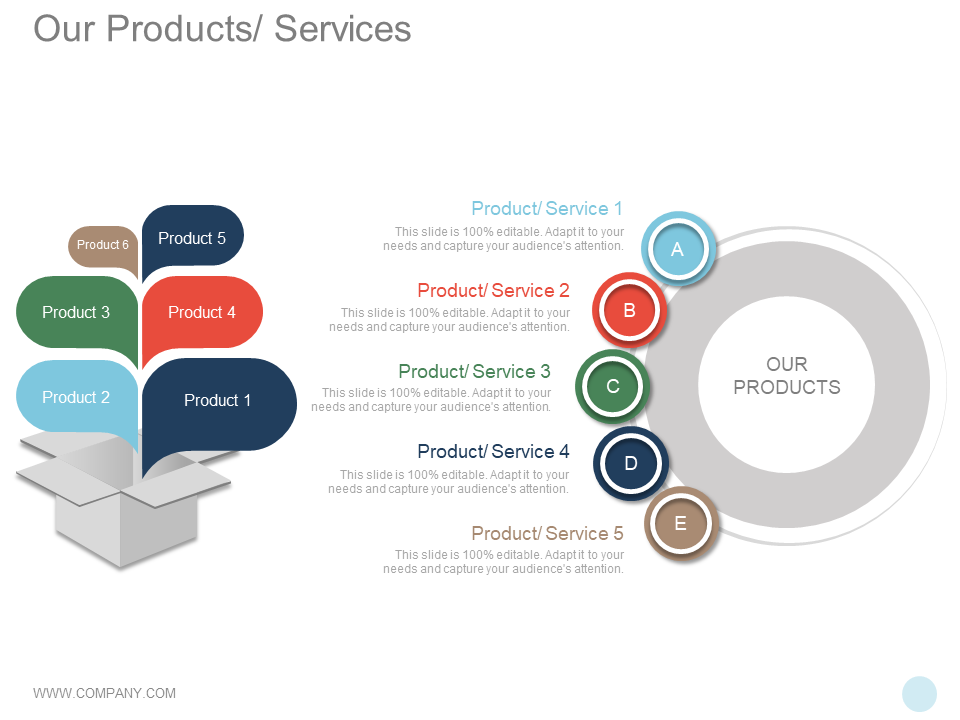
Product Portfolio
List out your product line so that the shareholders and other parties can see your business diversification efforts. You can also share new product developments which inspires confidence in your businesses’ potential to grow in the market and make fortunes.
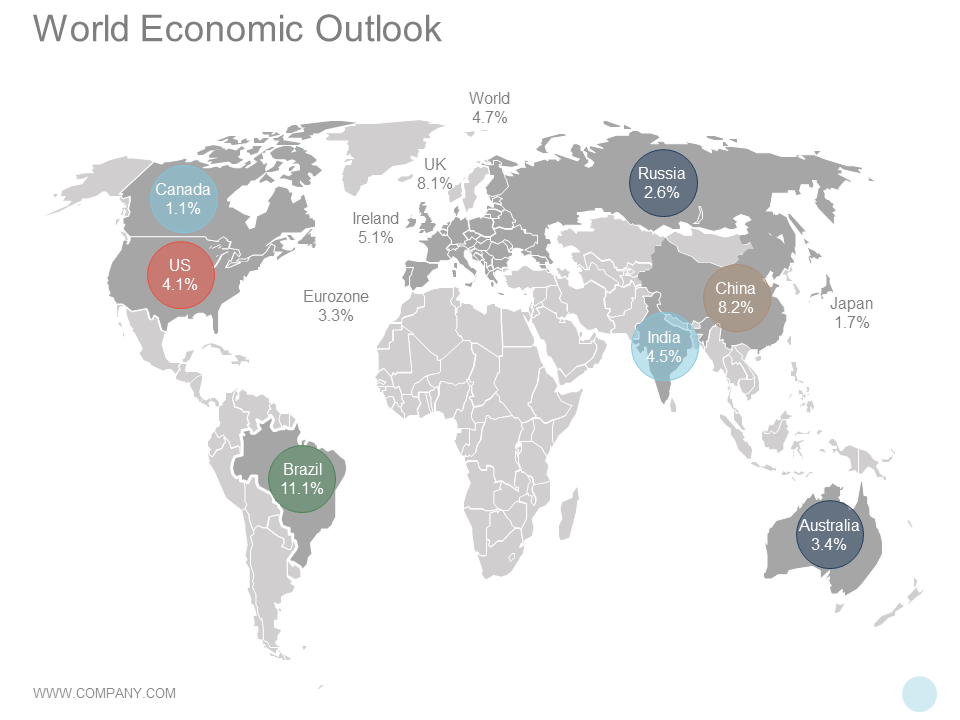
World Economic Outlook
If you have a global market, map it out showcasing the most profitable markets for you. You can even share an estimate of how you plan to increase market share in these countries over the next two or three years.
Download World Economic Outlook Map (Slide 20 of 60)
Part 2 of Annual Report: Financial Statement
Financial Highlights
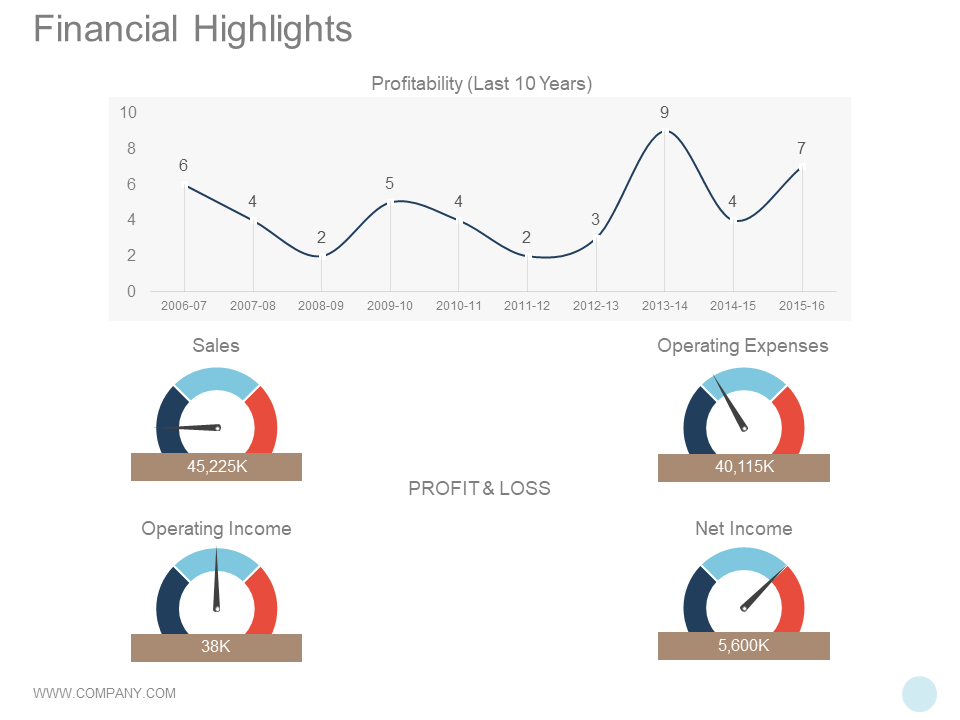
Provide an overview of your company’s financial performance over the last 3 years or more. You can show your profit graph rising from the last 10 years to sum up your growth in one line chart before the investors. Highlight your total sales, operating income, operating expenses, and net income.
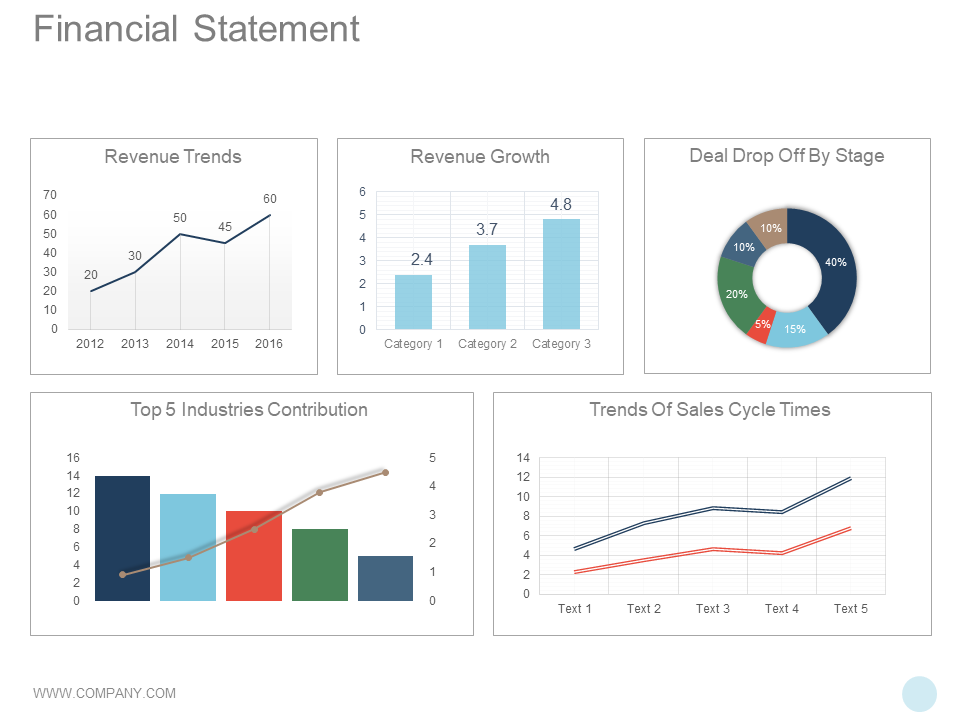
You can also present a market trend report showing the trends that influenced your overall revenue and growth. You can highlight the top industries and their contribution in your revenue.
Download Financial Highlights Template (Slide 24-26 of Complete Deck)
Sales Highlights
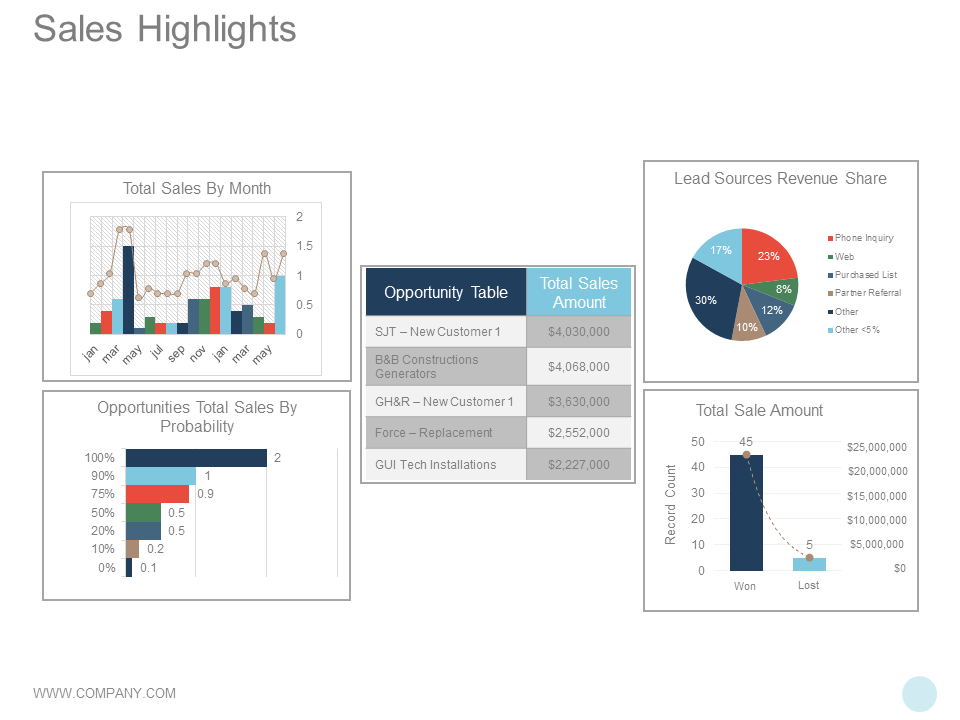
Summarize the results of your sales initiatives over the year. Present sales recorded each quarter or month. Highlight the loss-won deals. You would obviously present the win deals more prominently to show your ability to bag big projects or customers. You can also list out the top 5 customers or deals that you acquired in the past year and the sales amount generated from each.
EBITDA Highlights
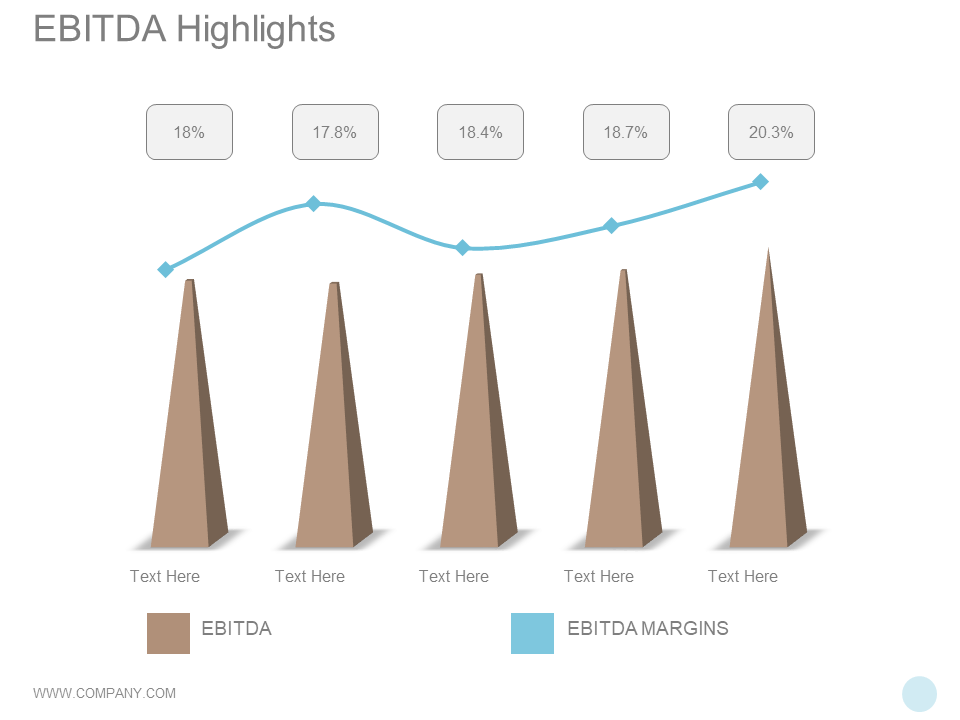
Earnings before interest, tax, depreciation and amortization (EBITDA) is a measure of company's performance without having to consider financial and accounting decisions. It can also be calculated by taking the net income and adding to it interest, taxes, depreciation, and amortization. Besides showing EBITDA, the investors are also interested in knowing the company's EBITDA margin to show how effective your cost-cutting strategies were. If your EBITDA margin is growing over the years, that's a positive sign for the investors as your operating expenses are decreasing in relation to the total revenue.
Download EBITDA Trend (Slide 29 of 60)
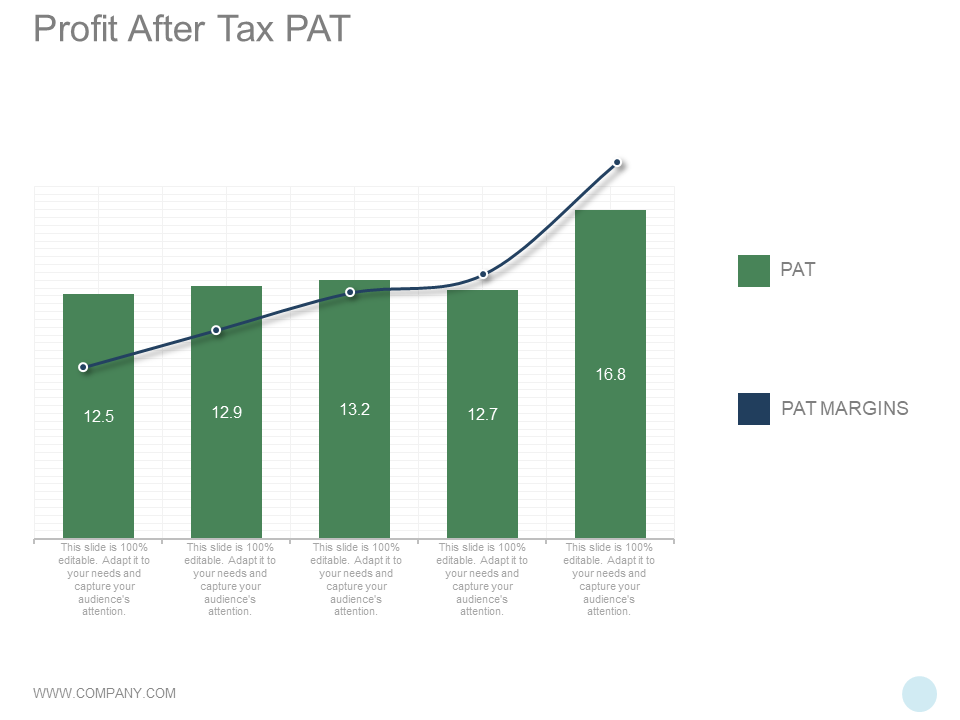
Profit After Tax (PAT) Highlights
Profit After Tax (PAT) is another measure to depict the financial health of a company. As the name says, Profit After Tax is the total amount that a business earns after deducting all tax from it. It is also useful to provide the PAT margin to shareholders so that they can analyze how much a company actually earns. It is calculated by dividing net income by net sales.
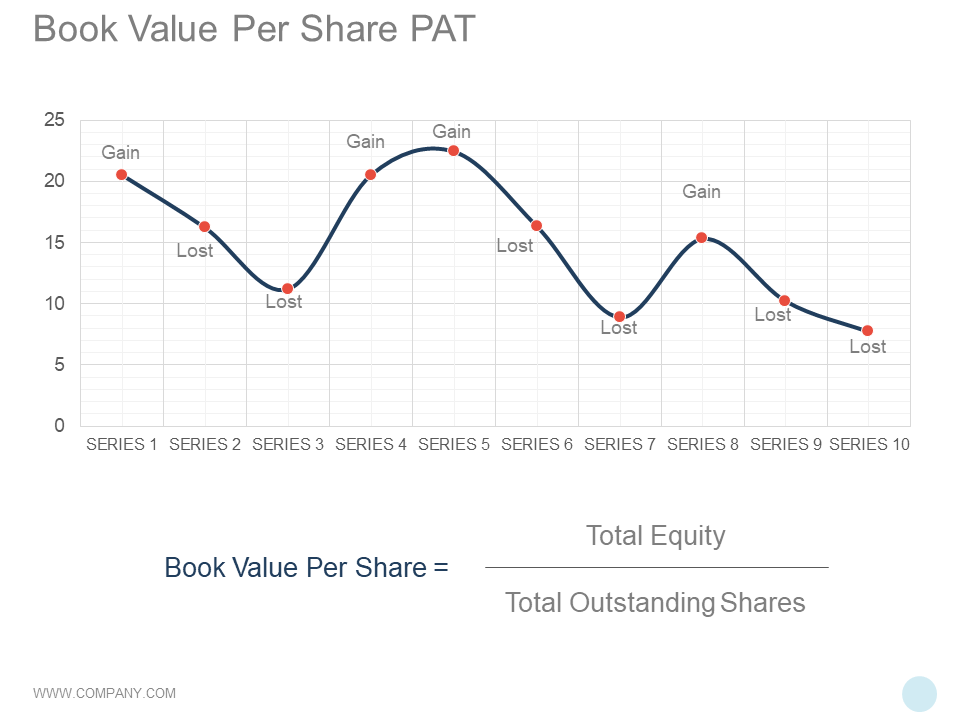
Book Value Per Share (BVPS)
Book value per share refers to the accounting value of a single share of company's stock. Book value is calculated by totalling the company's assets minus intangible assets and liabilities. Investors can get a rough estimate of the true value of a company using this financial measure.
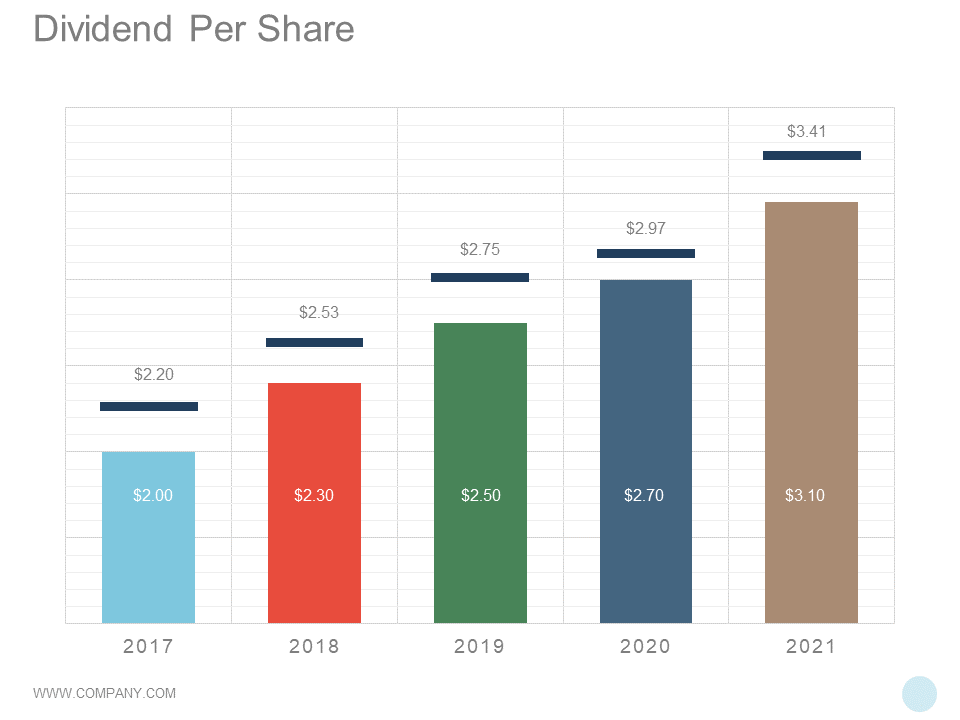
Dividend Per Share (DPS)
This is a very important slide for shareholders. Dividend per share refers to the total dividend or earnings a company paid to its shareholders per share over the last 12 months. If this keep rising with each year, it signals that the company is growing. If last year, the company paid a dividend 70 cents per share and this year paid $1.20 per share, it means the company earned more and therefore shared more profits with shareholder. If it declined even though your company performed well, you need to assure investors why you shared less profits with them. For instance, you might have invested in a new product.
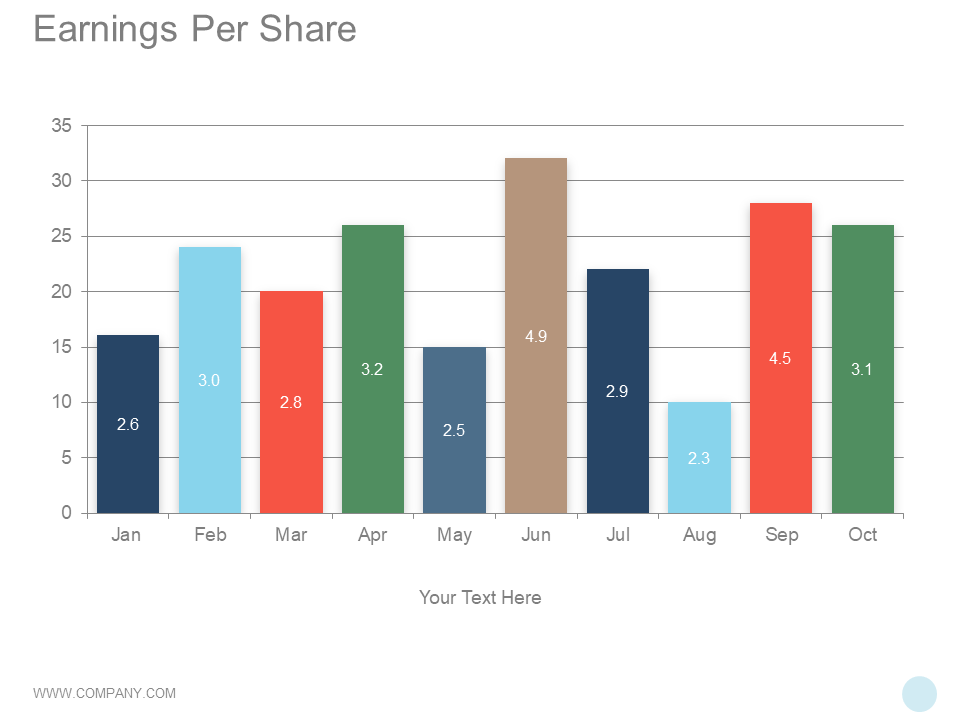
Earnings Per Share (EPS)
This is another measure of company’s profitability. Earning per share, also called net income per share, indicates the net income earned per share of stock outstanding. This helps shareholders know the profitability of a company per share of its stock.
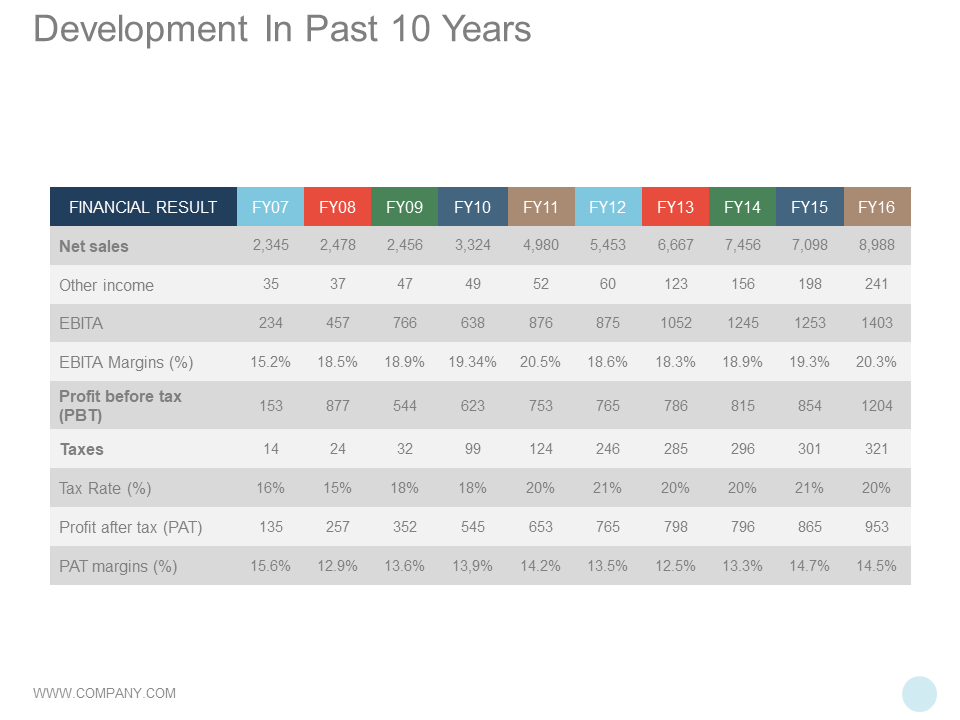
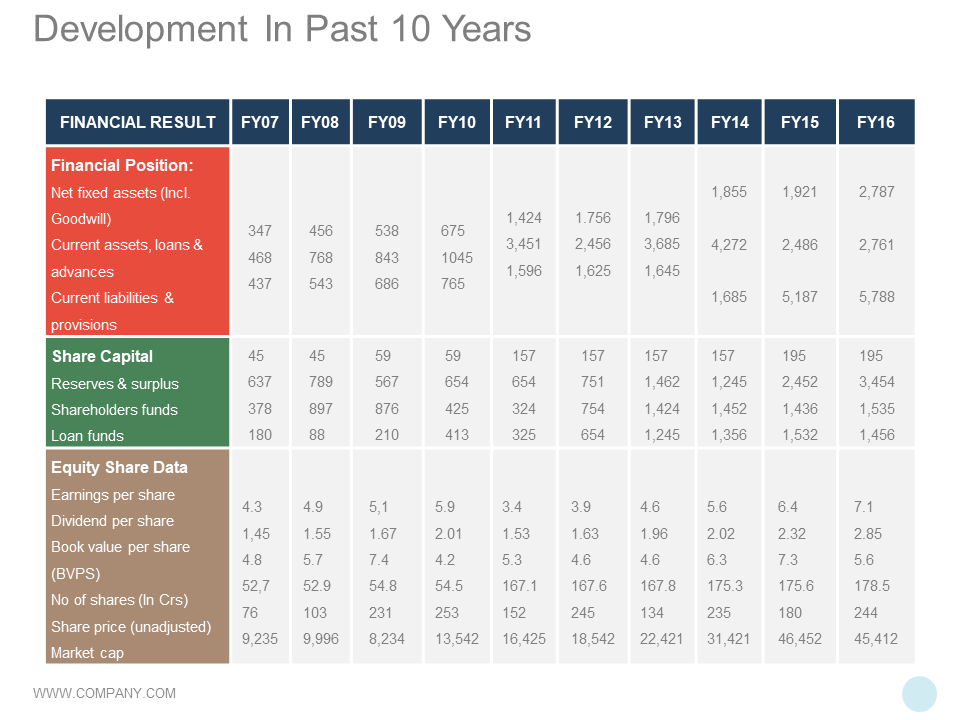
Development in Past 10 Years
Compare financial performance of your business over the last few years. Compare net sales, EBITDA margin, PAT margin, net fixed assets, current assets, current liabilities, earnings per share, dividend per share, and other financial measurements that we discussed above.
Download Financial Performance Comparison (Slide 39,40 of Complete Deck)
Balance Sheet
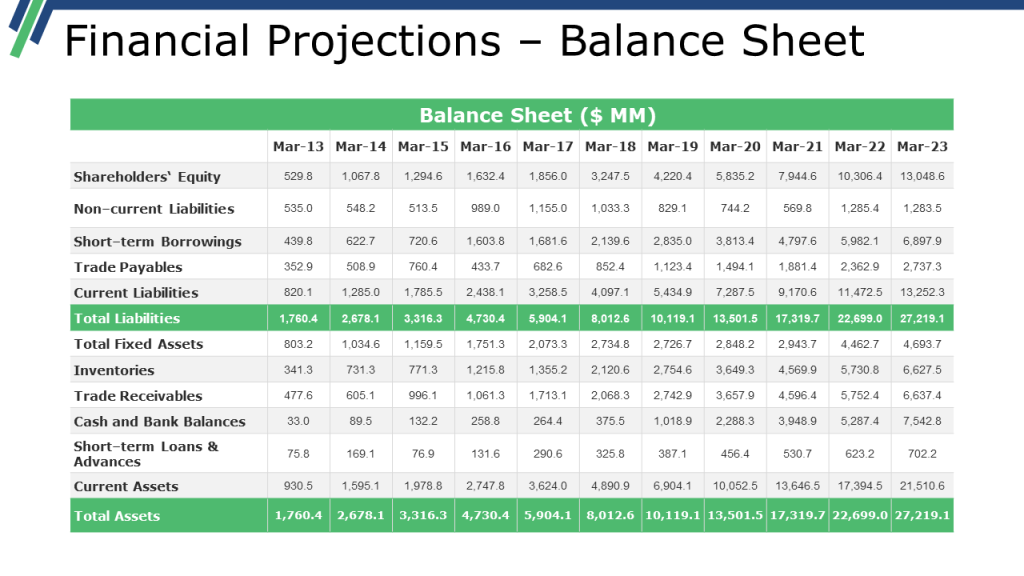
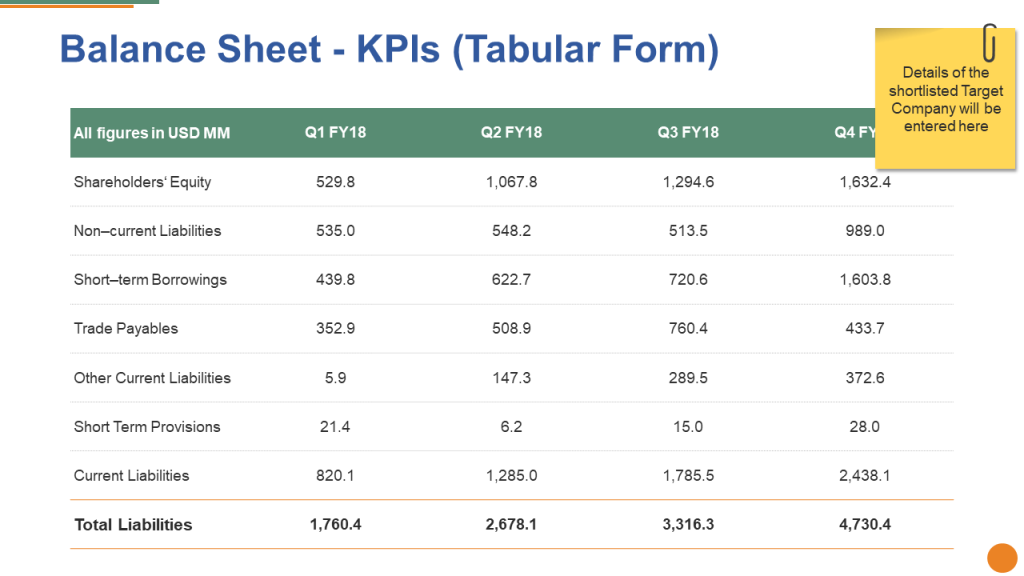
Balance sheet, income statement and cash-flow statement are the three main financial statements. Balance sheet shows a company's assets and liabilities. It comprises of assets, liabilities and owners equity. Through this, shareholders can see how assets are being utilized and financed.
Download the Balance Sheet Template
Download this Editable Balance Sheet Slide
Income Statement
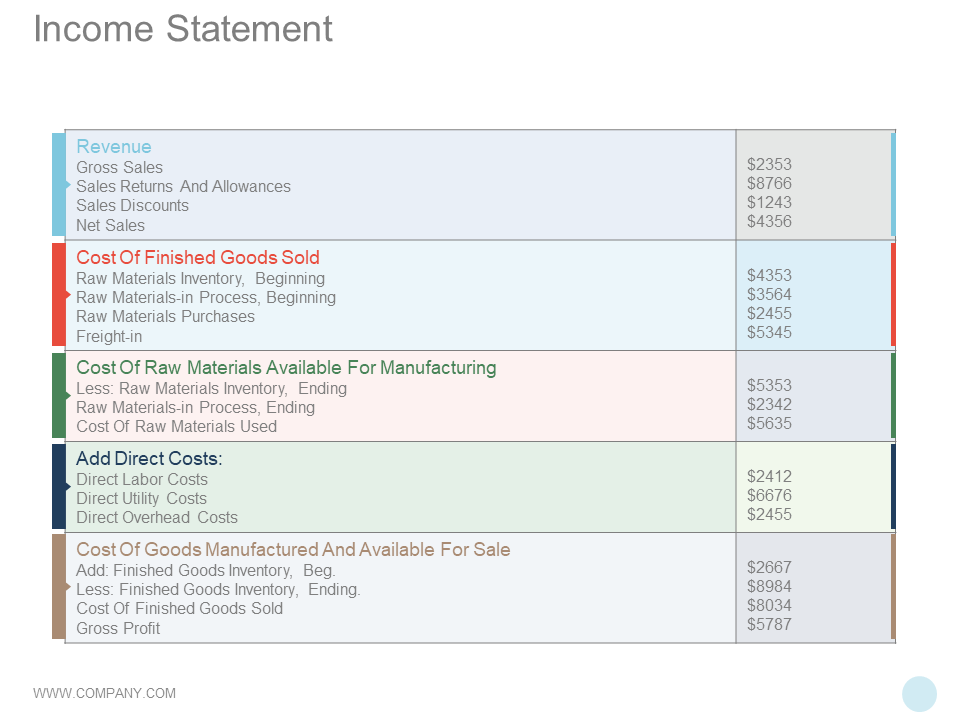
The income statement is also called the profit and loss statement and shows the company’s income and expenses over the quarter or the fiscal year. Income statement helps investors see if the company is making a profit or a loss and check the revenues, costs and expenses over the period.
Cash-flow Statements
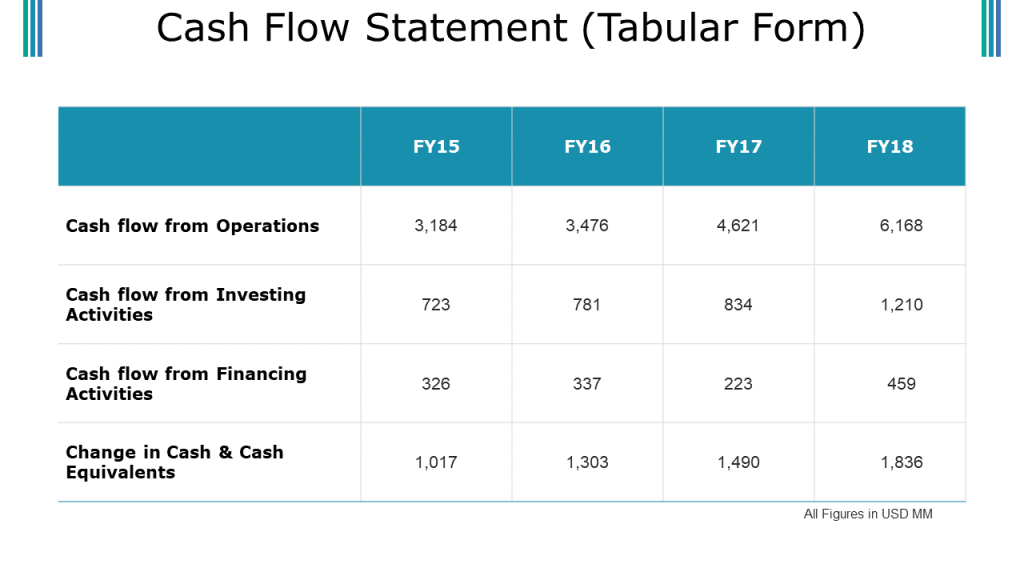
The cash-flow statement shows how much the company spent on operations, investment and financing activities. This helps investors see how efficiently company is managing its cash and thus decide on further investment in the company.
Download Cash-Flow Statement Sample Slide
Part 3 of Annual Report: Future Roadmap
What is your vision for the future? Are you planning to diversify your business and earn more profits? Share your roadmap for the future with investors to close the annual report presentation on a promising note. No need to share the secret strategies here; just an overview of the goals you have set for the year ahead.
Writing an annual report is definitely a beneficial exercise. It is a useful marketing tool to raise money from investors and win the confidence of customers and other audiences. Creating it, however, can take hours or even days. That is why, we have prepared a ready-to-use annual report PowerPoint template so that you can present a visually engaging report to shareholders and make the most out of your annual report presentation.





 Customer Reviews




I like your templates, you can have more graphical ideas.
Thank you