Kaizen is a Japanese philosophy that believes “change is good”. “Kai” means change and “zen” means good. In business settings, Kaizen is also a strategic tool that brings about continuous improvement, in terms of increased productivity, superior quality, lower costs, efficient processes, increased safety, and better customer experience. The word “Continuous” is worth remembering here as Kaizen is a never-ending improvement process.
The Kaizen story began after World War II when Toyota started implementing quality circles in its production processes. A group of workers identified the problems, analyzed, and proposed solutions to improve productivity. “The Toyota Way” later became extremely popular in the western world thanks to the work of Masaaki Imai who published his book Kaizen: The Key to Japan's Competitive Success in 1986. The book was translated into 14 languages making Kaizen a must for any organization that wishes to bring significant improvements in their processes without making any big, radical changes.
5S of Kaizen
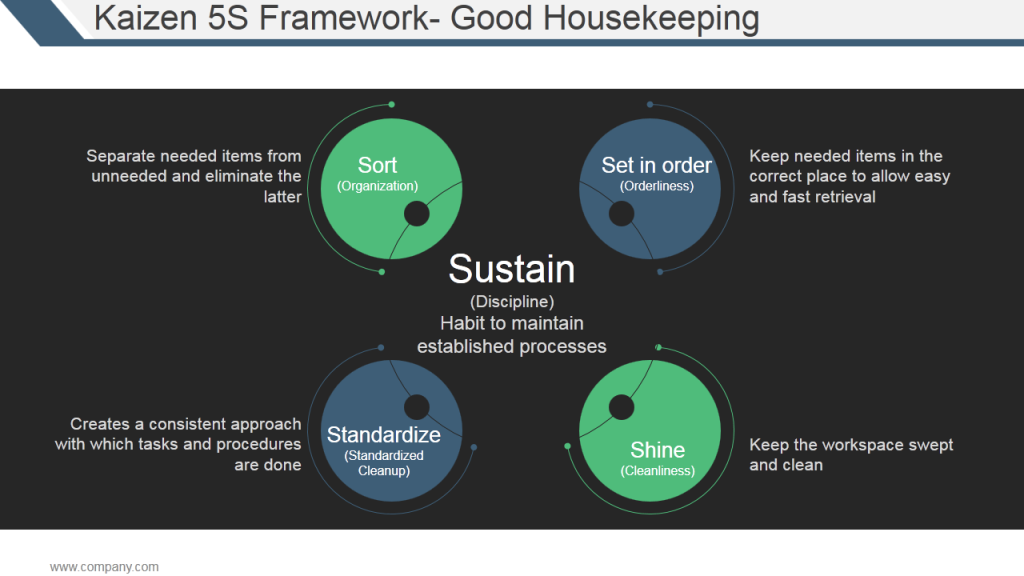
To support continuous improvement, Kaizen theorists recommend practicing 5S which will lead to standardized processes, better time management, improved work culture, and an increase in employee satisfaction. These 5S are - Sort, Set in Order, Shine, Standardize, and Sustain. This slide elaborates upon the 5S framework:
Download Kaizen 5S Framework
Kaizen Principles: Summary
- Team effort - Implementing Kaizen is not just the job of one person or higher-ups in the management but involves each and every member of the organization.
- Good processes - Kaizen believes that good processes bring good results. If any department is performing poorly, it’s the process and not the people that are at fault.
- Focus on small, continuous changes - Kaizen practitioners believe that small, continuous changes bring much better results than a few drastic, big-level changes.
- See it to believe it - Kaizen practice tells you to visit the place of operation to see first hand the problems experienced and processes followed.
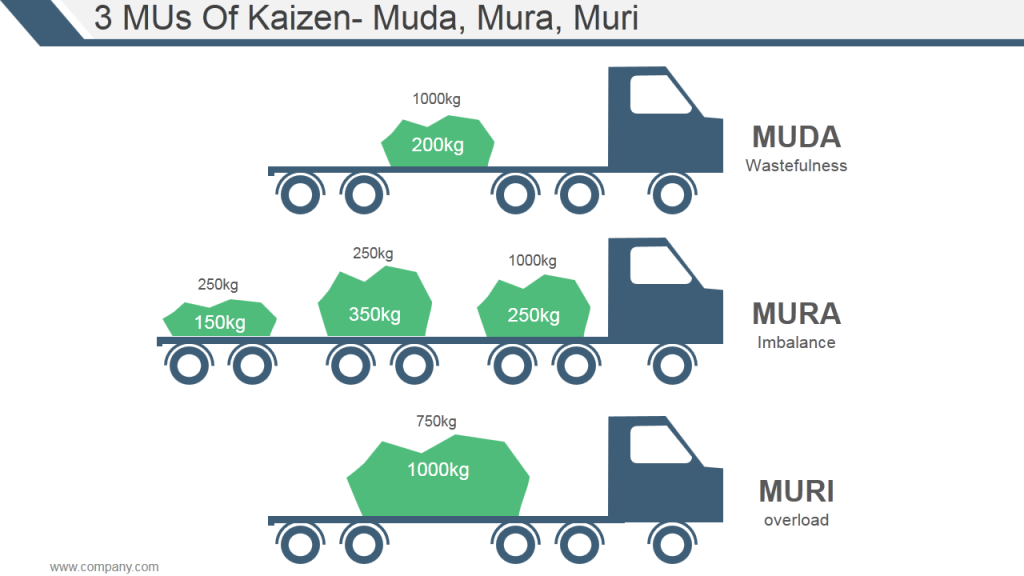
- Elimination of waste - The basic objective of Kaizen is to eliminate waste called “Muda”. It guides a business in identifying these 3 MUs - Muda (waste), Mura (inconsistency), and Muri (strain on people and machines). Here’s a slide that shows the difference between the three:
Are you following the Kaizen way in your organization? Whatever industry your business belongs to - finance, healthcare, IT, or any other - you stand to gain a lot with Kaizen. Here are 19 Kaizen PowerPoint Templates to help you get started and document all your efforts for everyone in the organization to see:
Download the Complete Kaizen PowerPoint Presentation
Implementing Kaizen: Step by Step Guide
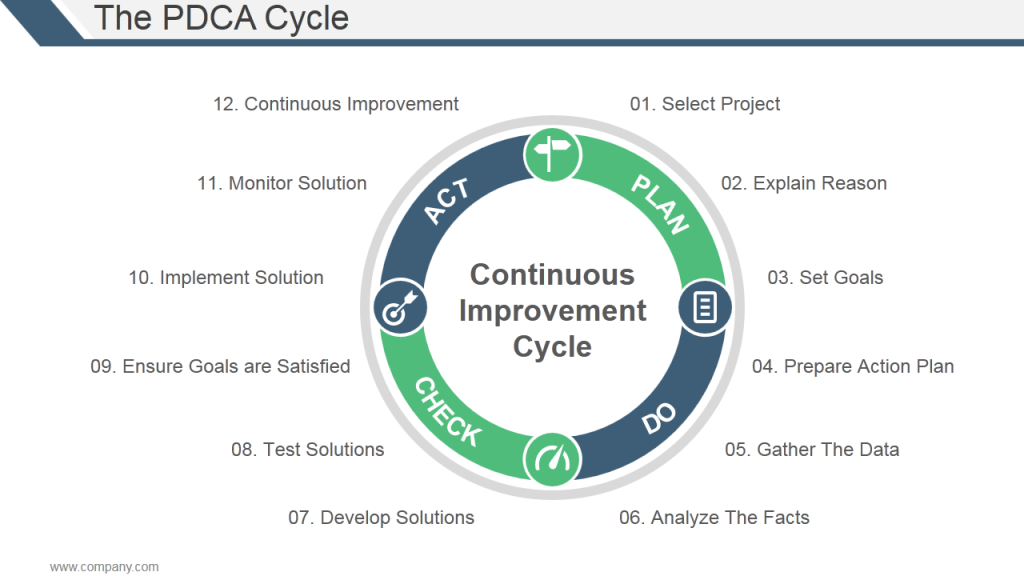
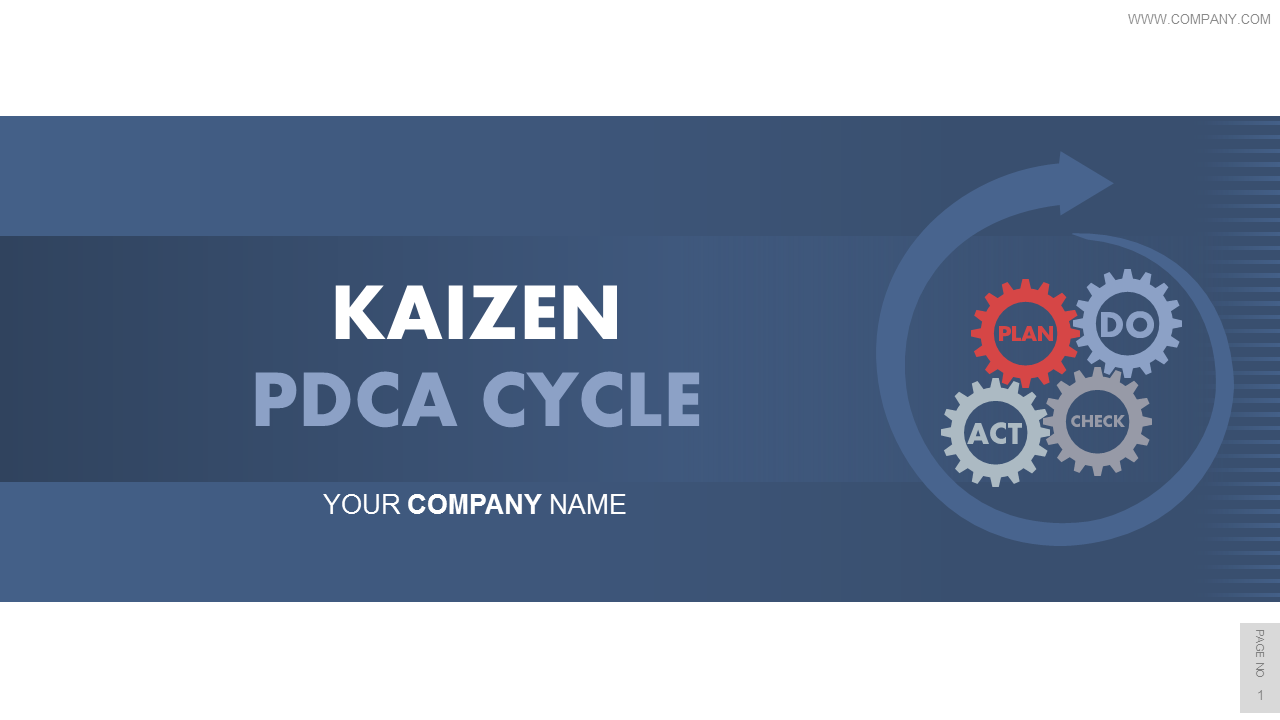
The system for implementing Kaizen is called the PDCA Cycle, an iterative model of change comprising four stages - Plan, Do, Check, and Act. It is a continuous activity that has to be repeated again and again. This model is also known as the Deming cycle, Shewhart cycle, and plan–do–study–act (PDSA) model.
Download PDCA Cycle PPT Slide
Stage 1 - Plan
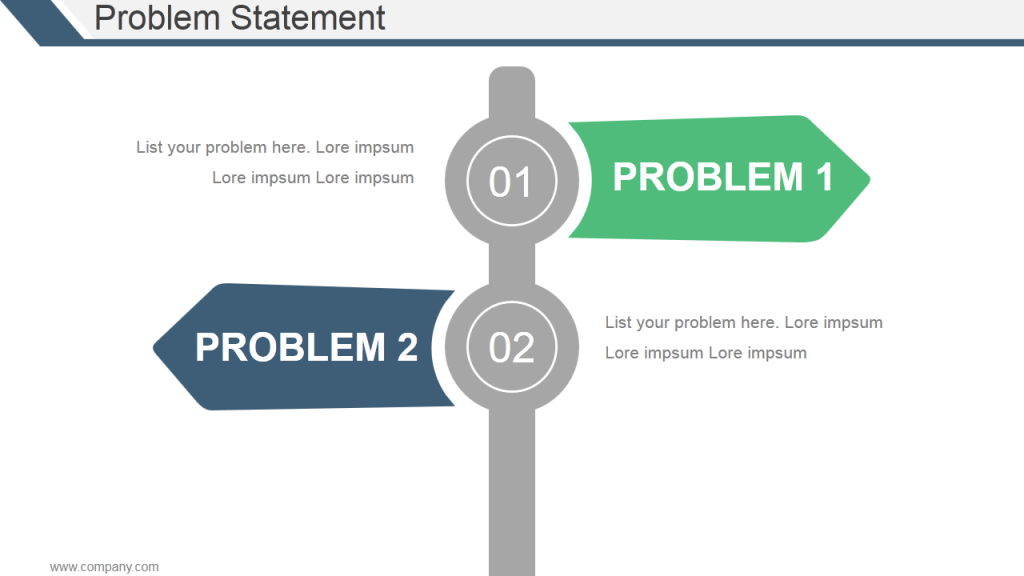
1.1 - Write the Problem Statement
Identify which area or department requires improvement. Is customer care getting poor reviews? Also, identify the Key Performance Indicators that show there is an actual problem. For instance, the average handle time is too high in the last quarter compared to the average handle time and so on.
Use this Problem Statement Template
1.2 - Identify Root Cause
Try to identify the reasons leading to poor performance. Remember everyone is involved in Kaizen, so you need to visit the call center, meet the customer care representatives face to face and ask them to share the problems faced and reasons for unproductivity. Thereafter, you might come to know that with the expansion of services, more manpower was needed but was not provided resulting in work pressure. Or they were not given proper training about the products and services resulting in confusion.
Also, listen to the call recordings and experiences shared by customers to see where the team is failing and identify areas of improvement.
Download this Presentation Slide
1.3 - Set Goals
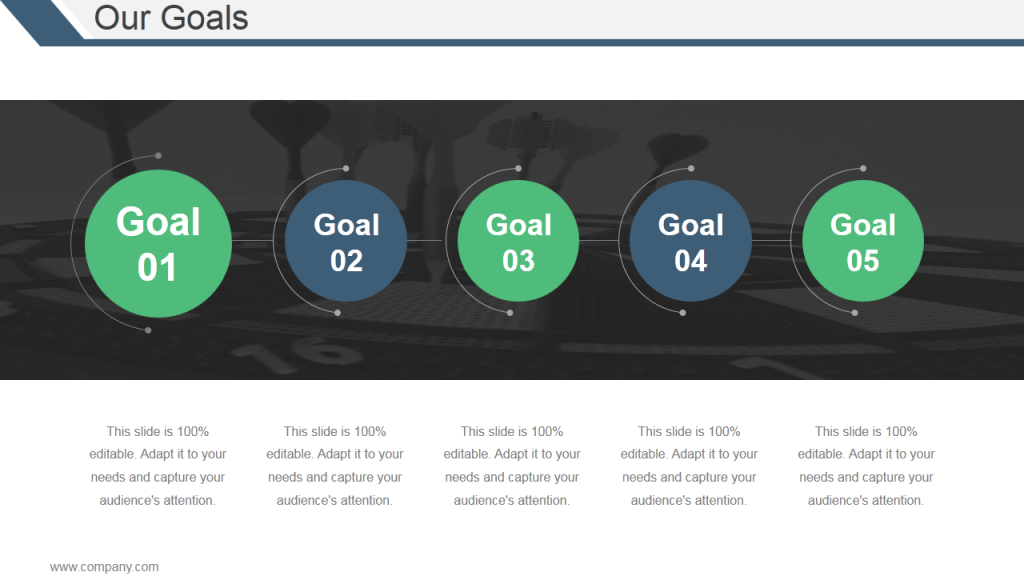
Based on the initial data you have collected, set goals for improvement. Thereafter, while setting goals, try adhering to the SMART model i.e. the goals should be Specific, Measurable, Achievable, Relevant, and Time-Bound. For example, your goals could be to hire 50 new customer reps in a month, hold exhaustive training sessions twice a week, and reduce the average handle time from 5 minutes to 3.5 minutes.
1.4 - Prepare Detailed Action Plan
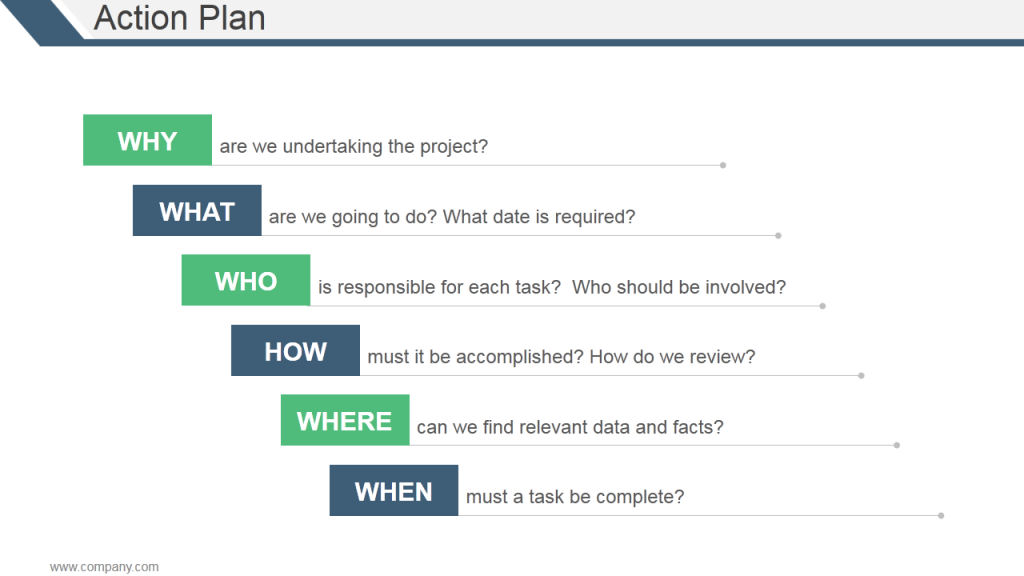
Now is the time to prepare a detailed action plan by involving all the stakeholders. If the goals require efforts by the HR department, team leaders, staff, or any specific department, involve them in preparing a detailed action plan. Try to answer the below 5Ws and 1H while doing so. The point is that it is a fact and data-driven and encompasses all the relevant criteria like time and ownership.
Download the Action Plan Template
Stage 2 - Do
2.1 - Collect and Analyze Data
We need hard facts and reliable data to recognize the patterns. Is the lower conversion on your site a seasonal fluctuation or has it been downhill after the introduction of the new interface? Data collected for the past few years helps you arrive at reliable conclusions.
You can use multiple data collection tools like interviews, online surveys, telephonic chats, field studies, and so on to collect the data. Kaizen recommends visiting the shop floor (the place where actual operations take place) to see for yourself the operation in action and identify problem areas. In lean manufacturing, this concept is called Gemba meaning “the real place”. Gemba kaizen suggests that whenever a problem occurs, visit the site and gather data from all sources. Therefore, this is the place where the best improvement ideas will come.
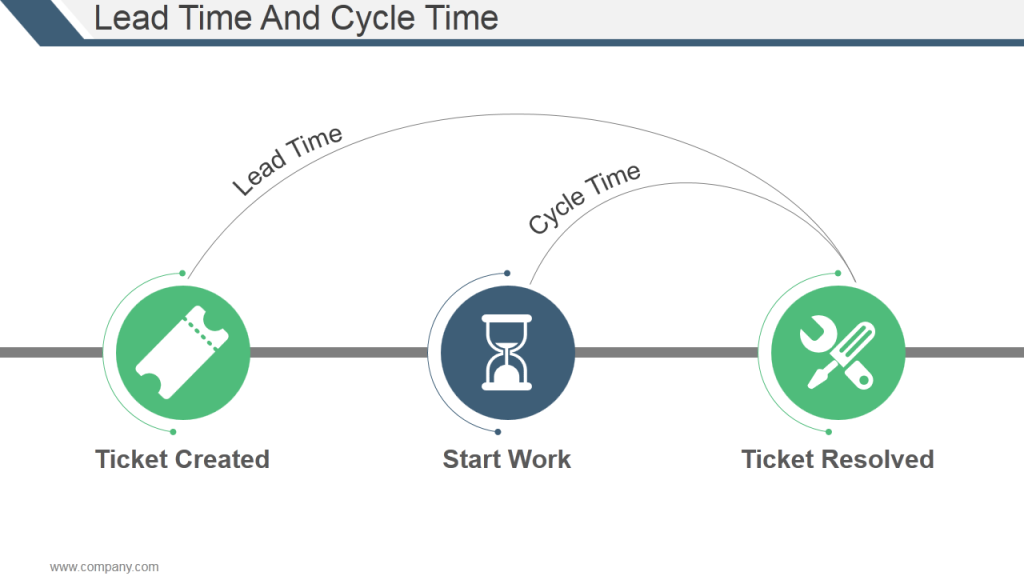
Collect data for all the KPIs you have identified like lead time, cycle time, average handle time, and so on.
You can use seven basic Quality Tools at this stage for data analysis and presentation:
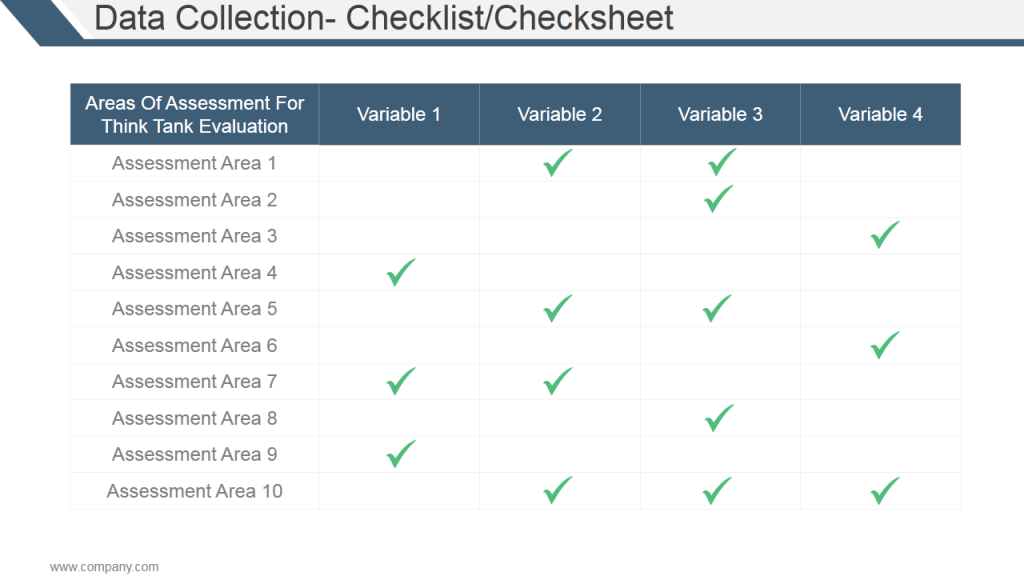
1. Checklist- A checklist or a checksheet is a simple way to analyze data. Rather than relying on memory, use a checklist to remember the things that need to be done or items that need to be obtained.
Download this Checklist PowerPoint Template
2. Control Chart - Are your processes under control or out of control? Use Control Charts to show how processes are changing over time. A control chart has a centerline (average), an upper limit line, and a lower limit line. Plot your data on this chart and compare the same with these lines to draw conclusions.
Download the Control Chart Diagram
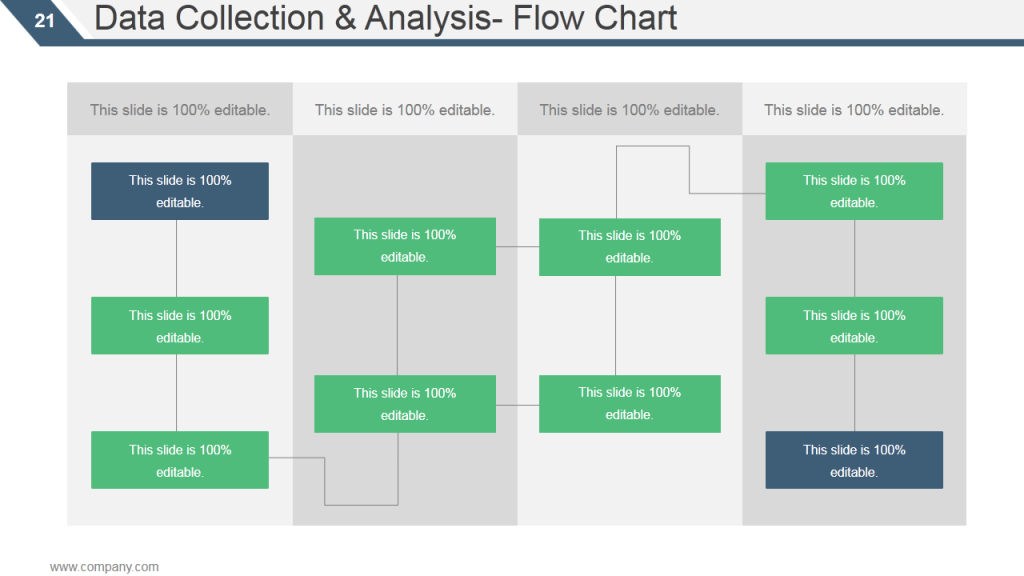
3. Flow Chart - Visually represent the steps in a business process as it moves through various departments using a flow chart. Additionally, this removes any confusion and the process is clear to all.
Download the Flow Chart Diagram
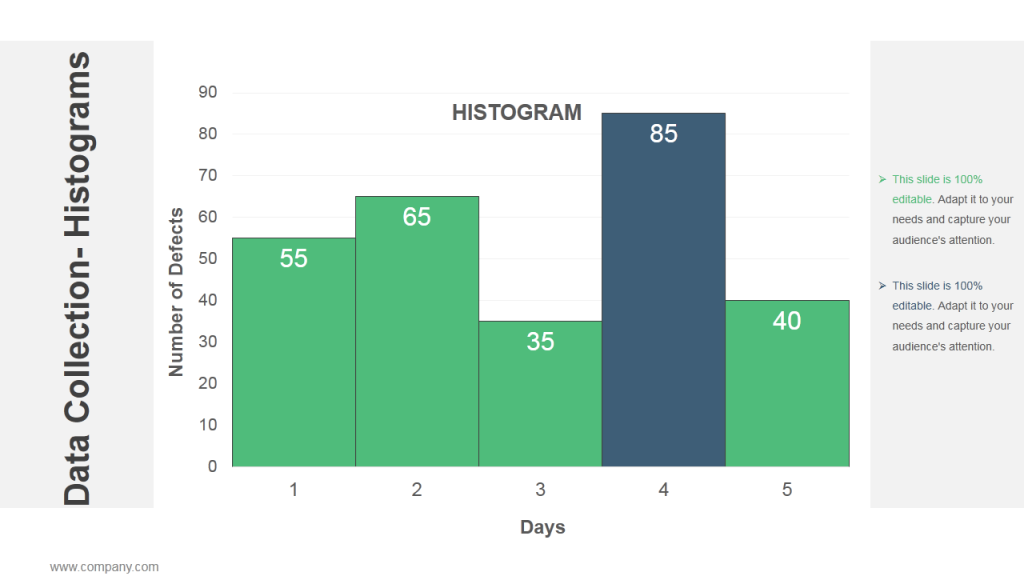
4. Histogram - Show the variation in sets of data using Histograms. A histogram is often confused with a bar graph but unlike a bar graph, in a histogram, there are no spaces between bars. Show the frequency of data using the histogram below:
5. Scatter Diagram - Scatter Diagrams are basically line graphs but with no line. It is used to see whether a relationship exists between two items. Plot the cause on X-axis and the effect on Y-axis and interpret the data accordingly.
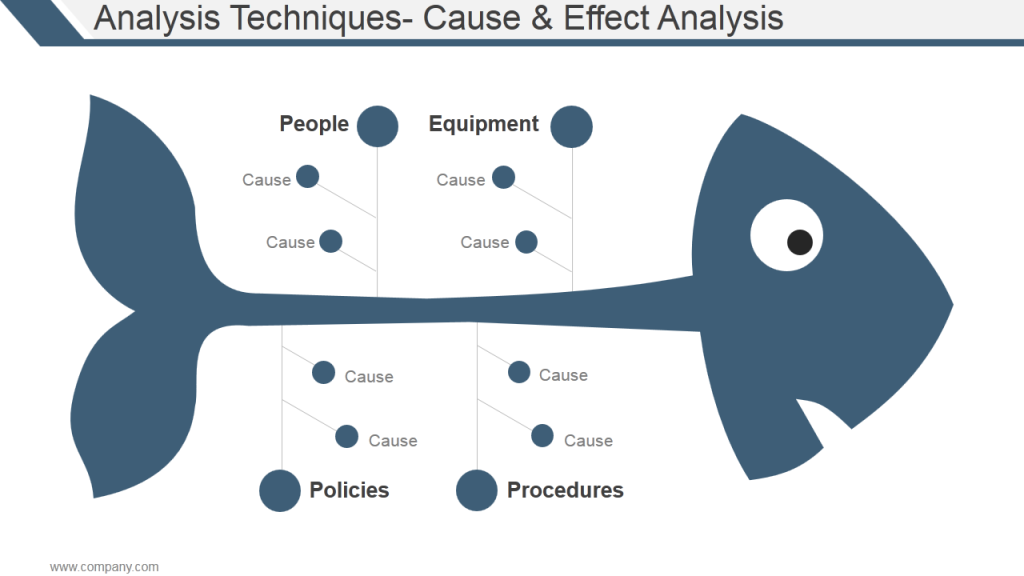
6. Cause and Effect Analysis - While analyzing and visually presenting the data, one can use the Cause and Effect Analysis diagram also known as the “Fishbone” diagram. Place the problem at the mouth of the fish and list the possible causes on the branches or bones of the fish. Thereafter, have main categories like people, equipment, policies, and procedures as the branches and put sub-causes on the sub-branches. It is a great visual to clearly see all major and minor causes of a problem.
Download Fishbone Diagram Template
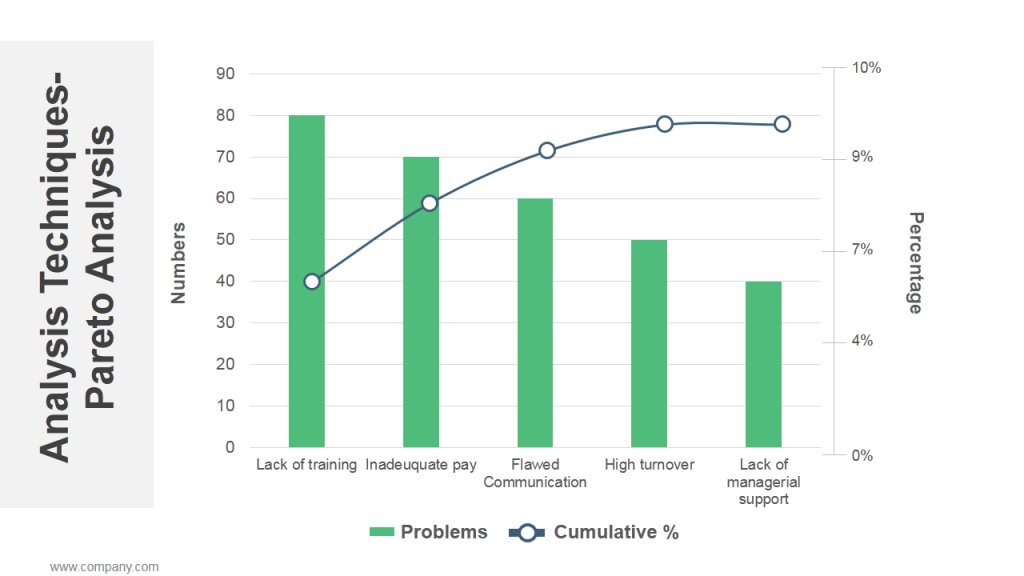
7. Pareto Analysis - You may also use Pareto Analysis, a statistical technique based on the 80/20 rule. According to this rule, 80% of the problems stem from just 20% causes. While doing Pareto Analysis, you score each problem, group related problems together, and focus all your efforts on the most important causes while ignoring the smaller ones. Here’s a Pareto Chart template that you can use while doing your analysis:
Download Pareto Analysis Chart
2.2 Develop Solutions
After collecting and analyzing the data, it’s time for all team members to have an open brainstorming session to develop solutions to the problem. Thereafter, you need to follow all rules of brainstorming like participation by all, no criticism of any idea, no judgmental looks, and no limitations on the number of ideas a person can share. You can follow the most popular brainstorming techniques to have a fruitful discussion round.
Stage 3 - Check
The solutions developed in the previous stage need testing for effectiveness. Upon testing and measurement, you need to:
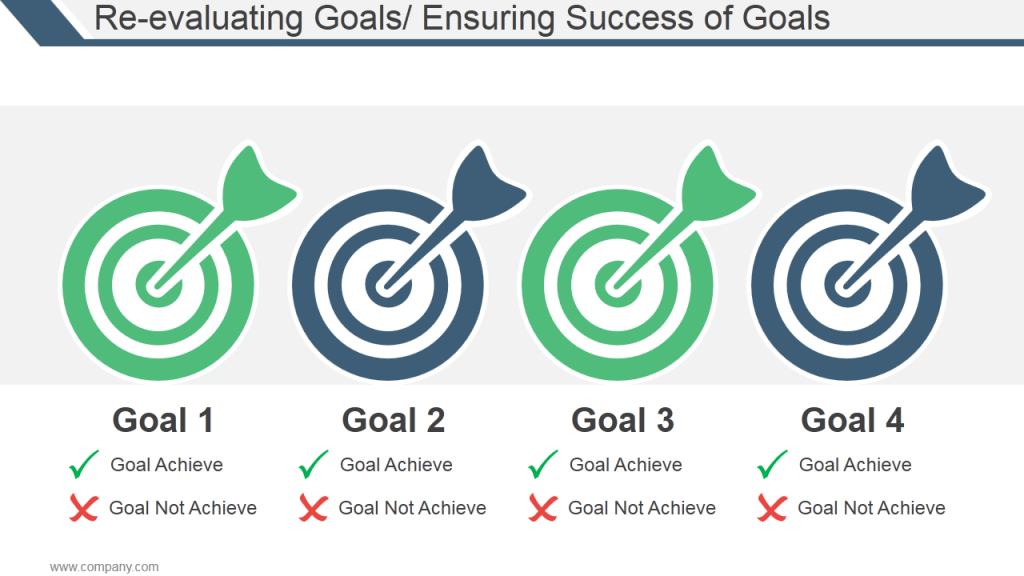
3.1 - Ensure Goals are Satisfied
Are the goals set in the first stage being met with the solutions suggested? If not, you need to develop more effective solutions or you need to reevaluate the goals set earlier. So you need to go back to reassess your goals and their accomplishment status.
Grab the Goals Assessment Slide Here
3.2 - Implement Solutions
The success in the trial phase now needs complete implementation to bring about Kaizen - change for good. The new way becomes the standard way and this becomes the baseline for further improvement. Maintain a standard operating sheet that will be followed by all. The standard operating sheet will lay out the work sequence, the finishing time of the task, the inventory for smooth operation, and safety guidelines. Here is a standard operating sheet template that you can use:
Download the Standard Operating Sheet
Stage 4 - Act
Kaizen is a continuous process - a mindset for continuous improvement. So in this stage, you need to keep monitoring the solutions, improvise them and as bottlenecks emerge, repeat the cycle once again - Plan, Do, Check, Act. However, this should become a culture, a habit so that you never stagnate and keep improving and improving.
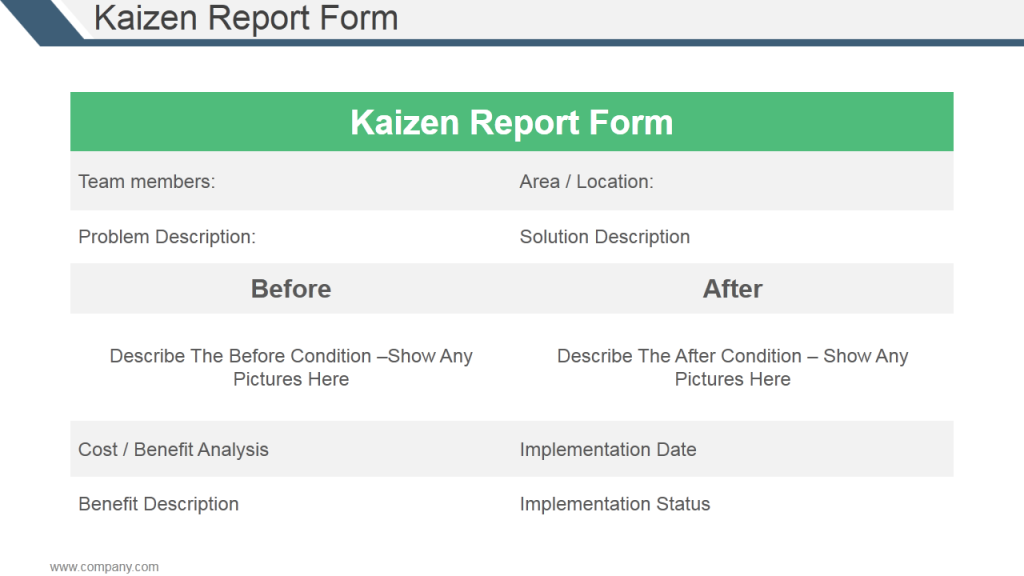
At the end of the first cycle, show the Kaizen before and Kaizen after so that everybody in the organization knows the result of their efforts:
Download the Kaizen Report Form
Got your dose of motivation from this simple but powerful philosophy to bring your business on the path of improvement? Get started by using the Kaizen ppt templates and process we have compiled under one PowerPoint file for you.
Try out our latest designs for inspiration…
There is no dearth of creative designs at SlideTeam. So when it comes to raising business efficiency to the maximum, the answer is our well-crafted Kaizen templates and slides. An epitome of instructional design and informative content, these templates will help you set your eyes on the right targets and strategies easily. Also, a key feature of all these stunning sets is their ease of use and practicality. So whether you are giving your team any updates on faster processing or teaching them how to eliminate waste, pick these templates to add that extra bit of efficacy to your presentations. Check out these five designs and click to download.
Design 1
Shine the spotlight on the 3MUs and other Kaizen strategies with the help of this complete deck. Replete with catchy icons and editable graphics, this template will come in handy when you want to express more than the ordinary. So get your teammates on the same page and hit the ground running when you are planning for Kaizen to improve your business. Download the template below and deploy however you like.
Design 2
You can describe a project action plan or important points of the Kaizen strategy verbally. But what will really make a difference is presenting facts and figures with a help of good visual aids like this full-fledged Kaizen template designed by our experts. Take the help of this impeccable set to outline all important aspects that your team needs to work on when bringing in the Kaizen perspective to the table. Download and start personalizing this template right away.
Design 3
Illustrate the difference between traditional and Kaizen modes of running a business with the help of this well-defined template. Containing just 12 slides, this template will help you explain key aspects of your strategy like event planning, process management, and the 5S framework. You can also highlight the reforms in the manufacturing process and general work practices to jack up those numbers. Plan ahead and present to perfection.
Design 4
Should you feel the need to dive deep into Kaizen PDCA quality improvement techniques, you can download and deploy this handy template. You can also elucidate factors like objectives, evaluation schemes, and productivity to give your team a competitive edge over traditional businesses. Additionally, you can freely edit the contents of this 55-slide PPT template. Feel free to chuck out the slides you do not need. Also, personalize it as much as you like.
Design 5
Let this functional Kaizen planning PPT template be your guide in the time of uncertainty. Download this 80-slide template detailing product management and quality control practices for your conglomerate. The visually-appealing design is also fully editable, so you can easily include your brand themes in your presentation. You can also rearrange the slides or reproduce the layout in the form of printed handouts for better clarity on the subject. So download it now!
So there you have it. Deploy these modern designs of the Kaizen framework for business planning and execution to ensure a smooth ride to success. Let us know what you think of these templates in the comments below.


 Customer Reviews

