


 Customer Reviews
Infographics have been quite a buzzword in the design world since the last 5 years or more. Seeing how internet was chock-a-block with textual information and realizing how most web readers quickly left a piece of information that was just textual and ignored piles of data, designers and communicators embraced a visual form of presenting information.
Combining Information and Graphics aka infographics, designers started showcasing numbers with easily understandable graphs and other data visualization. Not just that, text was also treated as a visual element with varying font sizes, font type and color contrast. The information was not a monotonous chunk of gray text or numbers anymore. The result was marvellous! Infographics were a hit amongst audience.
As presenters, what does that mean for us? Should we ditch our presentations and start showcasing infographics on stage? No. We need to embrace the winning formula of infographics and apply the same to our PowerPoint slides.
Power of Infographics:
To explain the same with an example, which is easier for you to read and absorb:
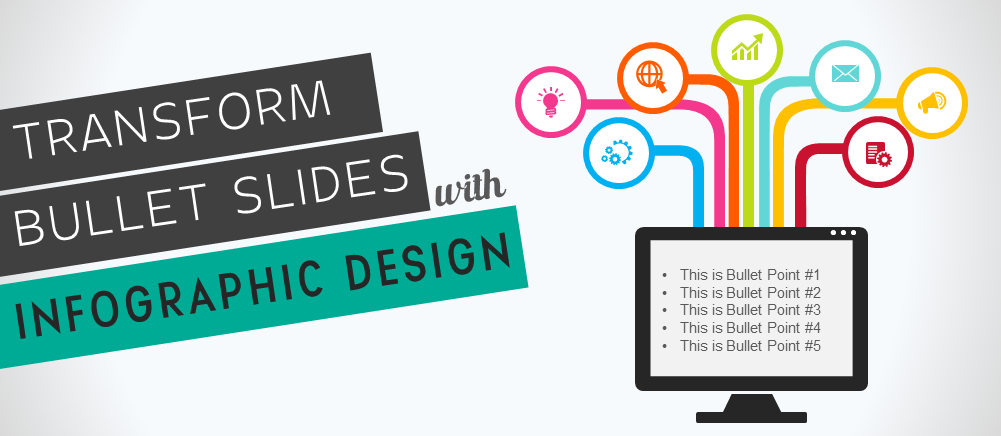
Bullet Points:
- Infographics can drive 250% more web traffic than ordinary blog post with pictures
- Infographics are shared on social media 40x more than any other content
- Infographics are read 30x more than text articles and remembered more
- In just 2 years, infographics search volumes has increased over 200%
- 60% of consumers contact business after seeing images and infographics
Or an Infographic Design:
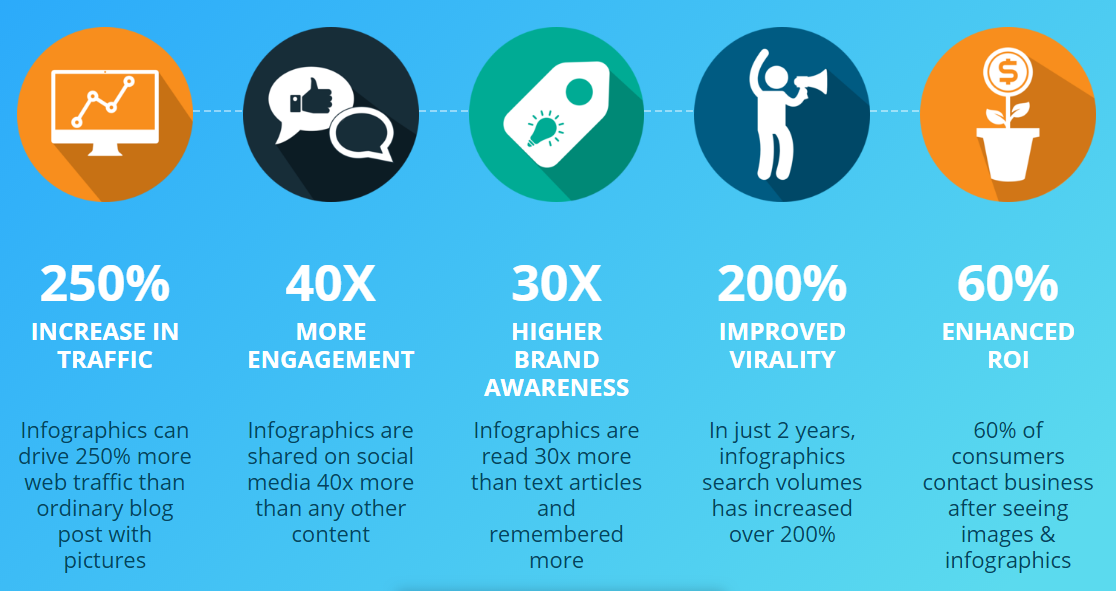
Where a PowerPoint slide is concerned, it is definitely the visual, infographic design that will create more interest than a bullet-point slide. As you can see, text is retained in the infographic style too but the power of text has been amplified by highlighting the most important points and supplementing the same with icons.
How to Apply Infographic Design to PowerPoint Slides:
#1- Use Data Visualization
Numbers in themselves are uninspiring. For many in the audience, they are a traumatic reminder of mathematics and the struggle with it in school. Even those accustomed to it need time to find insights from numbers. When you visualize this data, however, every tom dick and harry understands the insights from data. That’s what infographic designers do. They turn boring numbers into exciting, visual stories.
Choosing the right data visualization tool is also important. If you want to show changes over time, for example the comparison of revenue across the year, a column chart is the most simple and effective visualization for the same. Besides choosing the right chart, you need to ensure it looks clean and elegant. See the messy and the clean version of a column chart to know what we mean.
Where percentage completion of a task is concerned, a doughnut chart is the most effective visual display. Check out the difference between a boring number slide and a visual, infographic slide:

Download this Editable Doughnut Chart Slide
Did you see how visualization makes data so easy to digest!
Pie charts are another common yet easily understandable visualization for comparing parts of a whole. However, if you have percentages which do not add up to 100% (when respondents can choose more than one option in qualitative surveys), a circular chart like the one below makes the findings so much more interesting than plain bullet points!

Use this Data Driven Circle Chart for Your Data
#2- Play Up the Numbers
Numbers add punch to your content. They are hard facts. Needless to say, numbers supported by researches and surveys carry more weight than random numbers thrown around. Statements like “We will help you grow your business by 70%” are superfluous and carry no credibility. On the other hand, statements supported by another body are credible and impactful. Client testimonials such as “The company helped us achieve 33% more ROI in last 6 months” are useful and should be emphasised in your slides.
Check out how numbers are played up huge in infographics. Apply this design hack on your slides and make your content more hard hitting:

Download the Complete Big Data PPT
Finance presentations are full of numbers. Actually, every business deck has a numbers slide be it your pricing, performance, KPIs and performance metrics. Highlight the most important numbers with a big font size and different color so that audience sees them first. Here’s an example from real estate slide that looks like an infographic:

Download the Complete Real Estate Presentation Here
#3- Use Diagrams/ Shapes
Infographic designers employ a numbers of shapes be it a circle, triangle, or rectangle to highlight important text. The shape adds visual touch to the gray matter and entices the audience to read the content.
The type of shape also adds movement and flow to the design. A circular diagram makes the audience read the content distributed around it in a circular fashion. This is great if the content is describing a cyclic process, for example PDCA - Plan, Do, Check, Act Cycle. In such cases, the shape you have chosen adds more meaning to the message. Here is another example:

Use this Steps PPT Diagram for your Presentation
Many a times, you will face confusion as to which diagram to use for your text slide. If you have headings (which is a good practice to have), then you can take a circular or rectangular diagram to structure the content. Also, try to keep the content to as minimum as possible. Remove long descriptions; keep the same for your talk.
Take this example of PESO Model below. We have chosen a circular layout but you can choose a rectangular linear layout too.

Use This Editable Circular Template
Diagrams and creative layouts distribute the content neatly around the slide. They leverage the power of white space or negative space such that there is enough breathing space between shapes and text, between heading and body content, and so on. On the contrary, a bullet point list looks cramped.
Any text slide can be designed in multiple ways using just shapes. Check out the article shared below to see different variations you can create of a single bullet-point slide:
2 Minute Slide Challenge: From Boring Bullet Points To Stunning Designs!
#4- Use Icons
Simply adding icons to your slide greatly enhances the look of it. Icons are small visual representations of a topic and are universally understood. A loudspeaker icon denotes an announcement or marketing strategy. A muscle icon denotes strength or advantage, a broken chain shows weakness, a bulb symbolises an idea or opportunity, and a bomb clearly represents a threat.
Infographic designers use icons heavily to add visual interest to the story. We can do the same in our presentation slides too.
![]()
You can combine one or more icons to create your unique icons. Being editable, you can change their colors to match your color scheme.
![]()
Download this Referral Marketing Slide
#5- Use Vector Graphics
Check out infographics on the web and you’ll find plenty of vector graphics used to explain content. You’ll find very few infographics that have real images called raster images (made up of pixels). These images can become blurry if enlarged too much. On the other hand, 99.99% of infographics have vector graphics (usually in the form of EPS, SVG and AI files) that are made up lines, points and shapes. These do not become blurry, no matter how much you stretch it.
Another advantage of using vectors is that they are fully editable and you can customize them as per your requirement. You can download them from Shutterstock or any other image website. If they are Adobe Illustrator files, then a little knowledge of this software becomes necessary.
You’ll find vectors in our collection of PowerPoint templates too. These vector graphics have been created by our PowerPoint designers in PowerPoint and available for download in PowerPoint format. Here’s an example:

Download this Brainstorming Slide
Vectors look modern and they make your presentation slides look modern too. They are also very light in size as compared to raster images (PNGs and JPGs). So, no matter how much you use these graphics, your presentation will not become heavy.

Download this Mountain Summit Vector Graphic
#6- Use Images
You might not be comfortable with downloading vector graphics from a website for your PowerPoint presentations since they are in the format of SVG, EPS and AI files. In that case, you can use real images. They are easy to use - simply download them and add them to your slide.
Besides, since you will be downloading a high resolution image, the problem of pixelation won’t arise in presentations. We usually advice presenters to make images bleed (cover the complete slide area) but where infographic design is concerned, you can ignore that. The idea is that the image should be big enough to be clearly visible.

Download this Our Goals PPT Template
If you have 3-4 points, you can use an image for each. For getting that infographic look and feel, insert the pictures into a shape be it a diamond shape, triangle, circle or rectangle as you can see in the above example and the below one too:

Download Vision Mission Goals PPT Template
#7- Use Color
You have already seen from the above examples the role color played in lifting up the designs. Colors add life to a design. But hold your horses. Don’t get overexcited from now onwards to fill every shape and text with different colors. One has to carefully choose a color scheme that matches the tone of your presentation content. Choose not more than 2-3 colors for a slide.

Knowledge of the color wheel and color schemes can greatly help you pick the best color combinations for your infographic slides. You can choose between warm (colors that excite such as red, yellow and orange) and cool colors (colors that relax such as blue, green and purple) to influence audience’s emotions. You can choose one warm and one cool color too as we have done in the project management slide below:

Download the Project Management Slide
The same color scheme was used in our complete PowerPoint presentation on New Business Marketing Strategy. A vibrant color scheme, it is hard to ignore these slides.
Infographic design trend will help you create a classy design, be it a slide or a flyer. There are thousands of PowerPoint shapes, design layouts and graphics to draw inspiration from. Check out our collection of presentation designs to create captivating infographic slides:


