





 0 Comment
 Customer Reviews

In today’s evolving business ecosystem, real-time insights, especially performance metrics are not a luxury, they’re a necessity. From worldwide established businesses to fast-scaling startups, companies are navigating complex processes, using business intelligence, cross-functional teams, and strict deadlines. What makes the difference between success and stagnation is the lack of procedure management visibility. That’s where a competent procedure dashboard comes into the picture.
Imagine having a single, all-in-one view of performance metrics, workflow dashboards, task management, and data analytics. No more jumping between tabs, multiple spreadsheets, no more waiting on reports. With the right dashboard software, your teams can do process visualization, improve operational efficiency, and make smarter, data-driven decisions instantly.
This blog presentation syncs into a curated set of must-have dashboard templates. Whether you're streamlining project management tools, tracking process improvement initiatives, or optimizing reporting dashboards, these templates offer smooth data integration and compelling visuals.
The best perks of these templates are that they are customizable, content-ready, and editable. Each template is designed with eye-catching graphics using pie charts, tabular presentations of data analytics.
Having a structured approach with measurable effects is no longer a dream, since you have these production dashboard templates handy and ready to be deployed.
Let’s explore!
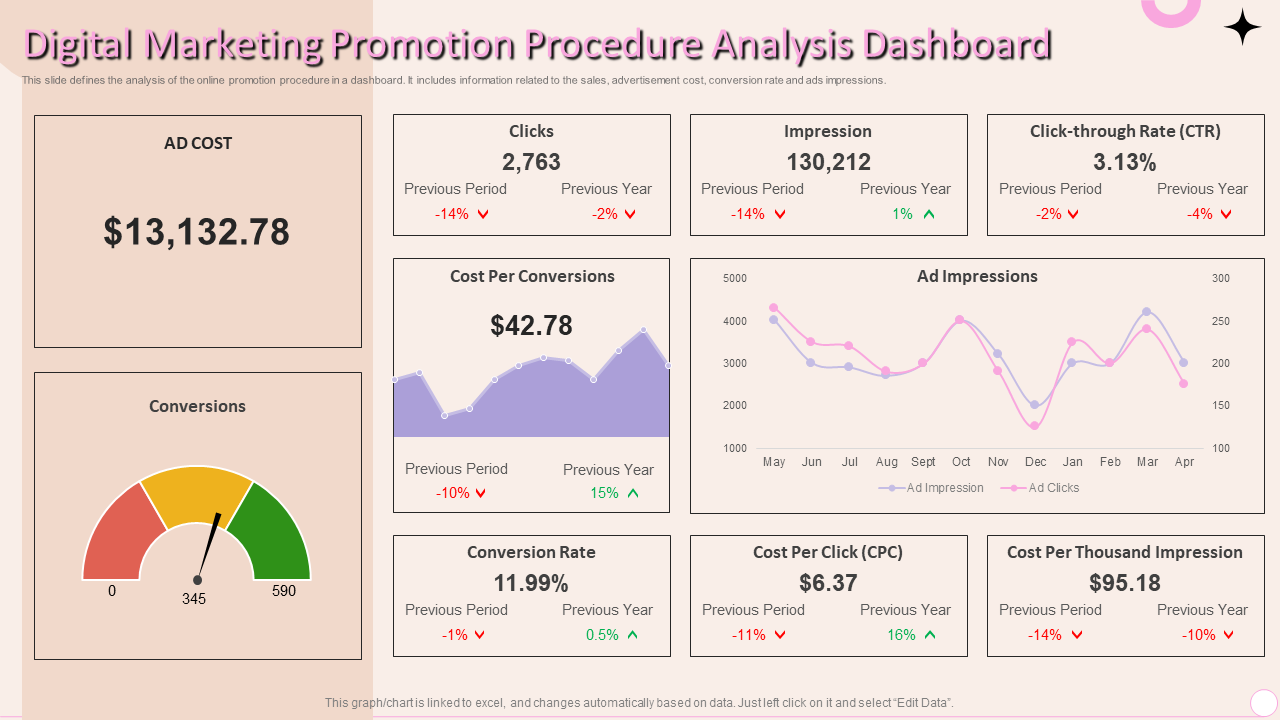
Template 1 Digital Marketing Promotion Procedure Analysis Dashboard
Are you planning to run a digital marketing campaign for your business but unable to find an effective tool that tracks all the metrics for you? Take a pause, your search is over!
This premium workflow dashboard PPT Template helps you with data analytics of elements of your online campaign and also serve the purpose of procedure management software dashboard. This includes relevant KPI tracking, such as the ad cost, conversions, number of clicks along with the percentage in previous period and year, impressions in the previous period and year, percentage of click-through rate in the previous period and year, cost per conversions, conversion rate, cost per click, and the cost per thousand impression. The template has a special graphical space to present monthly ad impressions and clicks. Grab this template to make real-time monitoring easier and achieve operational efficiency.
Let your data speak!
The journey to operational excellence starts with clarity and our Procedure and operations Dashboard Templates bring just that. With clean designs, bold data visualization, and a focus on real-time process improvement, these templates help businesses make thriving decisions swiftly and more confidently.
Each slide is like a strategic asset, fully editable, content-ready, and equipped with appealing layouts that support everything from task management to collaboration tools. With seamless data integration capabilities, they function as both a presentation tool and a live reporting dashboard.
Are you the one leading a project review, or presenting KPIs, or analyzing workflow dashboards in your company, these templates are your plug-and-play solution to better storytelling and smarter execution. Don't let process chaos slow you down, equip your team with tools that drive outcomes.
FAQs on Procedure Dashboard
1. What key components are included in a procedure dashboard?
A procedure dashboard includes KPIs, task status trackers, timelines, workflow stages, and real-time data visualizations. It integrates with other project management tools to provide updates on task progress, resource allocation, deadlines, and process health. Many dashboards feature collaboration tools, alerts, and reporting capabilities, making it easier to align teams, monitor performance, and maintain consistent procedure management across departments.
2. How does a procedure dashboard help in monitoring workflow efficiency?
A procedure dashboard enhances workflow efficiency by providing a view of operations in real-time. It visualizes each stage of a process, highlighting bottlenecks, delays, and completed tasks. This allows managers to identify inefficiencies, redistribute workloads, and make informed decisions. By tracking performance metrics and automating reporting, dashboards support continuous process improvement, improve accountability, and ensure all teams are aligned toward achieving operational goals efficiently.
3. What types of procedures are commonly tracked on dashboards?
Procedure dashboards are used across industries to monitor both routine and complicated processes. Commonly tracked procedures include onboarding workflows, quality assurance checks, compliance tracking, incident resolution, procurement cycles, and project lifecycle stages. In healthcare, manufacturing, IT, and HR, dashboards help visualize standardized protocols, monitor SLAs, and ensure regulatory compliance. Their flexibility makes them ideal for tracking any repeatable, measurable, and goal-driven procedure that benefits from data-driven insights.