We all understand that effective communication is essential for success, but have you ever considered how graphical, or infographic data may be used as a communication tool? Yes, it sounds exciting to note that communicating while sharing data is one of the most common business practices.
You understand sales, expenses, revenues etc. while using graphics like pie charts or any other visual. Pie charts are frequently used to show proportions among various categories, including expenses, demographic groups, and survey results, in business presentations and education. It enables the viewer to swiftly absorb information or perform an immediate analysis by allowing them to compare facts easily.
Pie charts' key advantage is that they are simple to understand. They make it easy to compare data quickly and simplify complex data efficiently.
Another advantage of pie chart is its ability to present facts into a concise manner that may be used as a component of a bigger narrative. Additionally, a pie chart can be used to assess corporate growth in areas like revenue, benefits, and exposure.
Use our pre-made pie chart presentation templates for summarizing your long data adequately and understandably.
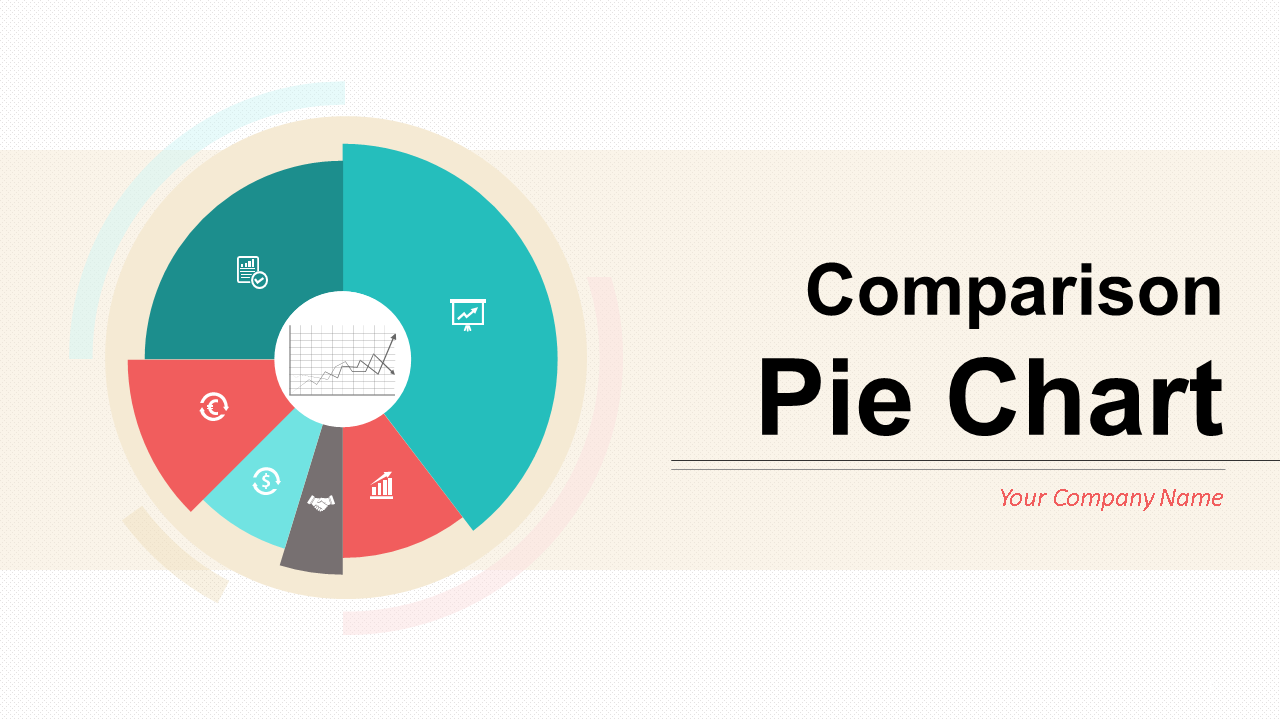
Template 1 – Comparison Pie Chart Arrangement Residential Industry Agriculture Branding Web Design
This is a content-ready PowerPoint template for businesses looking to present complex data in a visually appealing and easily digestible format. With our irresistible pie chart templates, showcase sales figures, market share, budget allocations, and more. These dynamic visuals captivate your audience's attention and provide instant insights at a glance. Our pie chart templates empower you to simplify complex information, make informed decisions, and effectively communicate your business's performance. Get ready to slice through the noise and present your data with confidence, clarity, and impact. It's time to let your numbers tell a compelling story with our ready to use pie chart templates.
Template 2 – 3D Graphs Business Bar Chart and Pie Chart with Icons
Knowing about the growth and lows of the business is essential. Many of us fail to estimate it as some days we are not equipped with accurate data. However, there are no more worries about it as we have come up with new Pie chart template to allow you to manage your data and statistics properly. This comparison pie chart explains the sales of the product and services along to enhance the position of the business ahead.
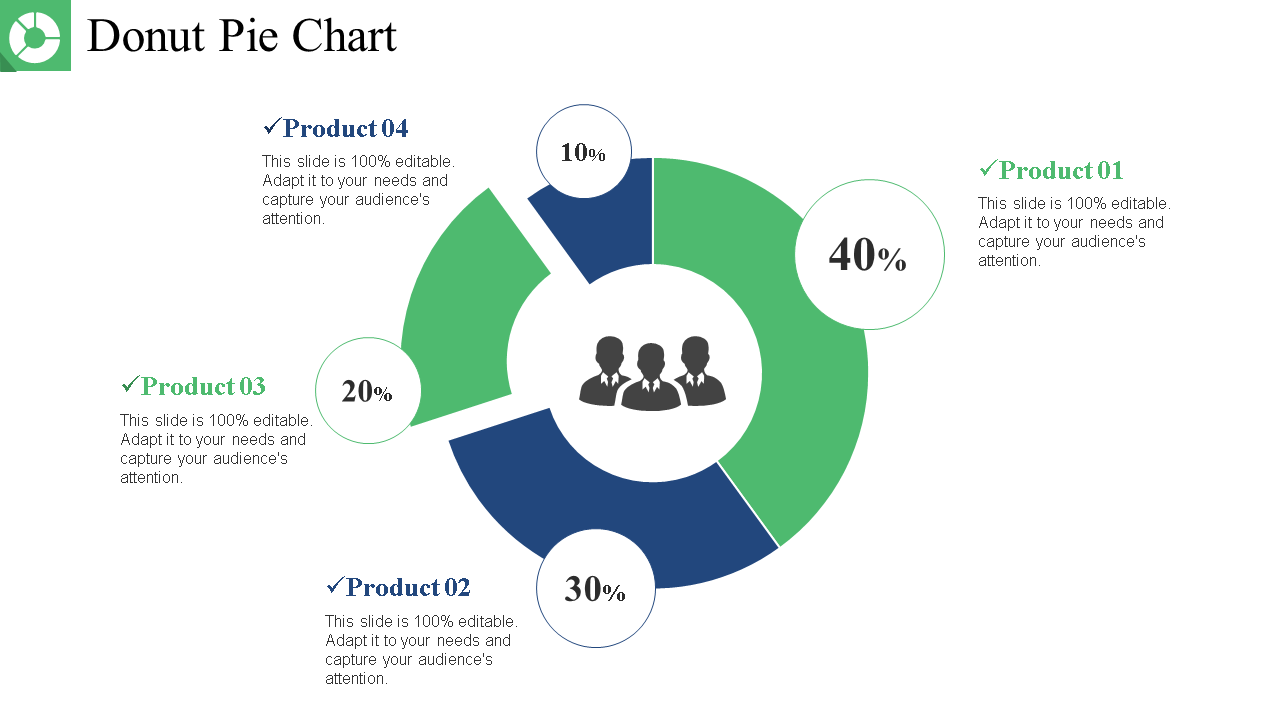
Template 3 – Donut Pie Chart Presentation Layouts
Who doesn’t want to divide the work as per the need and time but often times fails to do so because of many tasks over loaded? Here we provide a quick fix to your schedule by launching Donut Pie Chart. SlideTeam's Donut Pie Chart assist in managing and presenting the data in a systematic order and nuanced way for a better understanding of the data. This Donut Pie Chart also allows you to segregate your product and its functionality based on percentage.
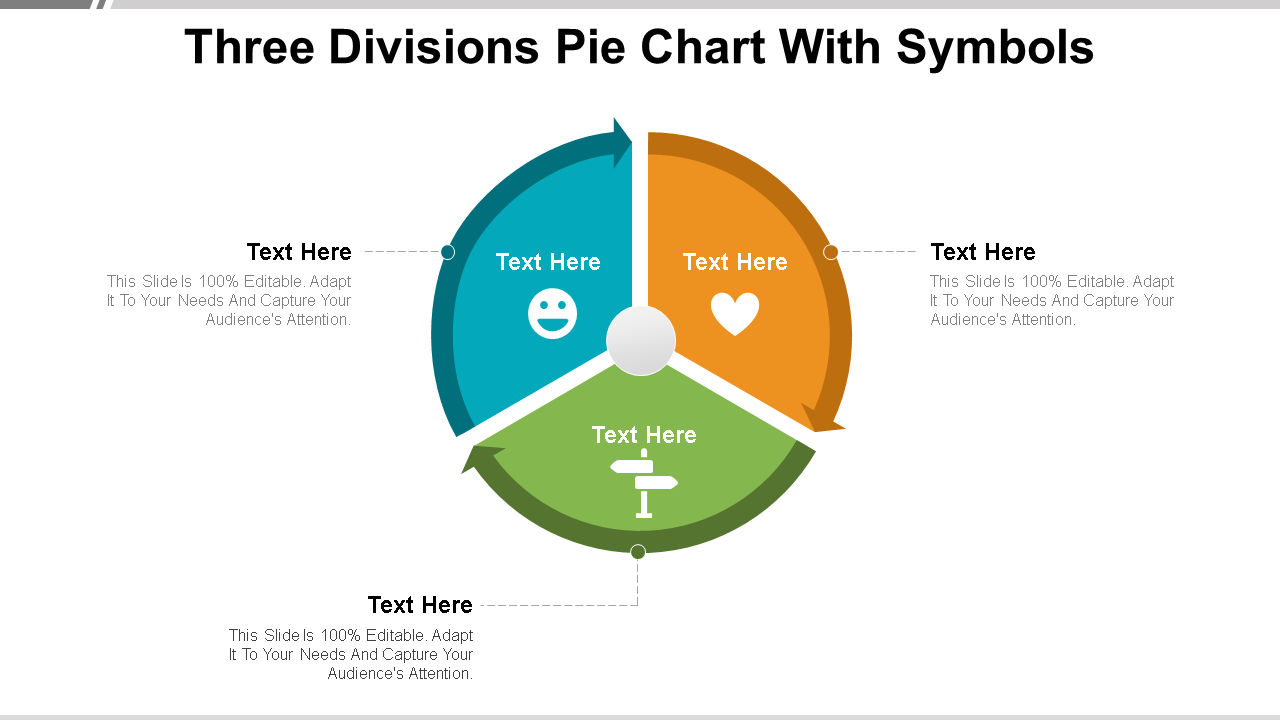
Template 4 – Three Divisions Pie Chart with Symbols
Cluttered data makes it complicated to understand the basis of any company and its objectives. Therefore, declutter your data and surround it with clarity with our amazingly built Pie chart slides. This Pie chart is actively designed to achieve all your goals and requirements for the company as we have designed our Pie chart templates divided into three segments to generate responses based on products and services delivered. This Pie Chart templates showcases customer success, customer insights, and user experience to make room for improvement and better performance.
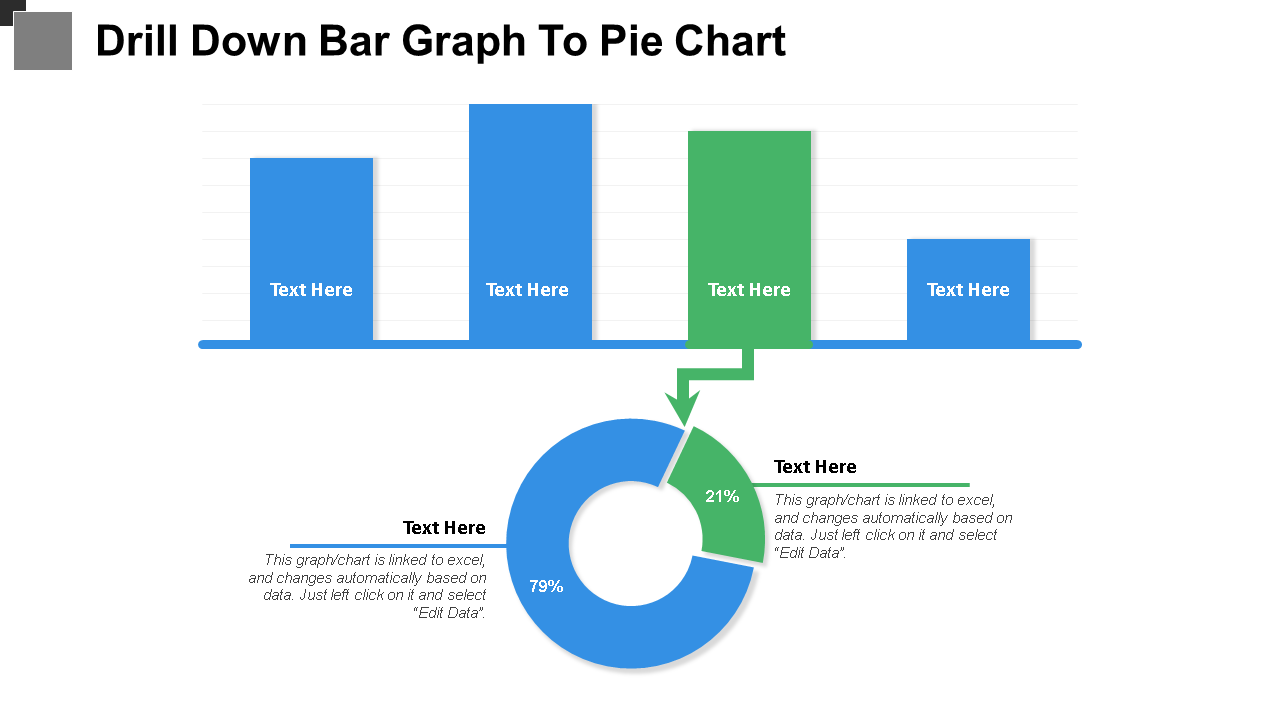
Template 5 – Drill Down Bar Graph to Pie Chart
This template acts a double advantaged weapon to understand the data accurately in the form of graphs as well as in Pie Chart Format. Business professionals can use this template to illustrate about their project KPIs along with that they can track down their growth as well as communicate their insights with the stakeholders respectively.
Template 6 – Multiple Pie Charts PowerPoint Template
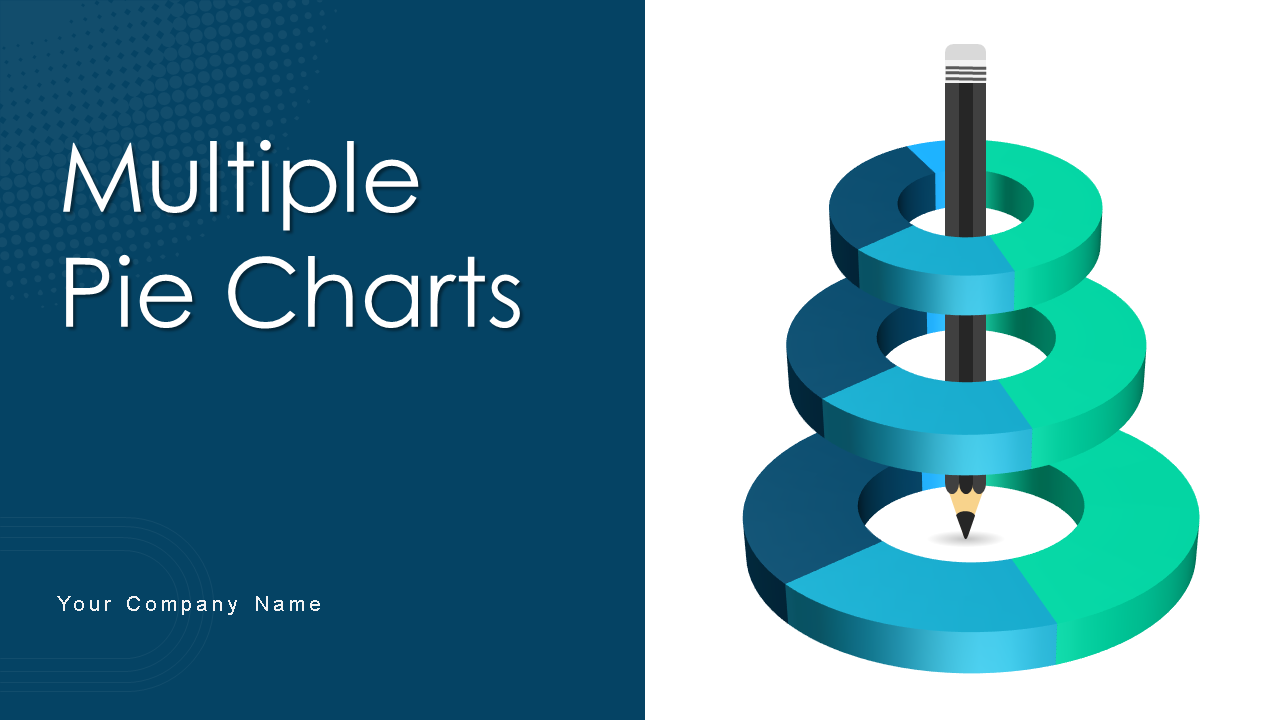
This Pie chart template can be used to cover a variety of subjects. You can display your product market shares through the pie chart sales slide to promote your marketing expenses while quarterly showing the percentage to encourage growth. This PPT slideshow encourages strategic thinking and aids in the most effective delivery of your message.
Template 7 – Pie Charts Sales PowerPoint Template
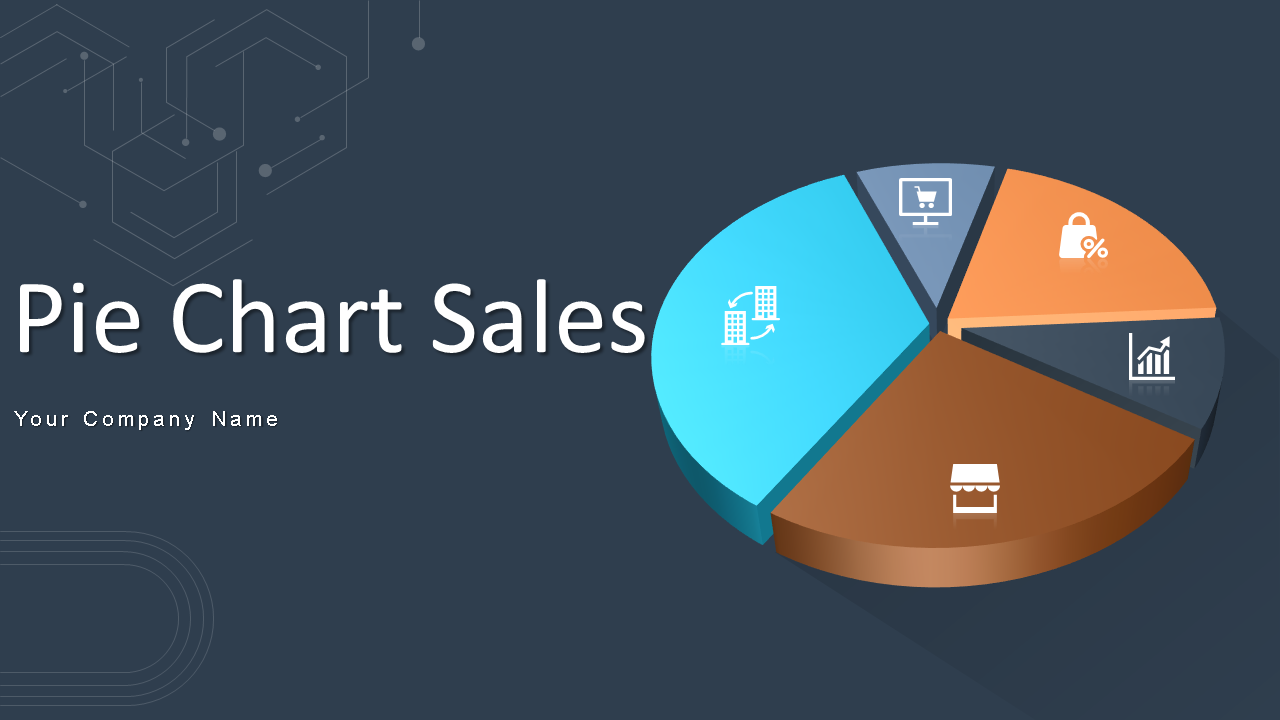
Having statistical data for better organization of data and values turns fruitful for growth, so to teach all in one, we have designed a combined pie chart consisting of statistics plan for your monthly sales analysis, sales pie chart, region-wise pie chart, and product comparison along with it. All you must do is get this Pie Chart Sales Templates to escalate your growth right now.
Template 8 – Business Disaster Risk Cause Pie Chart
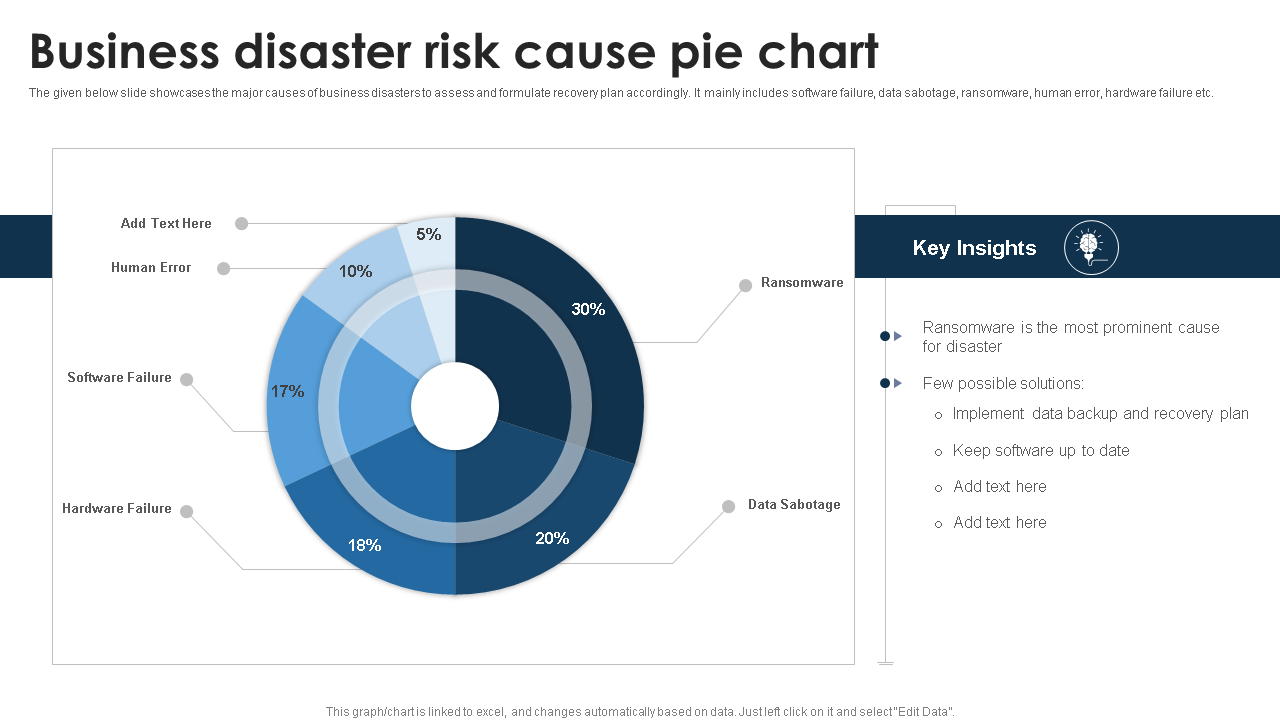
The business know-how is always essential to understand. Therefore, SlideTeam brings you ready to use PowerPoint templates to help you create an evaluation strategy to minimize and manage the disaster and risks. It primarily consists of hardware, ransomware, human mistakes, and software failures. Deploy our collection of slides for the Business Disaster Risk Cause Pie Chart to safeguard your operations.
Template 9 – Pie Chart Assets Valuation Report Branding PowerPoint Slide Presentation
Use this Donut Pie Chart to understand different department of your company effectively while studying the statics of specific department. This Donut Pie chart helps you to comprehend and contemplate multiple aspects of growth. Get this Ppt template to speed up your business .
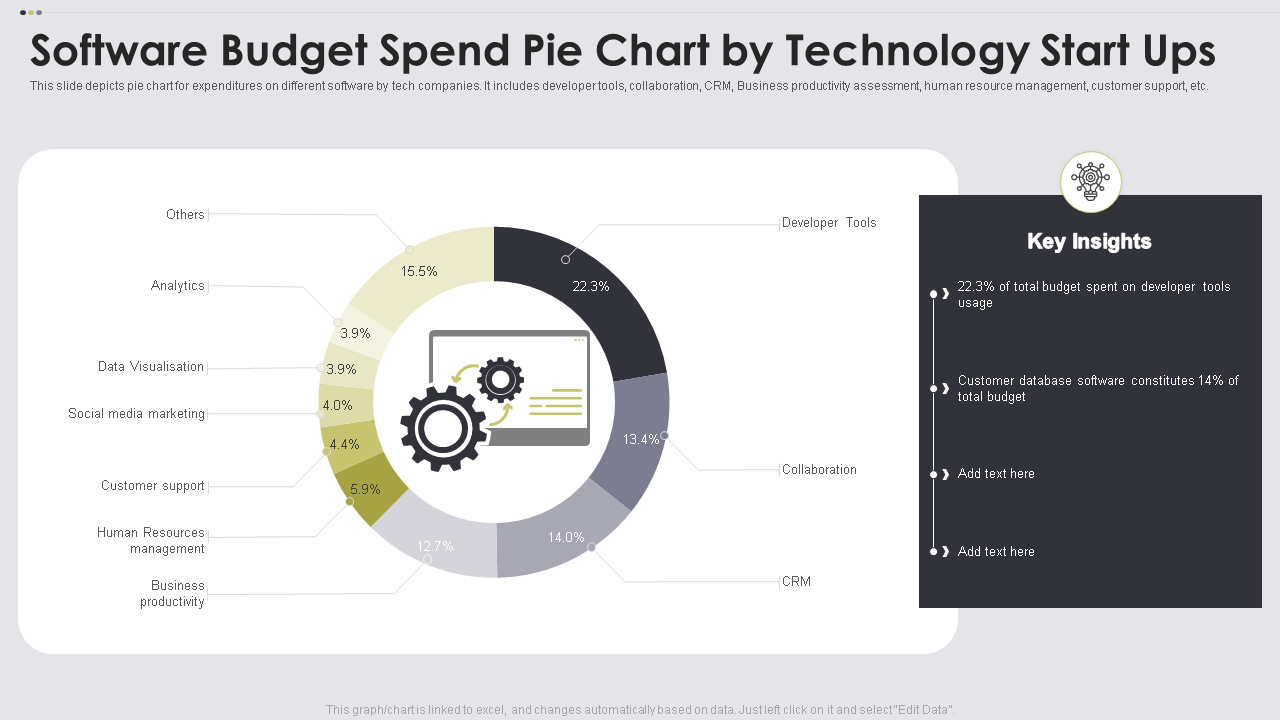
Template 10 – Software Budget Spend Pie Chart by Technology Start-ups.
It's essential to keep a note of your spending as it formulates and guides us for better savings and investments ahead. A company must undergo an assessment phase to review the network and related systems to produce lucrative results. To provide a proper mechanism, we have designed our software budget spend pie chart to organize and present the data appropriately in one place.
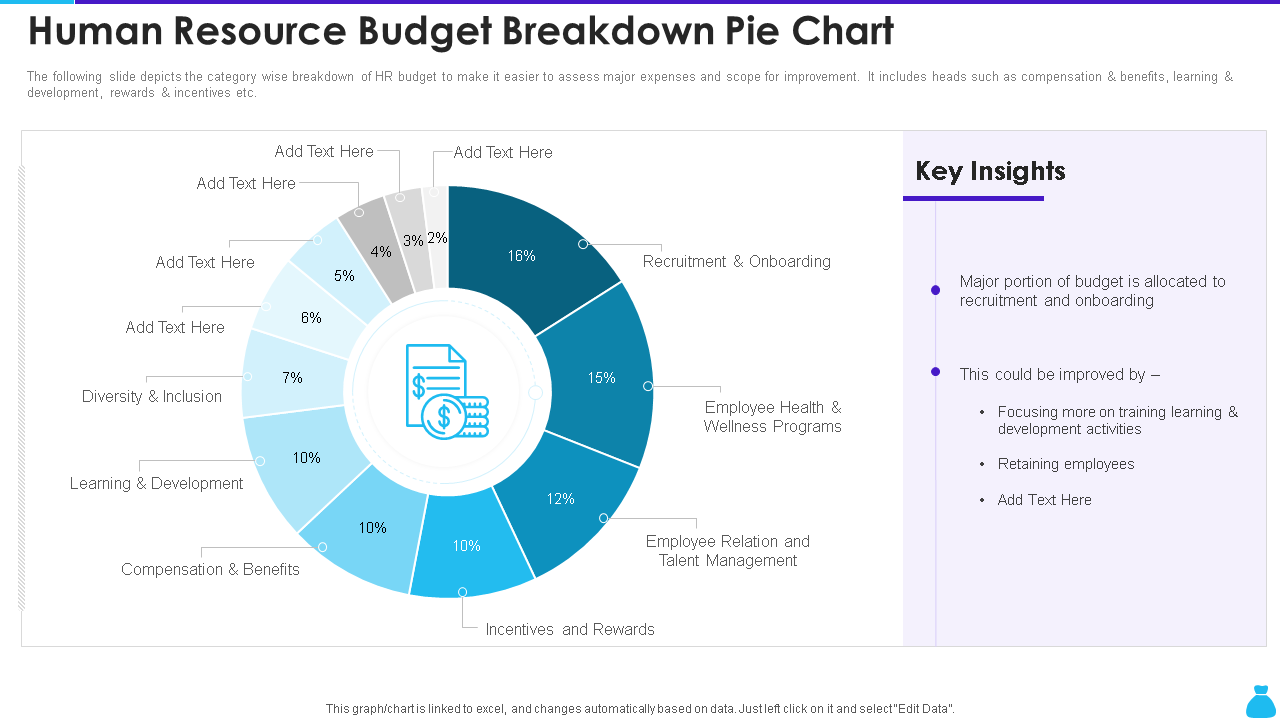
Template 11 – Human Resource Budget Breakdown Pie Chart
The HR budget is broken down by category on the slide to simplify identifying the main costs and areas for improvement. It has sections for pay and benefits, training and development, incentives, rewards, diversity & Inclusions etc. This Pie Chart Template assist to highlight the key insights about the budget allocation, employee management programmes while focusing on the learning and development aspects of the company.
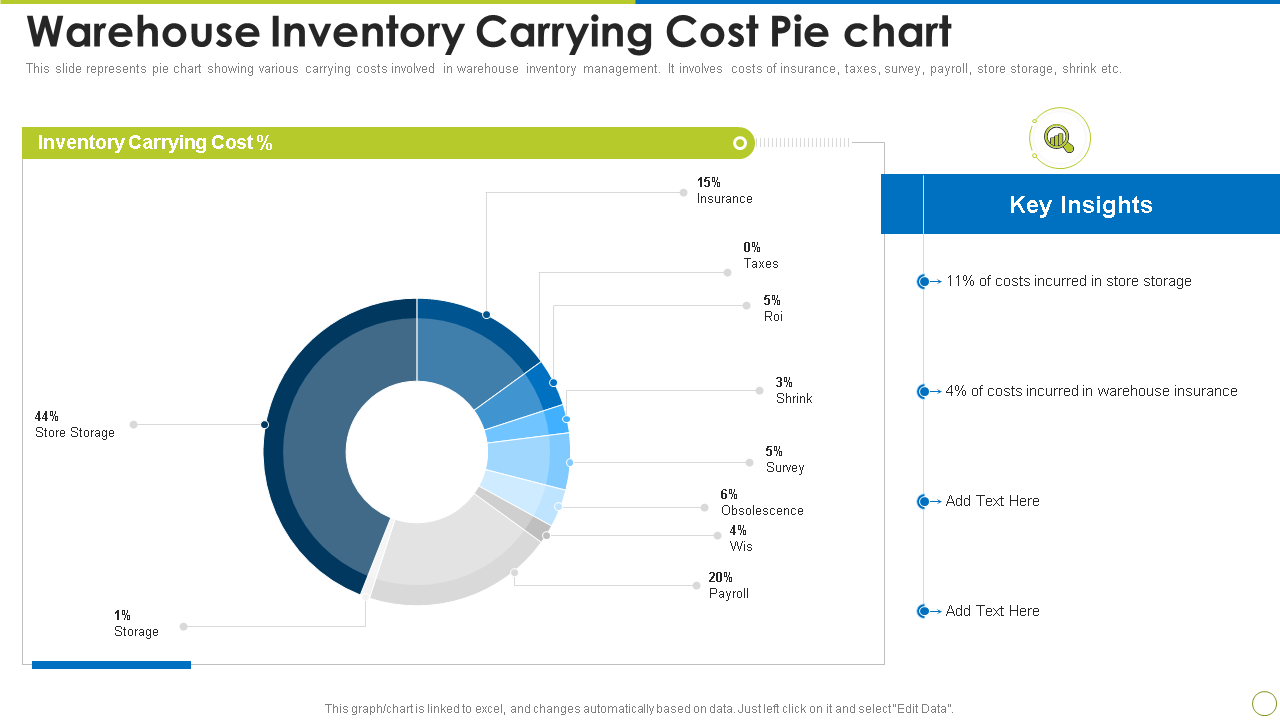
Template 12 – Warehouse Inventory Carrying Cost Pie Chart
You can choose when to modify your inventory management methods if you understand carrying cost definitions and components. This pie chart illustrates the various carrying costs of managing warehouse inventory. Expenses related to insurance, taxes, surveys, wages, store storage, shrinkage, etc., are included. Therefore, download this Content – ready PPT Template to keep tabs on your budget and expenditure to streamline your operations
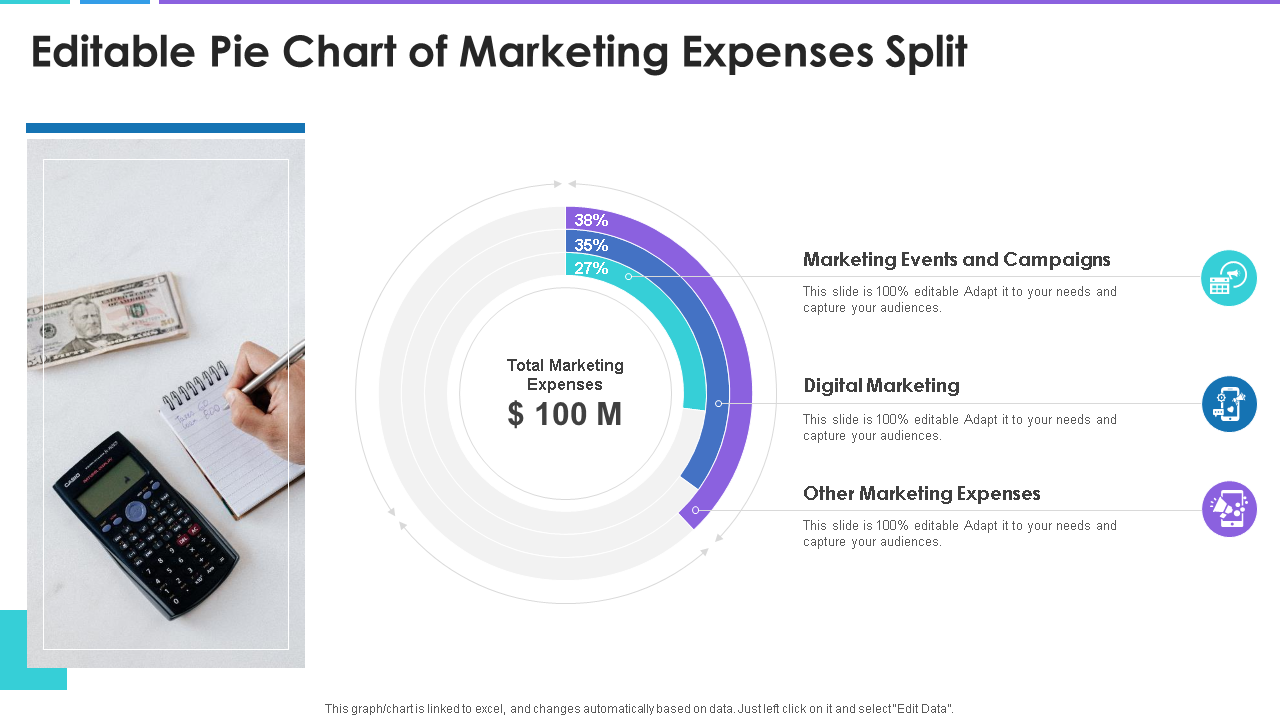
Template 13: Editable Pie Chart of Marketing Expenses Template.
Marketing is yet another essential thing for running a business. To enable appropriate marketing practises while managing the budget is crucial. Here at SlideTeam we bring you with our latest build uniquely designed Pie chart for managing marketing expenses. It showcases not only the record about the events and campaigns to understanding the parameters of success but also offer other marketing expenses.
Template 14 – Business Expense Budget Allocation Pie Chart
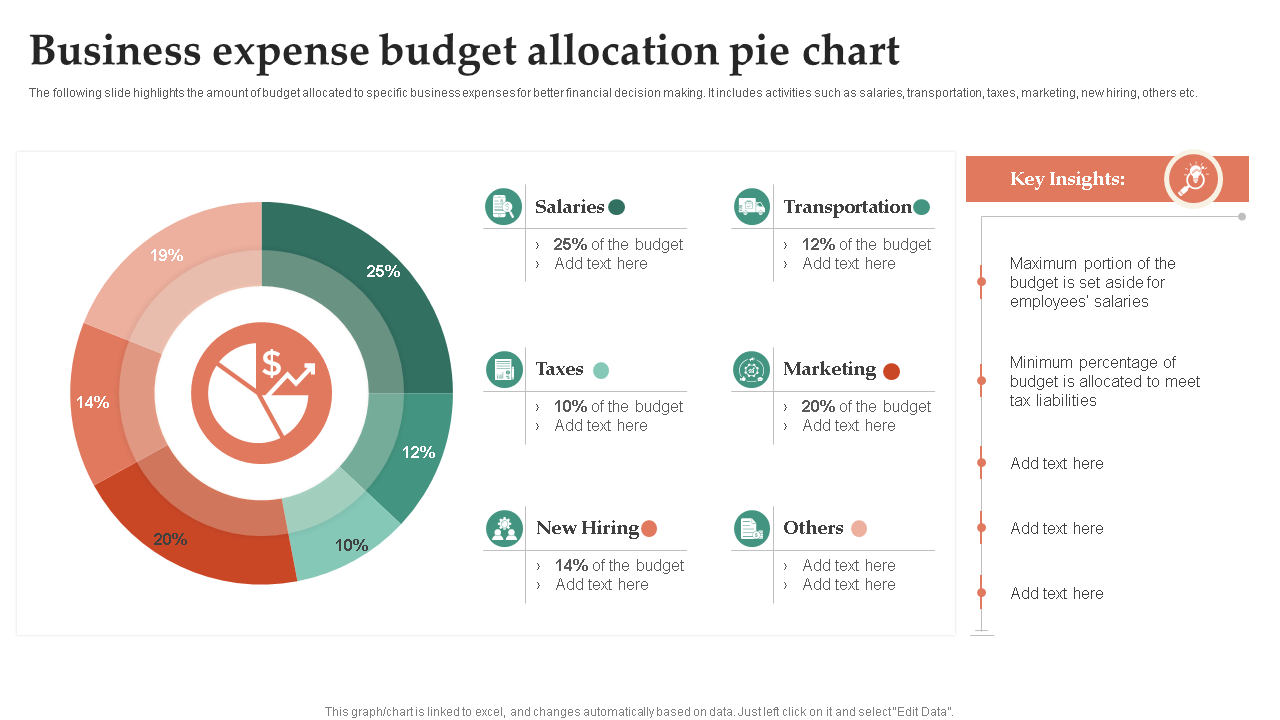
Business revenue and expenses formulate the growth of the business. To keep track of all your budget expenses and allow proper allocation of the financial expectation, we have developed this budget comparison pie chart to enable you to determine the salaries, taxes, hiring, marketing, etc. We are introducing our set of slides, which includes a pie chart showing the distribution of the business expense budget. This displays data on a particular process stage. This PowerPoint template is creatively created and simple to alter.
Template 15 – Data Visualization for Website Visits Using a Creative Pie Chart
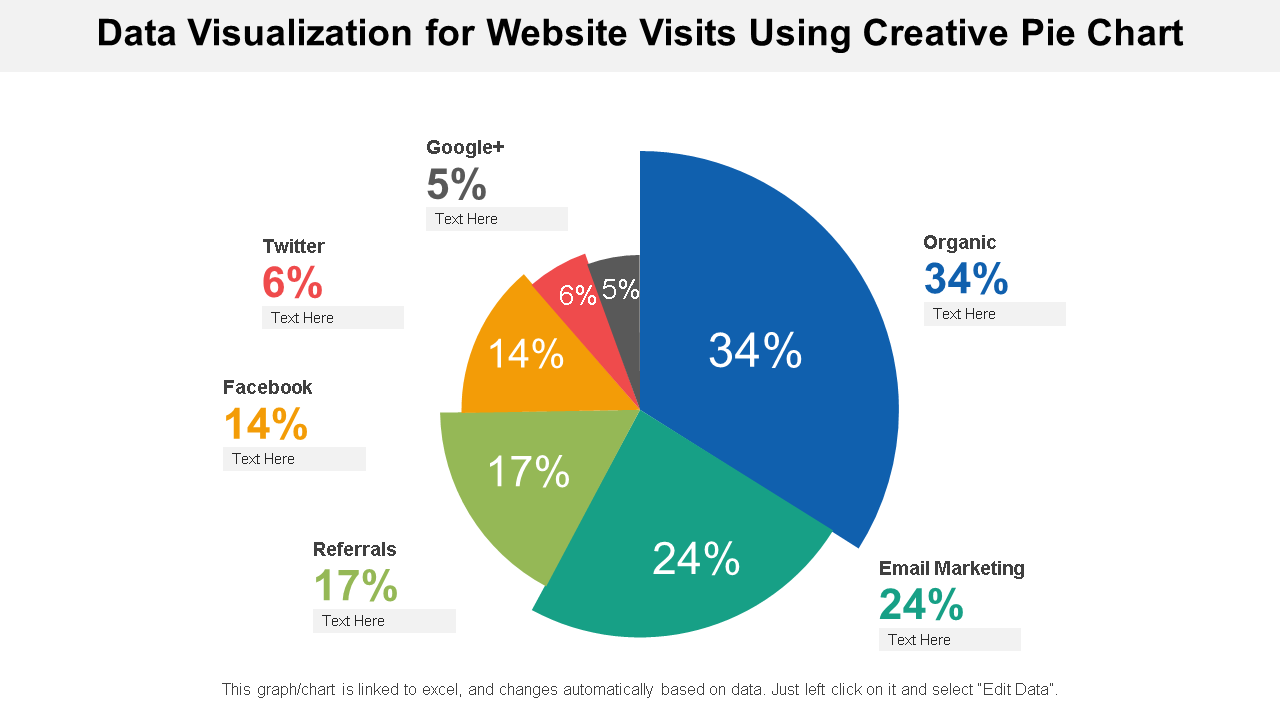
These data visualization pie charts is formerly designed to narrate growth and success while making it easier to understand by highlighting the trends. Use this ready – made PowerPoint Template and highlight marketing channels that’s stands valuable for your business. Display your growth percentage and outline the next strategic steps to reach audience as it showcases results that comprehends the socials, referrals, traffic, etc.
Template 16 – Pie Chart Professional Graphics Template
Use this pie chart template compare the performances of various departments in your company. You can visualize expenses with this PPT slide and calculate profit percentages. This slide shows the profit margin from three separate outlays and the associated sales.
Template 17 – Pie Chart PowerPoint Template
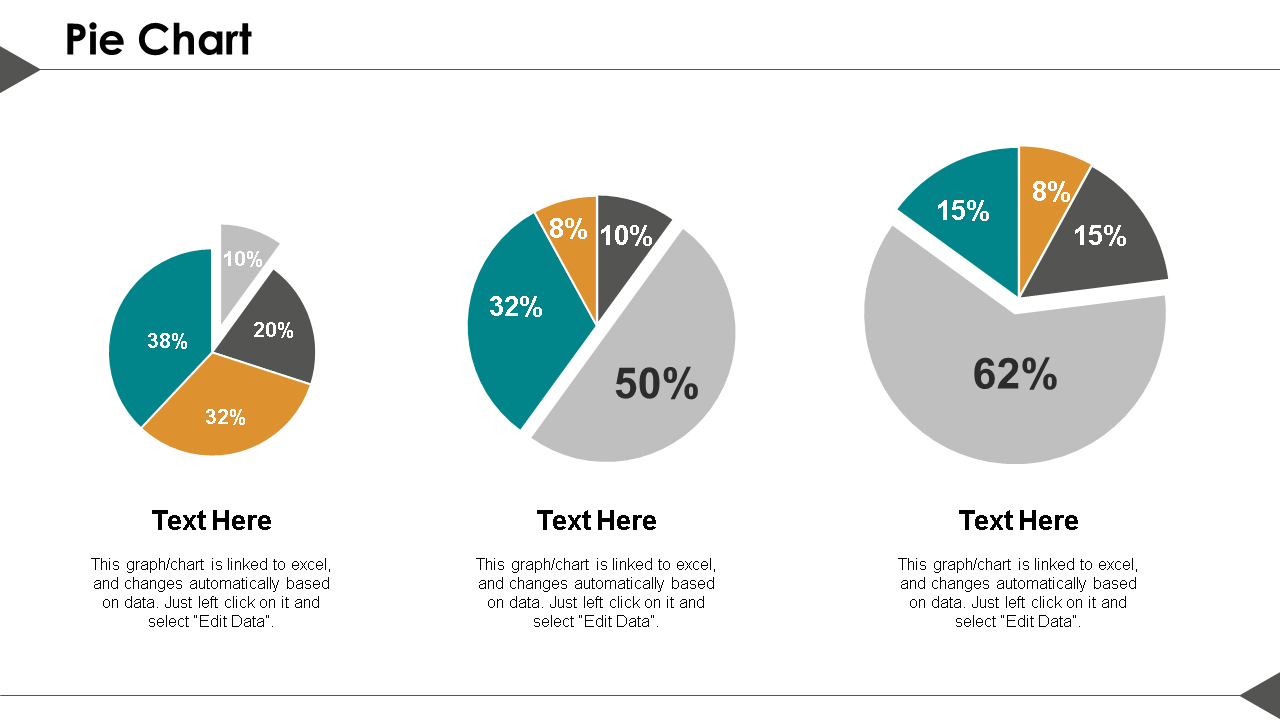
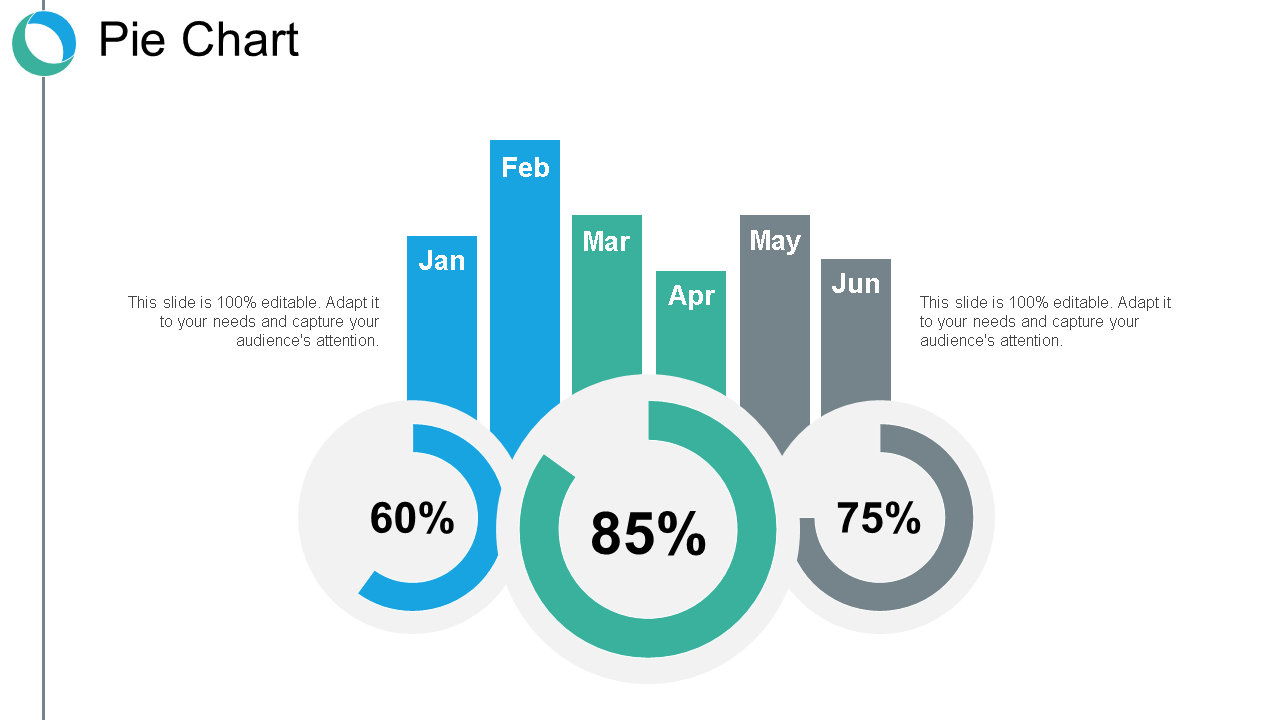
Here is another template for a multi-set pie chart that allows you to compare any three key characteristics or variables of the object of your observation. With this PPT design, theoretical or computed shares can be displayed with 100% serving as the maximum value for each attribute. Additionally, it is self-explanatory, thanks to the icons, colors, and labels.
Template 18 – Pie Chart PowerPoint Slide.
This comparison pie chart lets you understand the status and ratio of product sales while allowing you to have monthly data. You can visualize expenses with this PPT slide and calculate profit percentages. This slide shows the profit margin from three separate outlays and the associated sales. Get this Pre- designed Ppt template to raise your business scale.
Template 19 – Pie chart ppt PowerPoint Template
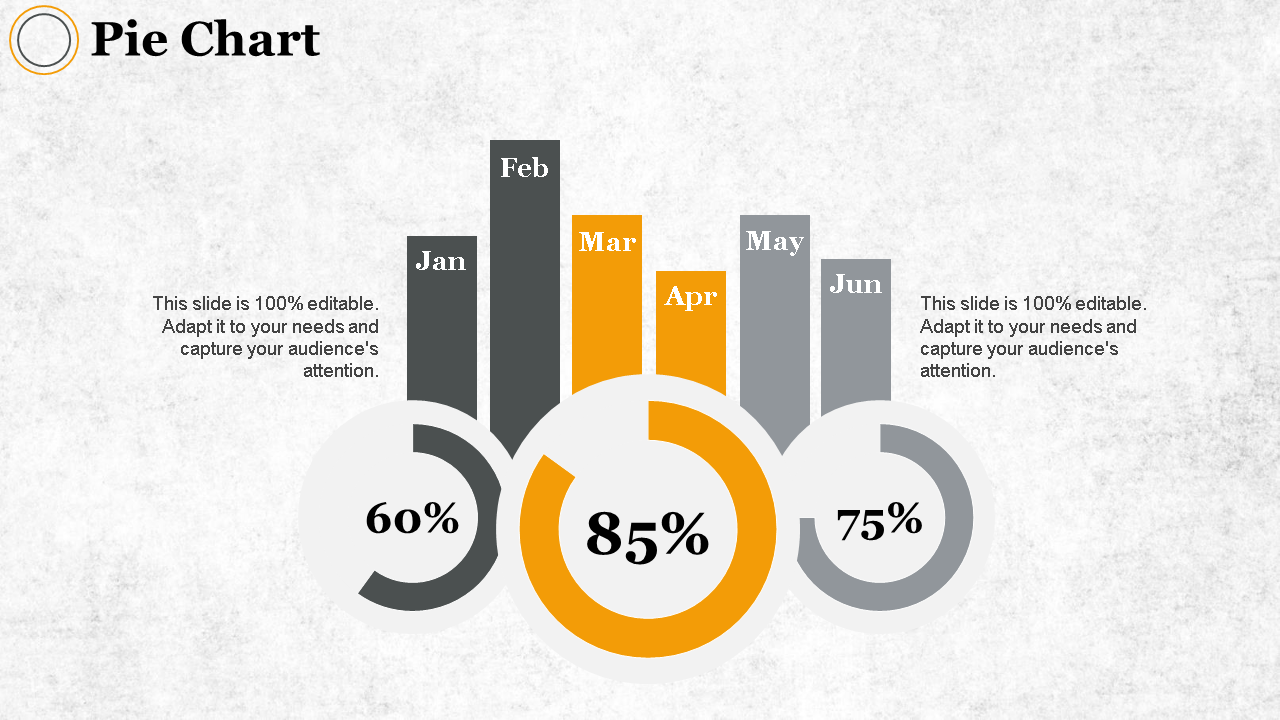
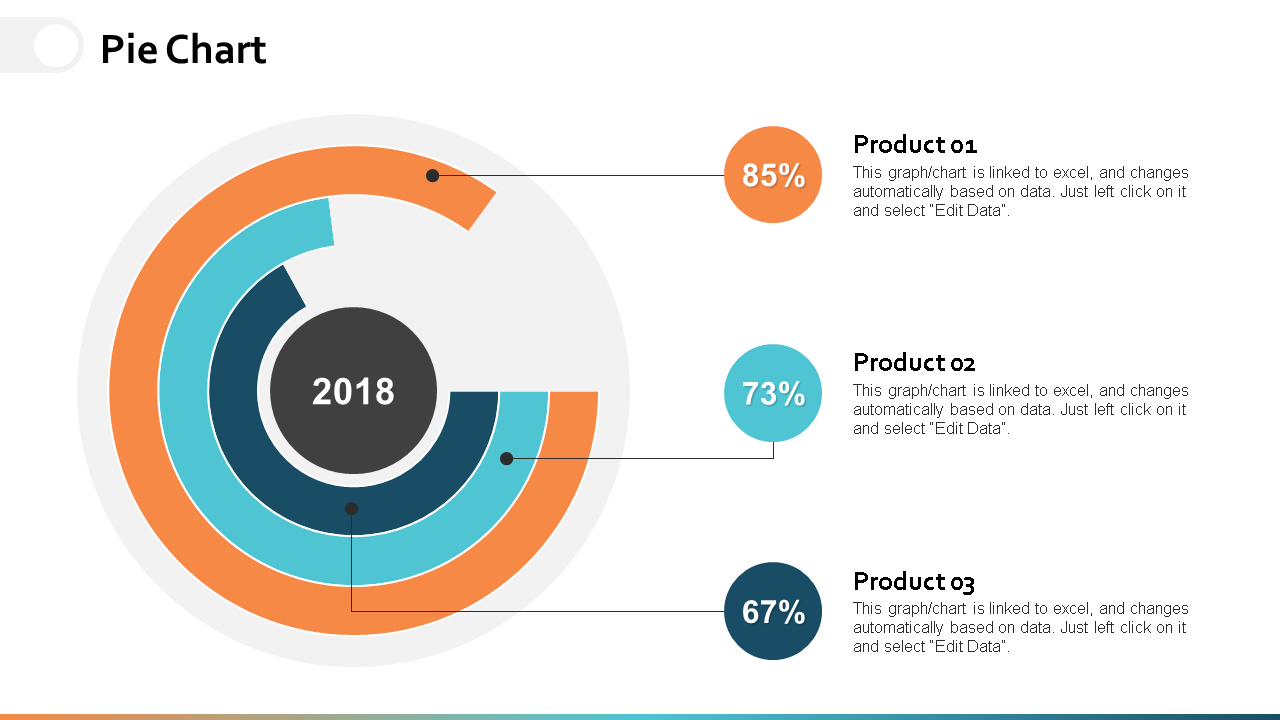
Here is yet another popular PowerPoint template for delivering yearly reports. To show proportions, use this template for a donut pie chart. The segment proportions that can be further described in the labels are determined by the percentage numbers.
Template 20 – Business Marketing Team Expense Distribution Pie chart
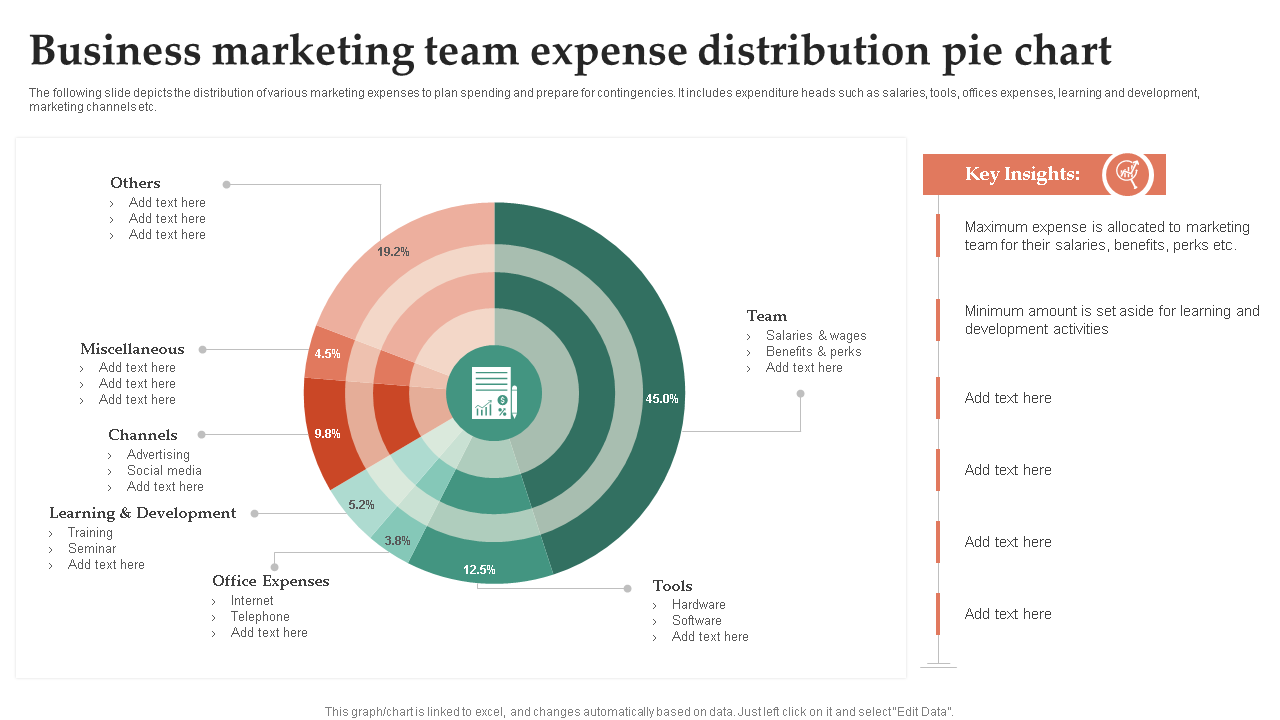
The distribution of various marketing costs is shown on the slide to plan spending and account for unforeseen circumstances. It comprises spending categories: salaries, equipment, office costs, learning and development, marketing channels, etc. We are introducing our premium collection of slides featuring a pie chart showing the distribution of business marketing team expenses. Use this PPT slide to elucidate the one stage and convey information.
Excel Your Presentation with These Colorful Pie Charts
Pie charts offer a lot of detail as they give a quick overview of a data set. Pie charts can be expanded to include more information by using numbers (such as percentages) in each segment or having a separate table as a resource. When the data content is vast, it can be challenging to compare different pie slices. Therefore, SlideTeam offers you to get your hands on their pre-designed Pie Charts that allow you to limit your trouble and escalate success. Pie charts are still typical graphics that most people can understand as they are still excellent at doing what they were designed: quickly selling a part-to-whole comparison goal.
FAQS on Pie Chart
What is called a pie chart?
A pie chart uses a circular graph to display data visually. It is one of the most famous graphs used to depict data because it uses the characteristics of spheres, circles, and angular data to represent information from the actual world. A pie chart is circular, with the Pie representing all of the data and the slice representing everything.
How is the pie chart calculated?
Measure the angle of each slice, divide it by 360, and then multiply the result by 100 to determine the percentage each piece is worth. Multiply the rate each portion is worth by the total number of data sets to get the number of data points each slice represents.


![[Updated 2023] 20 Pie Chart Templates to Draw Intuitive Comparisons](https://www.slideteam.net/wp/wp-content/uploads/2021/11/gif-1013x441-1.gif)


 Customer Reviews



![15 Interesting Ways to Use Graphs in a Presentation [Templates Included]](https://www.slideteam.net/wp/wp-content/uploads/2020/10/size1001-436-10-335x146.jpg)


