The world of marketing has changed. There are no specific rules on what or how to market a product, but there is one dominating factor that most companies still abide by – survey results!
Companies survey their customers and ask them questions about their buying habits, preferences, demographics, etc. And after sorting and analyzing this data, they tailor the marketing techniques and messages to a specific audience. These surveys can also persuade organizations to figure out which products to develop next – it might be a new flavor of pasta or a fancy jacket design.
However, companies use this research method not only for marketing but also to scrutinize customer services, sales, human resources, production, and other team activities. Consequently, the survey results help companies uncover crucial answers, evoke discussions, provide objective information, and a benchmark for comparing results over time.
But how do you structure and collate survey results?
While drafting a survey, ensure to select an appropriate method from a cross-sectional study, longitudinal study, correlational study, e-mail, social media polls, QR code, API, SMS, and others. Along with this, have strict guidelines for questions and answers, frame questions without confusion or ambiguity, don’t ask too many, and keep the survey's primary goal in mind. All this will fetch you clear and crisp information.
But how to present it to your audience?
This is where our well-structured survey results templates step in! These incredible slides will help you represent a visually appealing questionnaire to the surveyee and survey results to your management. Besides, these PPT designs are easy to use and can help you create an engaging and informative presentation quickly. So without further ado, let’s explore them one by one!
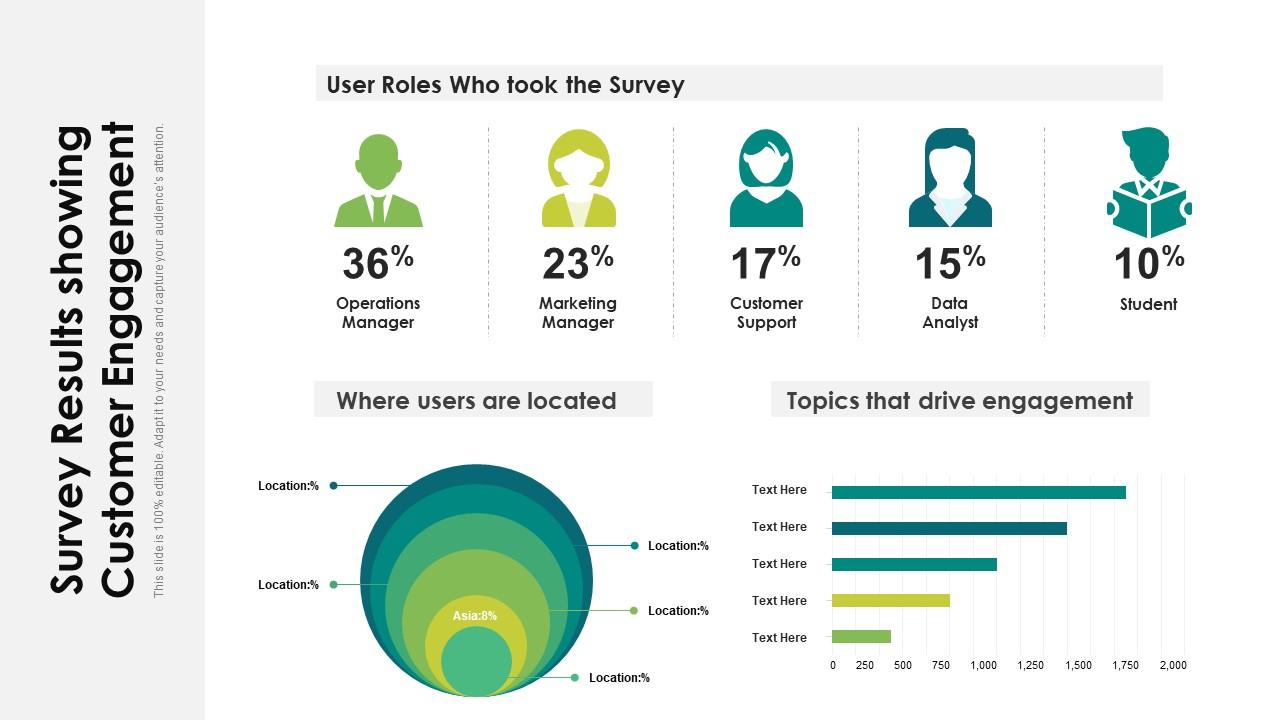
Template 1: Survey Results Showing Customer Engagement
Our template is the perfect solution for anyone who wants to display their survey results in a clear and concise manner. With a focus on customer engagement, our template highlights the percentage share of users who took the survey based on their roles, including operations managers, marketing managers, customer support reps, and more. Our PPT Slides offer insights into the roles of your survey participants and sheds light on their locations and the topics that drive the most engagement. With this information at your fingertips, you can easily identify trends and patterns to help you make more informed business decisions. Get it now.
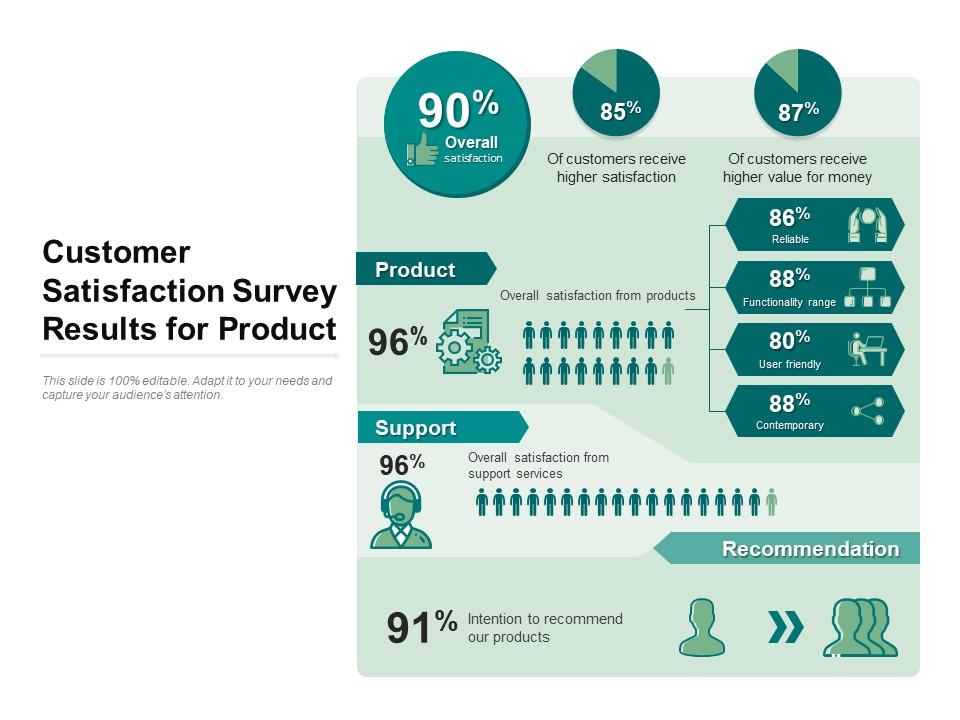
Template 2: Customer Satisfaction Survey Results for Product
Looking to measure customer satisfaction for your product? Our PPT template is the perfect solution! This template provides a comprehensive survey analysis that will give you insights into the satisfaction of your customers. Our PPT Framework offers a detailed breakdown of customer satisfaction scores based on a well-rounded survey that considers all aspects of your product. You'll get an overall satisfaction score, factoring in key parameters like reliability, value, utility, and support services. With this template, you can deeply understand what your customers think about your product and take the necessary steps to improve their satisfaction. Don't settle for guesswork when it comes to measuring customer satisfaction. Let our template do the work for you and get the insights you need to make informed decisions for your product.
Template 3: Engagement Survey Results PowerPoint Template Bundle
This comprehensive PPT template offers an invaluable resource for those seeking to obtain valuable insights from engagement survey results. Its 4-step checklist provides a clear and concise roadmap to ensure effective survey results. Additionally, the pre-built dashboard is a valuable tool for highlighting stakeholder engagement, making it easier to identify key focus areas quickly. The template also offers key steps for analyzing survey results, allowing you to understand the data and make informed decisions. With this template, you can easily communicate your engagement survey results to stakeholders and take meaningful actions to improve engagement within your organization.
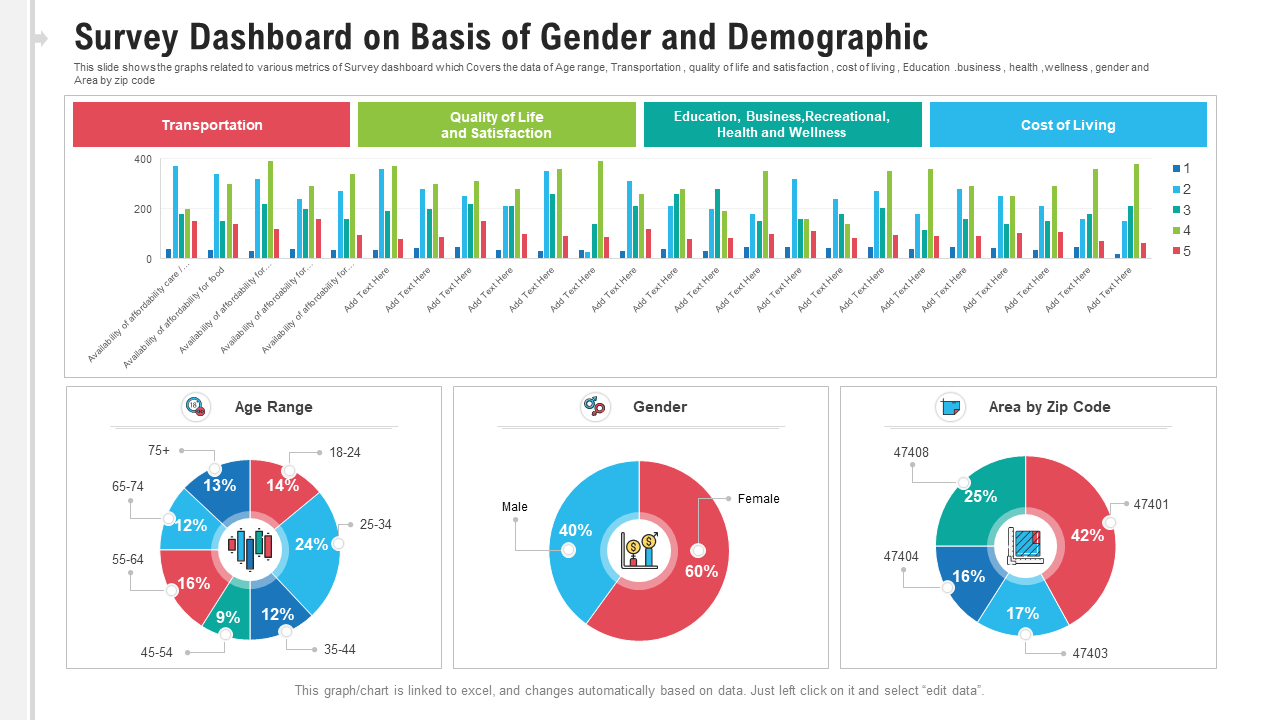
Template 4: Survey Dashboard on Basis of Gender and Demographic PowerPoint Template
You can use this PowerPoint template to create a dynamic and informative survey result dashboard. This PPT design will make it easy for you to compare data across different demographics and genders. With this content-ready presentation, you can quickly understand the key takeaways and impress your boss or clients. Therefore, download and edit it in minutes – get started today!
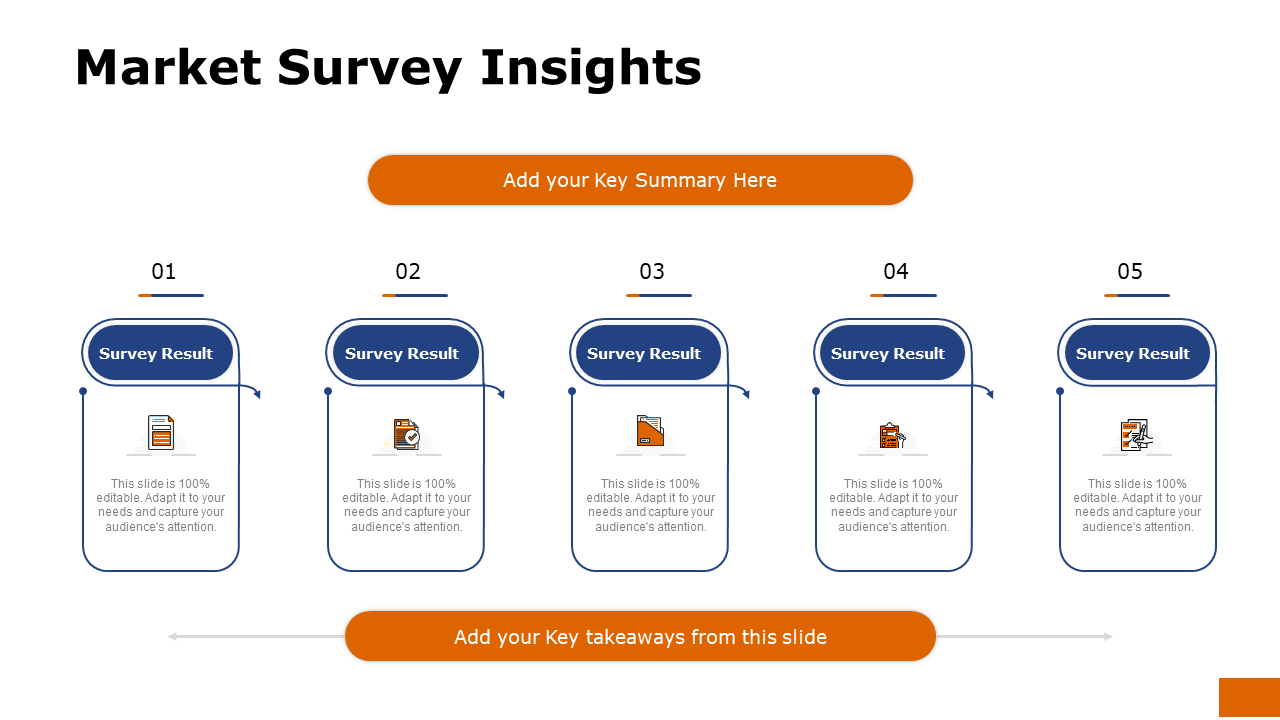
Template 5: Market Survey Insights PPT Template
This impressive template is the perfect tool for market researchers and business professionals who need a high-quality presentation for illustrating their survey results. With this slide, you can present your data in an engaging and persuasive way. So why wait? Get started today to wow your clients with this professional-grade graphic.
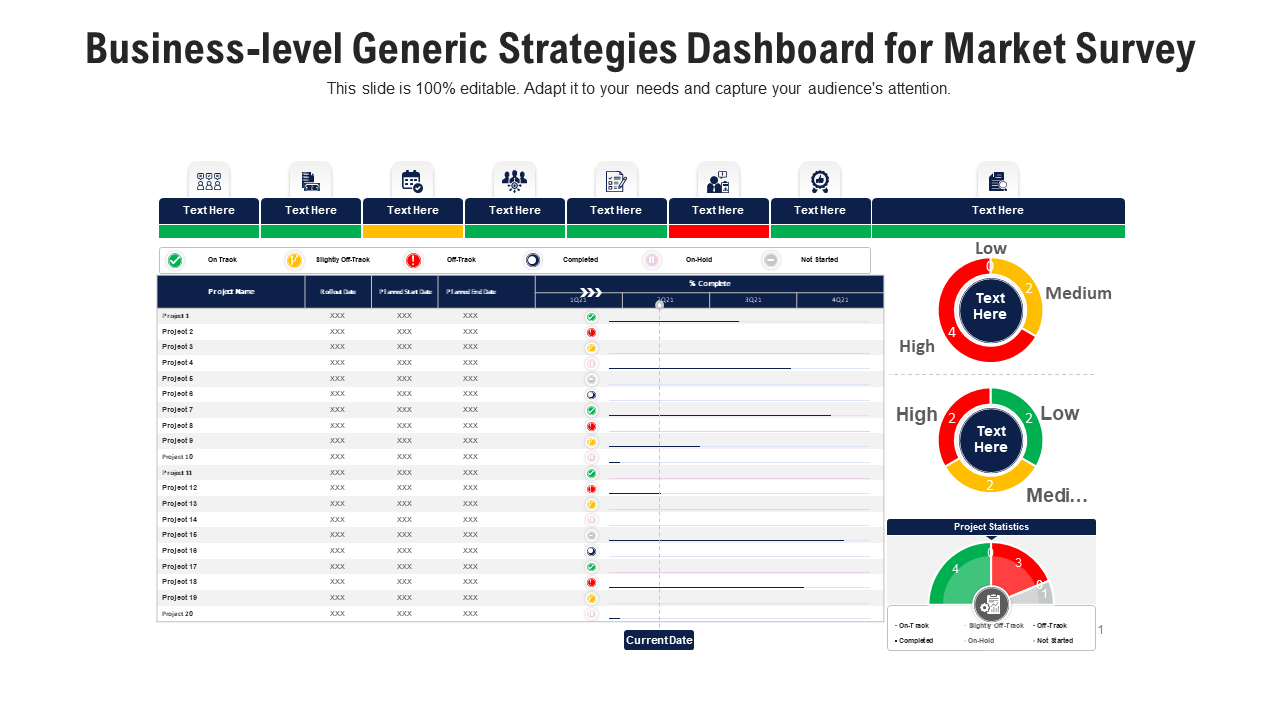
Template 6: Business-level Generic Strategies Dashboard for Market Survey
You can pick this template to highlight various business activities for conducting a market research survey. This presentation design is easy to edit, so you can change the text, color, font, or size conveniently. Besides, you can share it with your management using Google Slides. Download now!
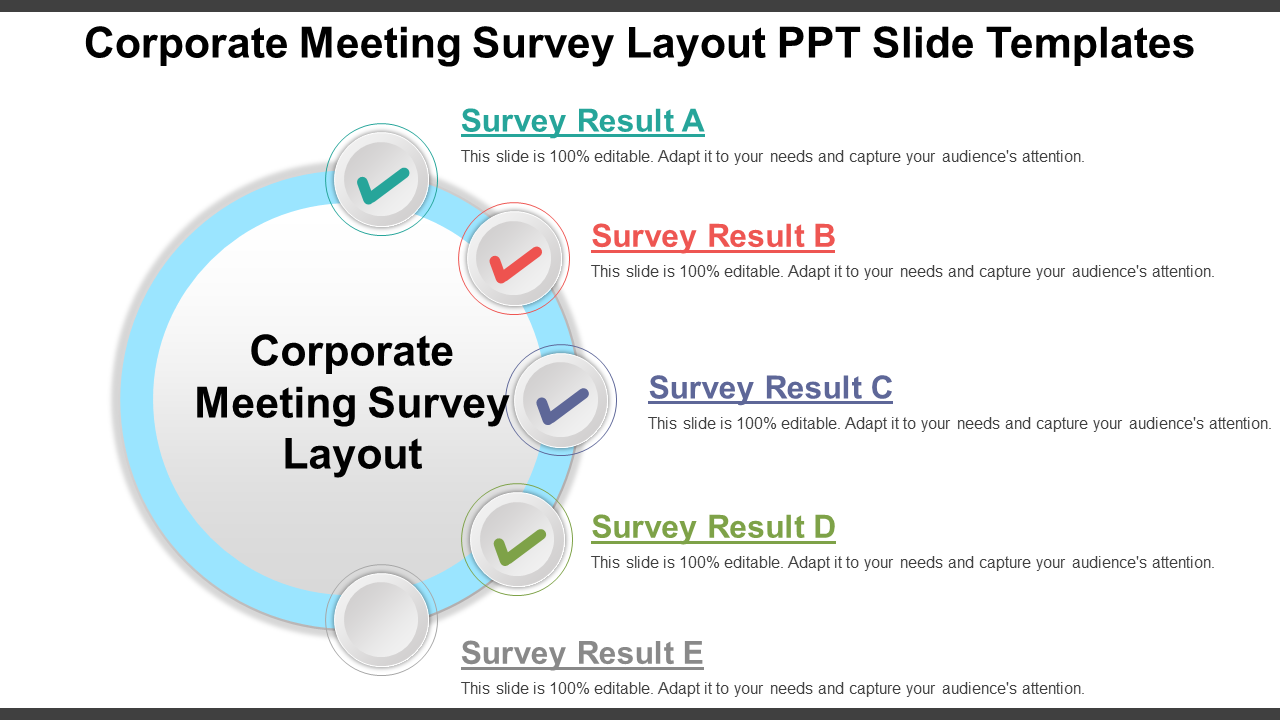
Template 7: Corporate Meeting Survey PPT Design
Are you looking to run more efficient and exciting meetings? Use this pre-built survey slide design to gather feedback from meeting attendees on the conduct and activities involved. This PPT template can also be used to improve future meetings or keep records of past meetings. So download it right away and collect feedback on your next meeting today!
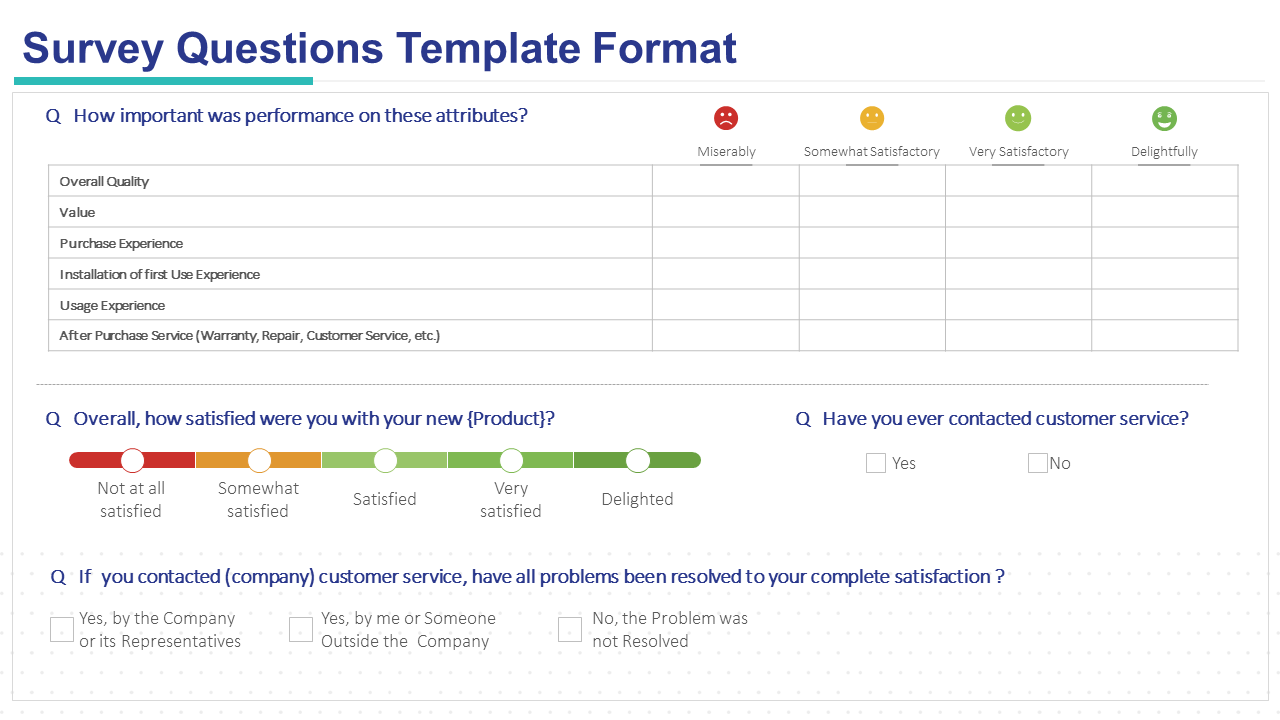
Template 8: Survey Questions Template Format
You can choose this presentation template to create appropriate survey questions for your research topic. Plus, this design will also help you create custom surveys that will look great on any device. So why wait? Download it instantly and start building powerful survey questions now.
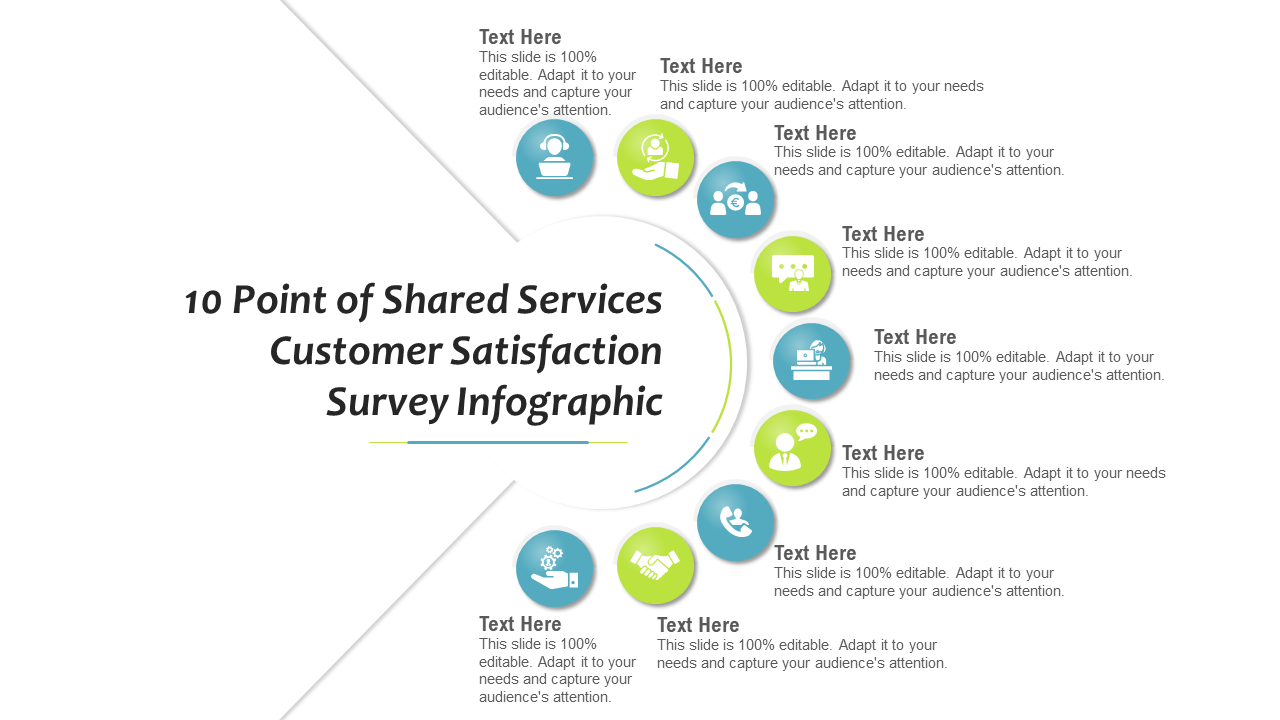
Template 9: Ten Points of Shared Services Customer Satisfaction Survey
You can pick this PPT graphic to represent your findings from customer satisfaction surveys in a visually appealing and informative way. This template includes intuitive design elements and text holders to explain the survey questions or results. So download it and start impressing your boss or clients.
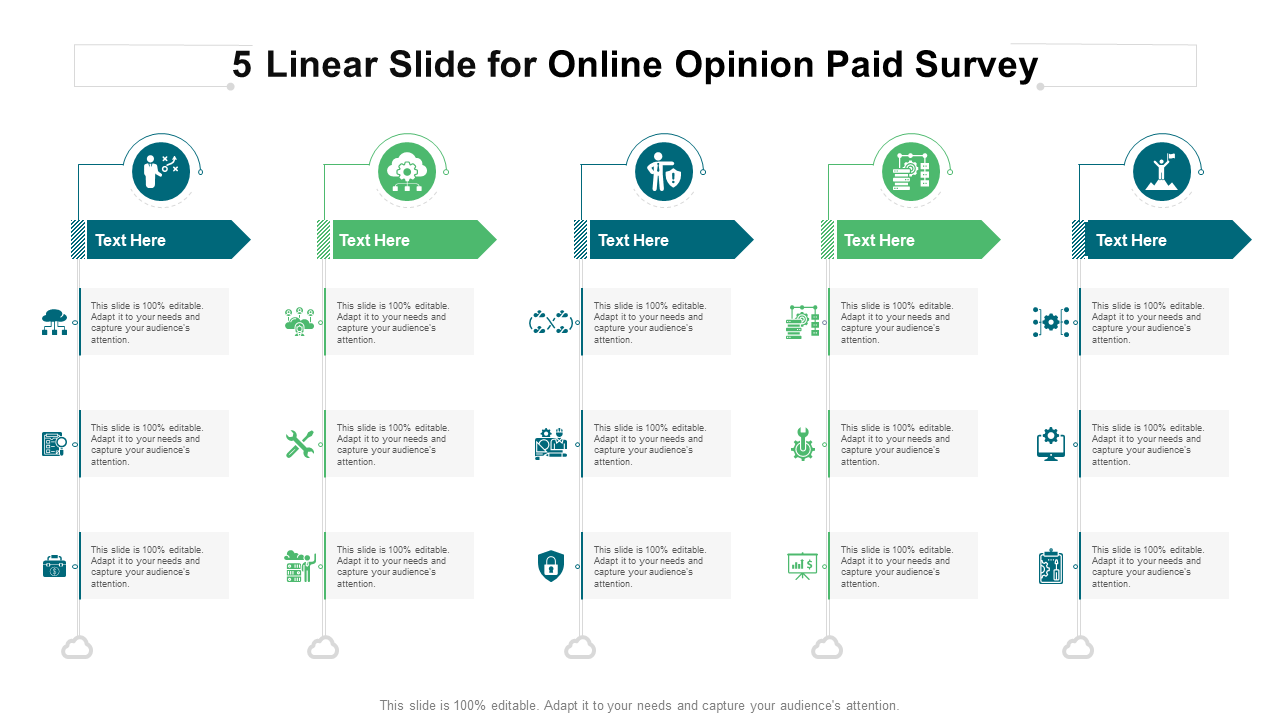
Template 10: Five Linear Slide for Online Opinion Paid Survey
You can choose this slide to share your online paid survey opinion with the management and superiors. This presentation includes a well-crafted linear diagram, so grab it right away and make changes with your research information. All just a click away!
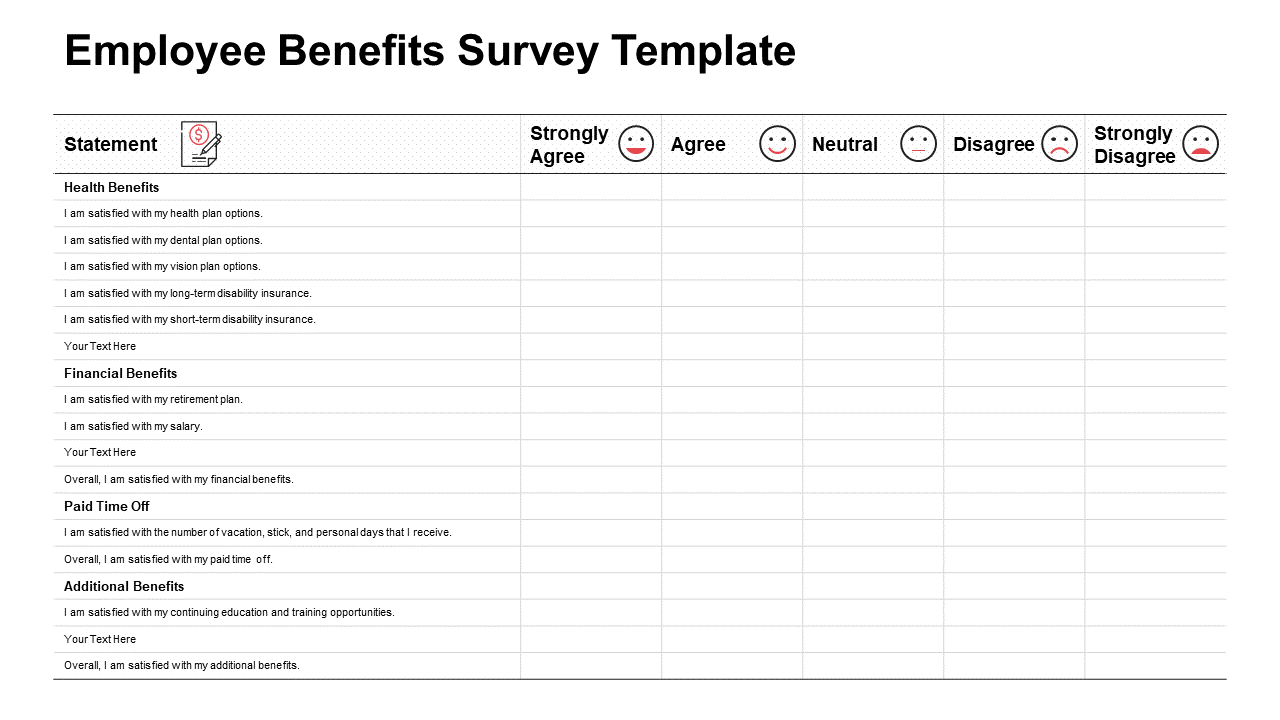
Template 11: Employee Benefits Survey Template
Do you want to boost your employee engagement and performance? This employee benefits survey template will make it easy to gather feedback from your team. Just customize the questions to fit your needs, then send the survey out and start collecting data. You'll see how your employees feel about everything from pay and benefits to company culture and management. Armed with this presentation, you can also work on making improvements to motivate your team members. Download now!
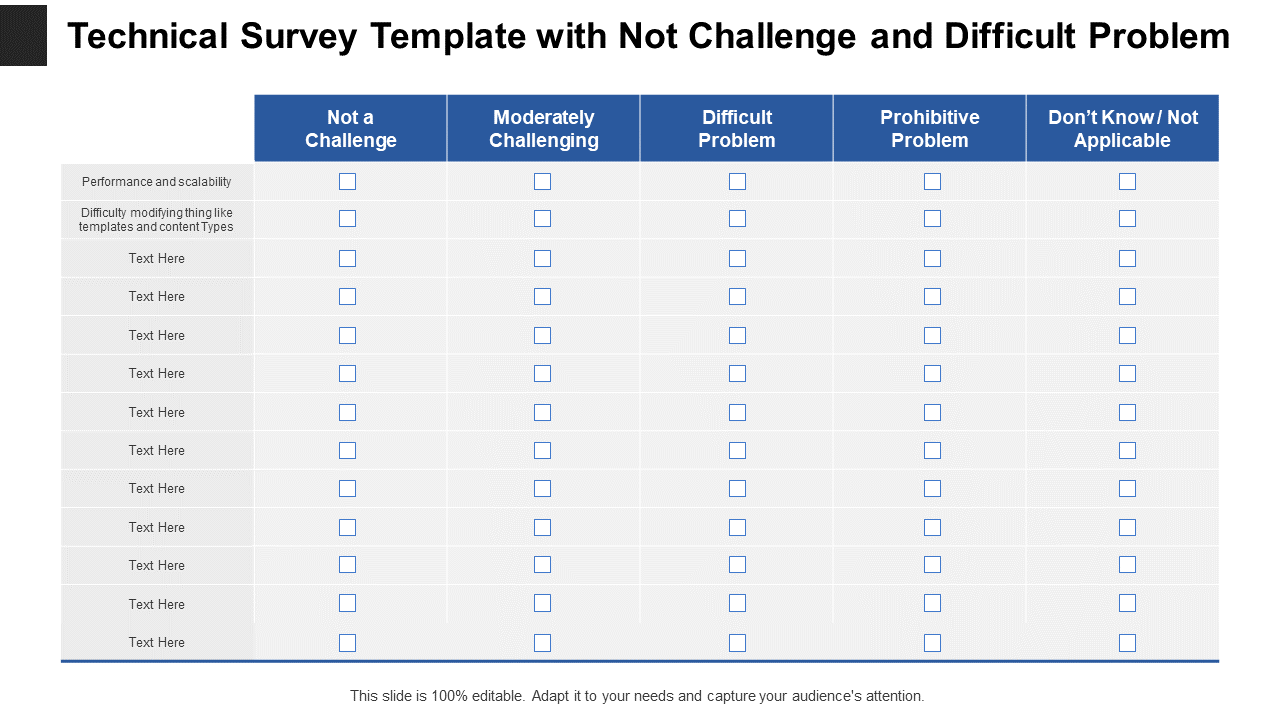
Template 12: Technical Survey PPT Template
You can use this template to conduct a technical survey for your organization. This PPT design covers a few difficulty parameters for the problems – not a challenge, moderately challenging, difficult problem, prohibitive problem, and more. So download and customize it as per your requirement.
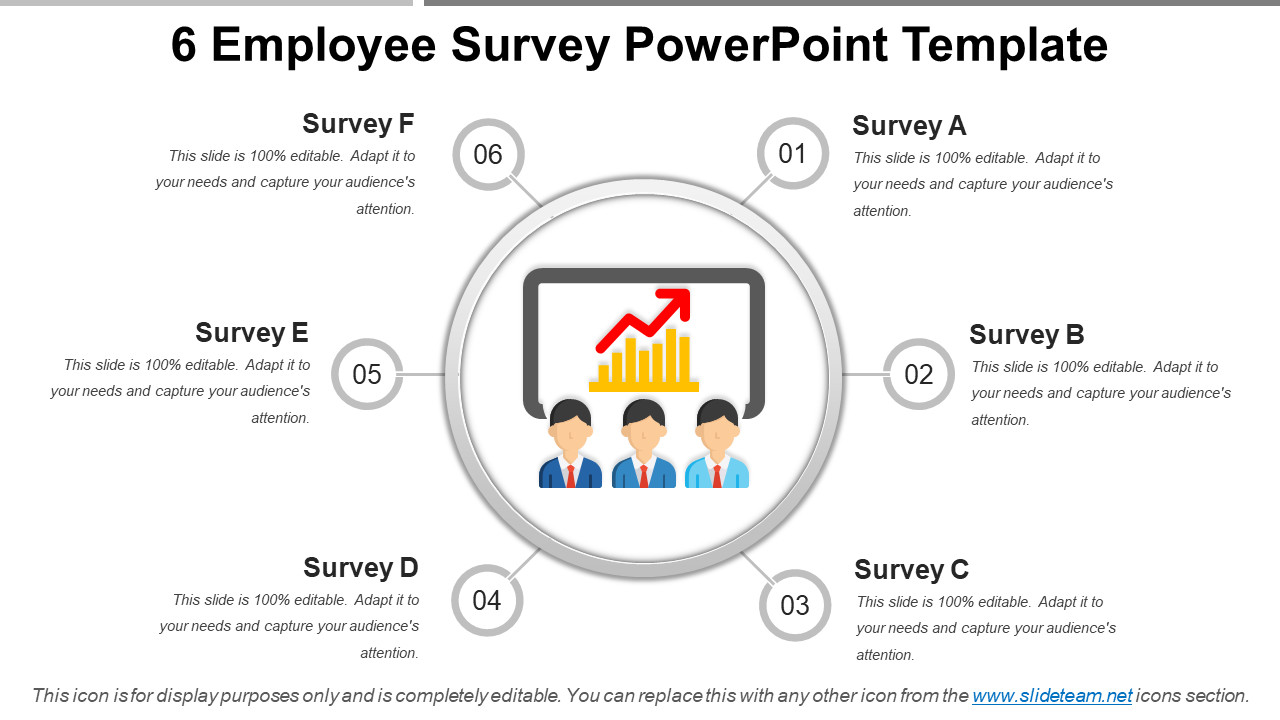
Template 13: Six Employee Survey PowerPoint Template
You can pick this survey results template to bring out the best in your team. This design uses an innovative diagram to depict a survey report of six employees in your company. So download and edit it with your feedback.
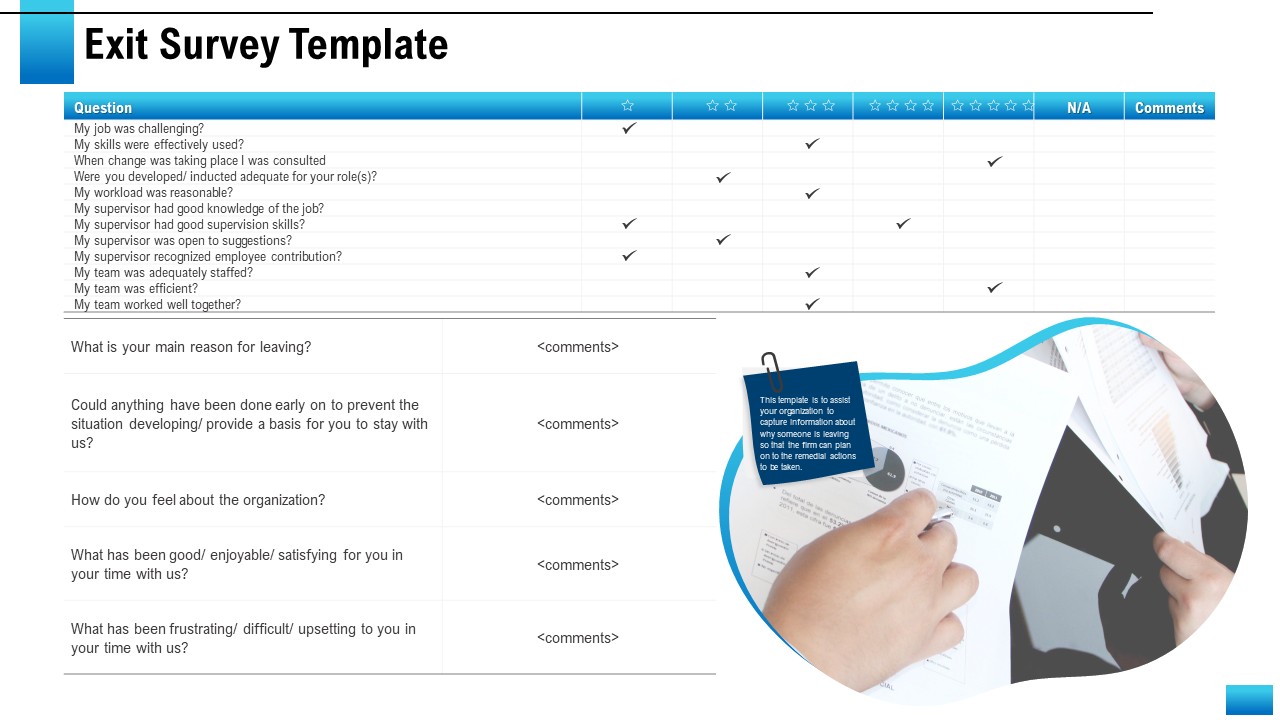
Template 14: Exit Survey Template
You can create an effective exit survey with this PPT template to understand why your employees are leaving and improve retention rates. This design can also help you gather standardized data and dive deeper into employee responses so that you can take actionable steps to improve engagement and reduce turnover. With its user-friendly interface, trend analysis capabilities, and demographic breakdowns, this presentation will make it easy to get the most out of your exit surveys. So don't wait any longer - download now!
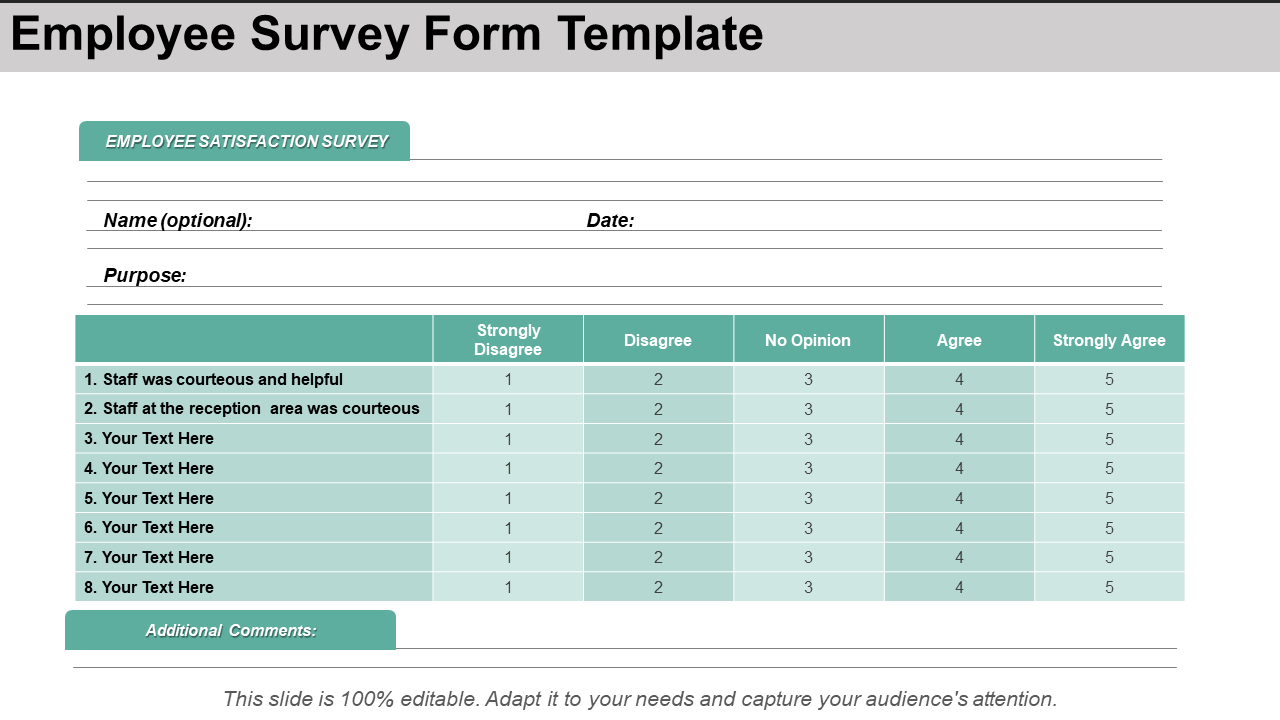
Template 15: Employee Survey Form Template
You can use this employee survey results PowerPoint template to research your employee satisfaction levels. With this design, you can easily understand their reactions to the benefits they are enjoying in your organization. Besides, you can use this graphic to interpret the results and improve productivity. Download now without any hassle!
In the end – analyze your survey results
The systematic design of our survey results templates will help you analyze the observations efficiently. However, first, we encourage you to understand the four measurement levels, analyze quantitative data, use cross-tabulation, depict the statistical significance, consider causation vs. correlation, and establish a comparison.
The best part is that you don't need an in-house presentation department to design these surveys. With our pre-designed survey results templates, anyone can compose a professional-looking questionnaire or report. You can enjoy their unlimited access this moment itself by purchasing from our monthly, semi-annual, annual, and annual + custom design subscriptions here.
P.S: You can also share your business information concisely by exploring our handy guide featuring one-page fact sheet templates and reports.
FAQs on Survey Results
How to evaluate survey results?
Evaluating survey results involves analyzing the data collected in the survey to gain insights and draw conclusions. Here are some general steps to follow when evaluating survey results:
- Review the survey data: Look at the survey responses and check for missing data, errors, and inconsistencies.
- Identify key themes: Look for patterns or themes in the data, such as common responses to certain questions or trends over time.
- Calculate response rates: Calculate response rates to determine the level of participation in the survey.
- Compare data: Compare the survey data to previous survey results or industry benchmarks to get a sense of how your organization is performing.
- Conduct statistical analysis: Use statistical tools to analyze the data and identify significant findings.
- Interpret the results: Interpret the survey results in the context of your organization and determine what they mean for your business or strategy.
- Take action: Use the insights gained from the survey results to take action and make improvements in areas where they are needed.
What is survey analysis?
Survey analysis is the process of analyzing the data collected from a survey to draw insights and conclusions. The purpose of survey analysis is to understand the trends, patterns, and relationships within the data to inform decision-making.
How is survey data collected?
Survey data can be collected through various methods, depending on the research question, the target population, and available resources. Here are some common methods of collecting survey data:
- Online surveys: Online surveys are conducted over the internet, and respondents complete the survey using their computer or mobile device. Online surveys are often conducted through email invitations or social media, and they can be designed using survey software such as SurveyMonkey, Google Forms, or Qualtrics.
- Telephone surveys: Telephone surveys involve contacting respondents by phone and conducting the survey over the phone. Telephone surveys are often used for large-scale surveys, such as political polling or customer satisfaction surveys.
- Mail surveys: Mail surveys involve sending paper surveys to respondents through the mail, along with a pre-paid return envelope. Mail surveys can be used when the target population is not easily reachable through other methods, such as elderly people who do not use the internet.
- In-person surveys: In-person surveys involve face-to-face interaction with respondents, either by going door-to-door or by setting up a booth at a public location. In-person surveys are often used for surveys that require more detailed information or when a personal touch is required.
- Focus groups: Focus groups involve gathering a small group of people together to discuss a specific topic or issue. Focus groups are often used to gather qualitative data, such as opinions, attitudes, and beliefs.


![[Updated 2023] Top 15 PowerPoint Templates to Compile and Assess Your Survey Results](https://www.slideteam.net/wp/wp-content/uploads/2021/12/Survey-Results1-1013x441.png)


 Customer Reviews

