





 0 Comment
 Customer Reviews

Modern firms must concentrate less on gathering data than on processing and analyzing it in a meaningful way to ensure they always have the data brief! Yet, preparing a data brief clearly and compellingly is a separate sub-skill and subset. Hence, there is a real requirement of data brief templates or presentations that make for a great business decision that yields fantastic results.
A recent PwC study demonstrates how there is a huge demand for data brief templates or services that can provide this critical input to business decisions. The study showcases that while just one-third of executives believe they have adequate trust in converting data into actionable insights, 79% of executives see data-driven decision making as being absolutely critical to corporate success.
From healthcare to retail, banking and technology, data briefs are essential in companies, as they enable stakeholders to make swift, well-informed choices. Businesses face the danger of misunderstanding, delayed decision-making, and expensive mistakes without precise, succinct briefings.
Refer to our blog on Project Brief Templates to prepare the project briefs effectively using the best-in-class templates that are showcased.
Presentations provide organizations an easy way to distribute results and turn unprocessed data into insights. Making good presentations, however, presents special difficulties; whether that means developing an engaging story, choosing appropriate design components, or ensuring logical flow of information over time - all adds up.
This blog on Data Brief Templates provides a unique answer to all your data presentation requirements. These slides offer 100% editability and customizability and capability with content-ready slides available as quick downloads in PNG or JPG formats.
Isn’t that great, so get ready to transform unprocessed data into eye-opening narratives regardless of your degree of data presenting expertise with our templates.
Check out our blog on Must Have Media Brief Templates to ensure the media brief is prepared efficiently through our world-class templates.
Let’s explore!
Template 1: History of Data Structures Learning Five-year Roadmap PPT
This PowerPoint Slide covers historical data structures across years: Stack, hash table, and array implementation on computers are covered, along with sorting array algorithms. Also included are search trees for binary operations, graph problems aided by computers. There is another segment on how bubble software has become mainstream. This overview offers students and professionals alike an aerial perspective on recent advancements within data structure practices, helping gain an appreciation of contemporary practices.

Template 2: Data Brief PPT Template Bundles
This presentation slide includes customer satisfaction data brief dashboard, effectiveness of social media data brief for marketers, quarterly revenue data brief report and product data analysis sheet; annual financial data with KPI dashboard for business executives and annual KPI dashboard with KPI dashboard insights as well as cyber security statistical data brief insights are presented in detail. Whether you are a marketer analyzing campaign performance or a financial analyst producing quarterly reports, this slide makes creating impactful data briefs easier.
[product_image id=701952]
Template 3: Strategic Guide to Market Research & Focus Groups PPT
This presentation slide provides information on focus groups as a method for gathering data to enhance decision-making processes while outlining their benefits, which include deep insights, interactive feedback, and low-cost requirements. This slide provides marketers and researchers with an introduction to focus groups as an efficient method for collecting data. Focus groups provide in-depth insights, interactive feedback, and cost-effectiveness when used for market research purposes. With this input, informed decisions on consumer behaviors and preferences become possible.

Template 4: Brief of Gap Analysis for Data Evaluation PPT Template
This PPT Slide provides an introduction to gap analysis as a data evaluation method. It highlights the variance between actual and estimated performance, along with its many advantages. These are profit percentage analysis, process improvements, market opportunities, and understanding KPIs. The PPT illustrates how gap analysis serves as an indispensable resource for strategic decision-making and business optimization. Market researchers, business analysts, and strategic planners looking to enhance their approach to data evaluation and performance appraisal will find this slide to be a treasure!

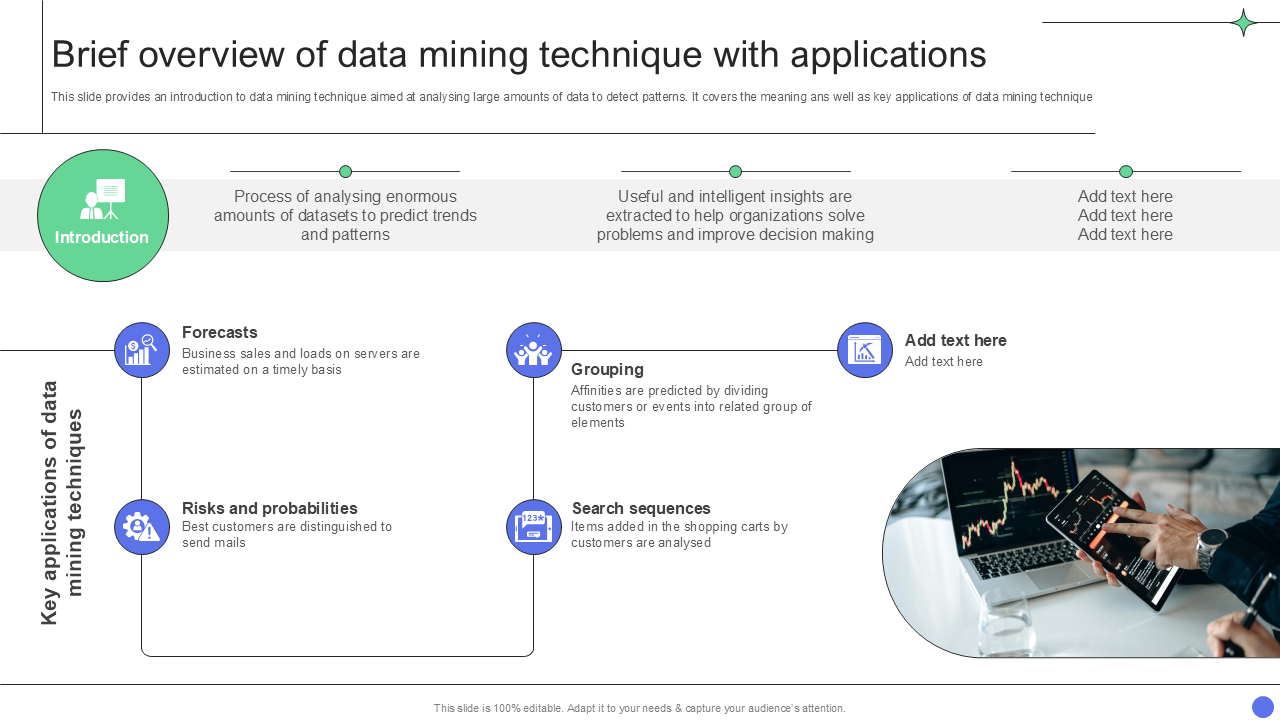
Template 5: Data Mining Technique with Applications PPT Template
This PPT Template offers an introduction to data mining techniques to analyze large volumes of data and detect patterns. It explores their meaning and key applications. Forecasts, risk and probabilities calculations, search sequences, and introduction grouping are covered. This slide serves as an educational aid for professionals and students interested in data analytics. It gives a concise overview of data mining techniques and their applications, helping viewers grasp fundamental concepts quickly. Download now to analyze large datasets, uncover patterns, and make predictions.
Template 6: Product Data Brief Analysis Sheet PPT Template
This Product Data Analysis PPT Slide presents annual performance data of multiple products as shown by profits or losses to reveal whether or not they are performing as expected. It includes factors like total costs, units sold, selling price, total sales volume, and profit and loss figures. The slide provides managers with an easy means of comparing multiple products, making comparisons simple, enabling managers to spot trends more readily, make informed resource allocation decisions, and optimize product mixes. Download to track performance, set targets, and develop data-driven growth strategies.

Template 7: Business Executive Data Brief Report PPT Template
This business executive report depicts an executive summary for businesses to provide investors or stakeholders an overview of operations, facilitate decision making and assist decision making. It contains details on business operations, such as revenues and expenses, along with an analysis of growth management. Business vision, mission, CAGR targets, and projected returns are also documented. This slide enables executives to make quick yet informed decision-making, perfect for swift strategic discussions, securing stakeholder trust & engaging executive reporting!

Template 8: Annual Financial Data with KPI Brief Report
This PPT Template slide summarizes a KPI brief dashboard to evaluate your company’s annual operating performance. These metrics include gross profit margin, OPEX ratios, operating profit margin, net profit margin, and COGS month-wise revenue numbers, as well as target and actual EBIT ratios by category or month-wise OPEX costs. This slide provides a vital overview of our company's financial health, condensing complex annual data into easily understandable KPIs. The aim is to provide a quick assessment of operational efficiency and profit trends. Highlight performance against targets, while simultaneously helping guide strategic planning processes with a download.

Template 9: Quarterly Revenue Data Brief Report PPT
This PPT Slide provides a snapshot of the organization’s quarter-over-quarter revenue to evaluate which segments are the most profitable and which are weak for strategy formulation purposes. It includes operating divisions, product segments, SEQ index scores, and year-over-year growth. With its integrated approach, the Revenue data brief report helps identify your most profitable segments as well as areas requiring strategic attention. Thus, it forms the cornerstone for our strategic decision-making process. Download to guarantee sustained growth and market leadership!

Template 10: Customer Satisfaction Data Brief Dashboard Slide
This PPT deck details key metrics from customer satisfaction surveys conducted to evaluate and enhance user experience, such as satisfaction rate, recommendation rate, professional background of respondents, and reviews. Through our thorough surveying process, the slide helps users gain a holistic picture of customer satisfaction levels - not only how satisfied they are, but why. It serves as an essential roadmap for improving our user experience and forging stronger, longer-term customer relationships. Download to surpass customer expectations with each interaction.

GET INTO THE GREEN ZONE FOR DECISION-MAKING
Data-driven decision-making depends on enterprises’ capacity to explain complicated information clearly and persuasively. Therefore, our research of the top 10 data brief templates helps us identify many ways in which companies may turn unprocessed data into useful insights. Our templates are strategic tools meant to help comprehension, propel conversations, and enable informed decision-making across companies at all levels. They are not just visual aids. Templates serve as links between data analysts and important stakeholders that guarantee important insights are not lost during transfer by combining large volumes of data into consumable forms.
The usefulness of these templates comes from their adaptability and depth; whether they present quarterly income statistics to board members or customer satisfaction measures to team members, they provide a disciplined framework that can readily fit many corporate environments or audiences.
PS Get insight into our blog on Must-Have Database Report Templates to accommodate your business data in a streamlined manner.


