





 0 Comment
 Customer Reviews

Think about the town you grew up in. Were there jobs for people? Were the roads smooth? Did schools have enough teachers? Could families live with dignity? These simple questions are actually economic development questions.
Whether you're a policymaker, a researcher, a consultant, or someone trying to make sense of a development project’s impact, you need more than just numbers on a spreadsheet. You need to be clear. You need to know what's working, what's not, and especially who isn't getting enough attention.
That's where SlideTeam's completely customizable Economic Development Metrics Templates come in.
You can employ these templates to see how well regions, cities, or programs are doing in the actual world. These tools offer you the whole picture, from looking at GDP growth and employment rates to tracking income disparity and infrastructure development. They also assist in tracking social effects, aims of sustainable development, and progress toward reducing poverty. This way, you can look beyond showy growth figures and focus on success that includes everyone.
These templates are the most effective way to illustrate how economic policies lead to genuine change. These slides will help you explain not only the "what" but also the "why" and "how" behind every figure, whether you're writing a report for a government agency, a development organization, or a civic board.
Template 1: Importance of Socio Economic Development PowerPoint Template
This PowerPoint Template emphasizes the importance of socioeconomic progress with a modern circular design that contains a central globe and financial charts. The design focuses on five key pillars: economic development, social equity, sustainability, infrastructure improvement, and employment creation. Each section provides brief instances of how socioeconomic development increases productivity, promotes equity, and encourages responsible resource use. It also emphasizes how it strengthens key institutions and expands job opportunities. The template's professional structure and associated parts effectively communicate complete growth strategies. Grab it today!

Template 2: Historical Context of Growth and Development
This PowerPoint Template presents the historical backdrop of growth and development with a professional timeline arrangement that extends from 1945 to 2015. The design has five historical milestones. Descriptive text boxes point out major events such as postwar rebuilding, decolonization, the digital revolution, and environmentally friendly growth plans. The design successfully displays economic growth indicators from different periods while also including sustainable development metrics in recent years. Employ this template to present comprehensive historical analysis in an engaging manner. Download now!

Template 3: Core Indicators of Socio Economic Development
This PowerPoint Template highlights the key indicators of socioeconomic growth in a clean and structured dashboard arrangement. It covers crucial measures like GDP, literacy, unemployment, and poverty rates, which are displayed by plain numeric values and directional arrows. Progress bars for GDP growth and literacy rates provide visual information, whereas a bar graph compares indicator performance over time. A speedometer-style gauge displays the total development index. This organized and graphic approach efficiently communicates data-driven insights. Ideal for economists, researchers, educators, and policy analysts who represent socioeconomic development in reports or briefings. Download today!

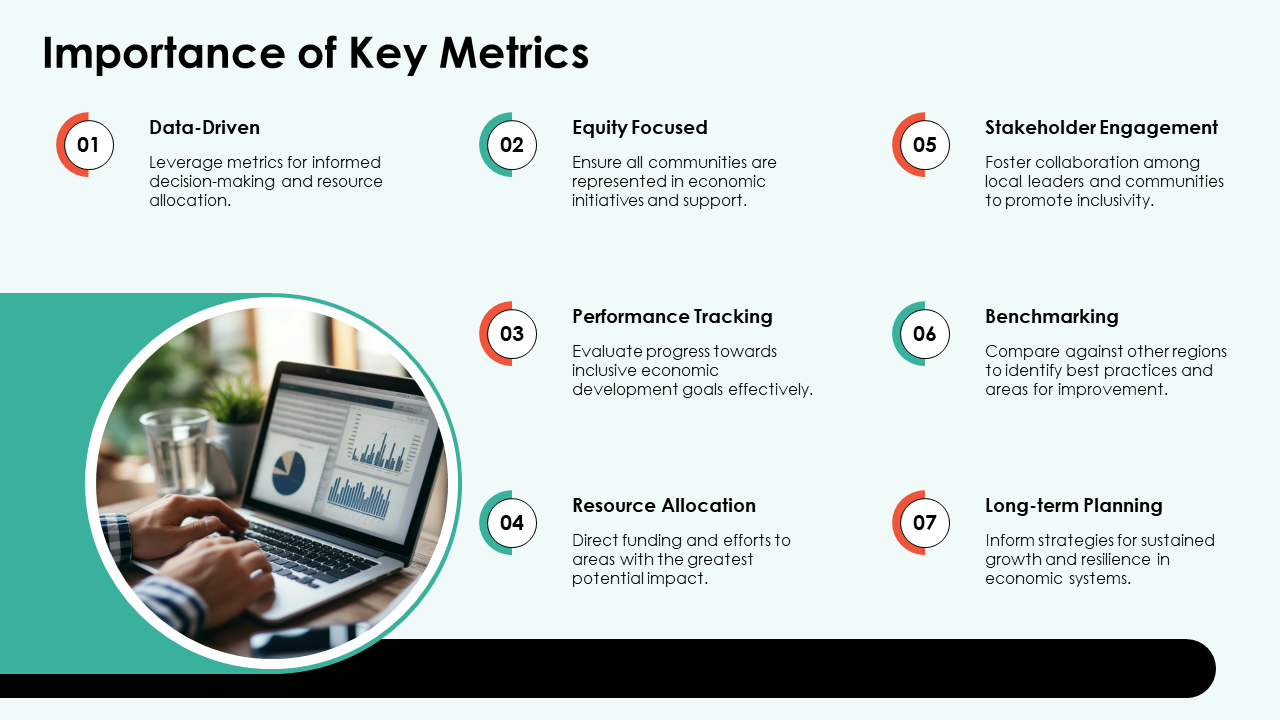
Template 4: Importance of Key Metrics
This PPT Template illustrates the significance of important measures in promoting inclusive and effective economic solutions. It has seven numbered regions grouped around a center picture, each with a brief description and explanation. Data-driven choices, equity, performance tracking, and long-term planning are among the topics covered, with a particular focus on how metrics may help with improved allocation, comparing, and cooperation. This well-structured template simplifies complicated subjects in order to make interesting conversations. Ideal for economists, educators, and consultants discussing the use of metrics in strategic planning and policy creation. Download today!
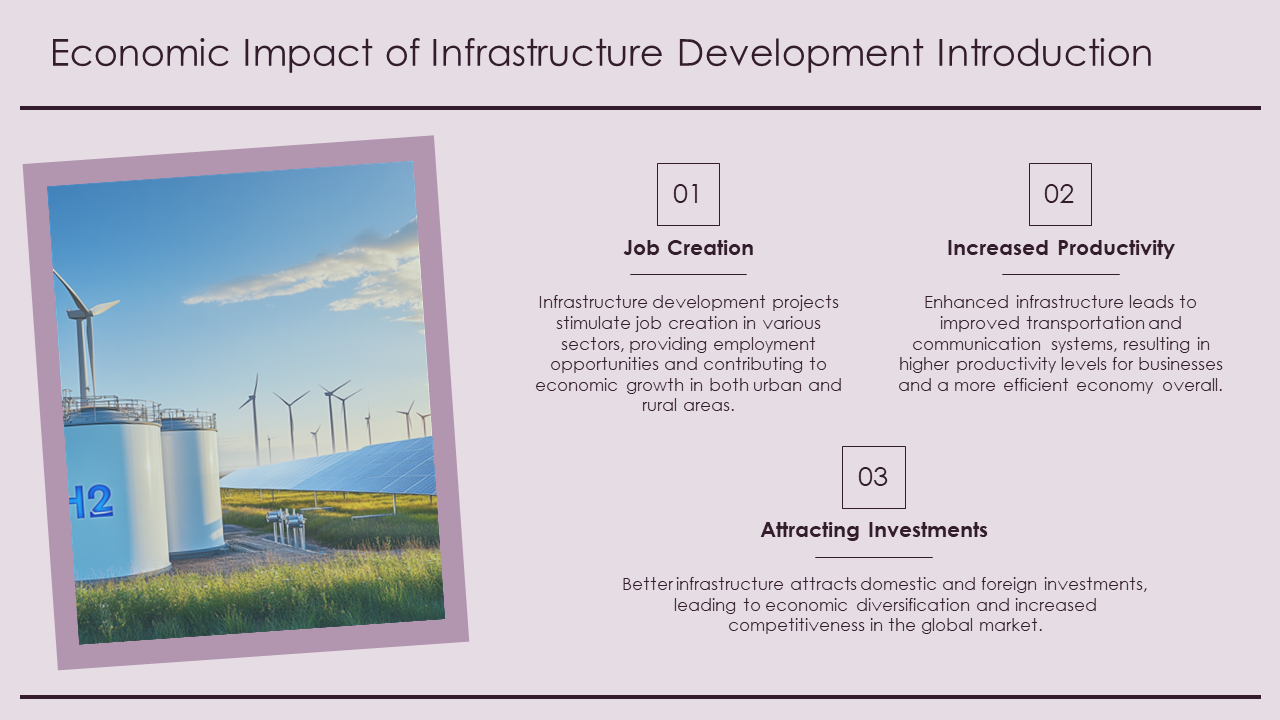
Template 5: Economic Impact of Infrastructure Development Introduction
This PowerPoint Template demonstrates the economic benefits of infrastructure development with a balanced arrangement that includes a spectacular wind energy graphic and three numbered sections. The design offers several advantages, including job generation, enhanced productivity, and attracting investments. Each section explains in detail how infrastructure investments help to create jobs, improve transportation networks, and increase global competition. The template successfully includes economic growth indicators through productivity indicators, as well as social impact assessment via job opportunities analysis. Grab it now!
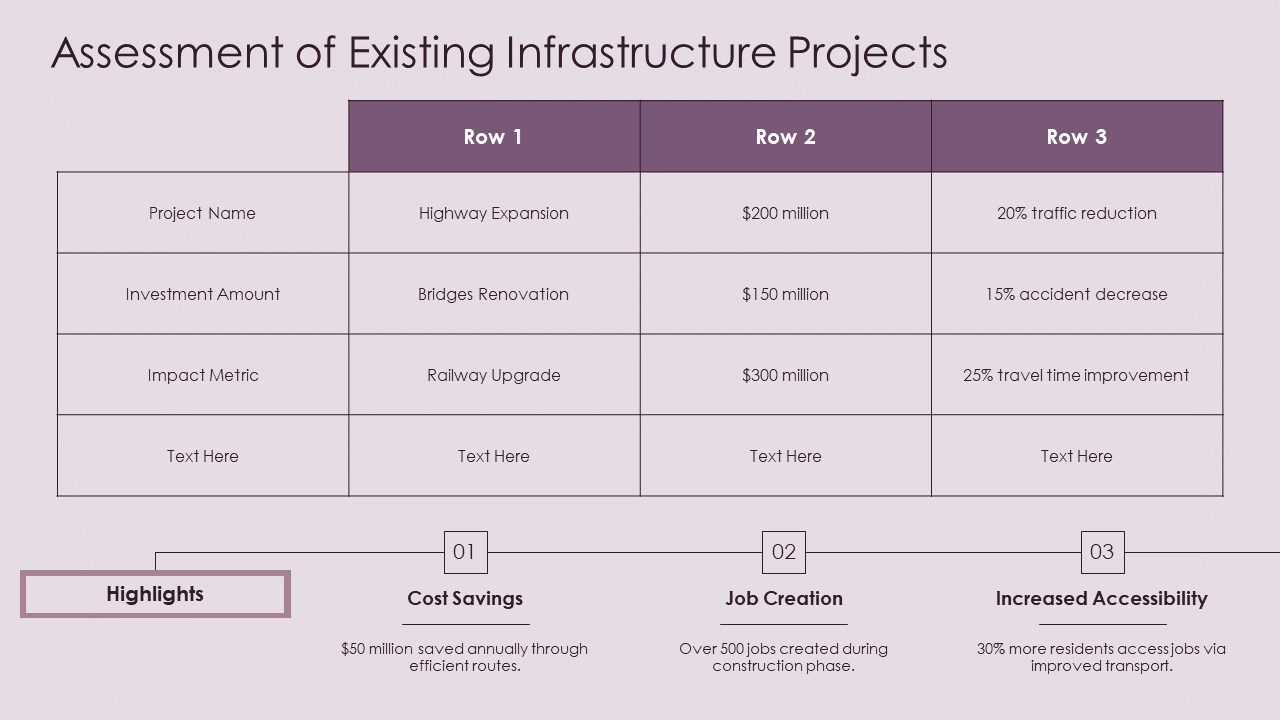
Template 6: Assessment of Existing Infrastructure Projects
To estimate project success and impact, infrastructure reviews need detailed data analysis. This PPT Template features a layout with a comparison table of project names, investment amounts, and effect measurements. It also highlights the result sections below. The template's organized format allows for project evaluation via structured data display and key performance indicators. This professional evaluation tool is ideal for infrastructure managers, government agencies, construction companies, and investment analysts.
Template 7: Challenges in Infrastructure Implementation
What is holding back even the best-planned infrastructure projects? This PPT Template presents the challenges in a well-organized layout. It focuses on five primary obstacles such as money, regulations, coordination, technology, and environmental problems, all of which are presented concisely. The design produces a balanced, easy-to-read structure excellent for showing important challenges. Download now!

Template 8: Impact of Policies on SEDI Outcomes PPT Template
This PowerPoint Template highlights the influence of policies on SEDI results using a dynamic arranged setup with eight numbered policy levels. The design shows a complete hierarchy that includes global policy, national laws, and community interaction. Each level presents descriptive explanations of its socioeconomic impact. It highlights several policy scales such as regional efforts, local projects, and NGO actions. This template may be used by government officials, policy analysts, development groups, non-governmental organizations (NGOs), and university scholars. Grab today!

Template 9: Access to Education and Literacy Rates
How can countries systematically enhance educational access and literacy rates? This PowerPoint Slide presents a comprehensive circular arrangement with seven interrelated teaching components around a focal analytical visualization. The design highlights major factors such as access, enrollment, attendance, assistance, accomplishment, outreach, and sustainability, along with complete explanations of their roles in educational progress. The template's wheel-like layout successfully displays how many instructional aspects connect to generate meaningful results. Download now!

Template 10: Health and Well Being Indicators Overview
This PowerPoint Template displays significant factors that impact public health and general well-being with a clean vertical arrangement and a modern look. It highlights four key areas like access to healthcare, dietary quality, mental health assistance, and preventative measures. These are clearly numbered and defined for simple comprehension. The right side has a picture that compliments the topic of health and technology, giving visual appeal. The organized format simplifies the presentation of complicated details. Download today!

GET STRUCTURE TO COMPLEX REPORTS
Monitor employment, infrastructure, income equality and more with our foundational templates. These slides bring structure to complex reports and help turn data into action. Whether you're analyzing performance or evaluating a policy’s impact, get the insights to guide smart, human-centered decisions using our well-researched, clutter-free PPT Layouts.
PS: Do you want to streamline the process of economic analysis? Explore our ready-to-use templates now!
FAQs on Economic Development Metrics
1. What are economic development metrics?
Economic development metrics are simple ways to measure how well a country or region is growing and improving the lives of its people. These metrics look at things like how many people have jobs, how much money people earn, how many new businesses are opening, and more. They also check if people’s living conditions are getting better. These numbers help governments and others see what’s working and what needs fixing.
2. Why are these metrics important for policymakers and planners?
These metrics are important for policymakers and planners because they help in making smart decisions. When they know the numbers they can plan better. These facts help them understand what is working and what needs to change. It also helps them use money wisely, avoid problems, and improve people’s lives. Without clear data, decisions can be wrong or unfair.
3. What are commonly used indicators of economic development?
- GDP is one important indicator, which tells us the total value of goods and services a country makes.
- Income levels and how equally money is shared also matter.
- The employment rate shows how many people have jobs.
- Life expectancy, education levels, and access to healthcare also tell us how people are living.


