Who doesn't love to solve a problem? Some people love puzzles, others love mysteries, and some love being able to predict the future! It makes sense then that project managers have their own planning and evaluation methods for effective project management. One of these methods is the PERT Chart.
PERT Chart, also known as the “Project Evaluation and Review Technique,” is a flowchart used for project management. It provides guidance for planning tasks and milestones, assessing the status of each task, and estimating the remaining time needed to complete these. By looking at the entire diagram, we get a clearer idea of what has to be done first, when, who will do it, and how much time they will need to finish their assigned task.
The Nitty-Gritty of the PERT Chart
Developed to facilitate better planning and scheduling of projects, this methodology gained prominence during its association with the US Navy’s Polaris nuclear submarine project in the 1960s. A PERT diagram is a graphical representation of project details, which includes the timeline, tasks, etc. It consists of nodes and arrows, where nodes represent the events and milestones of a project, and arrows are visual depictions of the task that needs to be performed during the project.
This diagrammatic portrayal of the project makes it easy for project managers to assign and coordinate tasks in an organized way. It fosters a better understanding of individual roles and responsibilities, thereby enabling accountability and productivity.
The PERT chart benefits project managers in calculating the risks involved in the stages of the project and implementing techniques to mitigate these. This ensures a resilient project undertaking that is compliant with the desired goals.
Creating a PERT Chart is both time and effort-consuming. It involves shapes and content and aligning them to form a meaningful diagram. This can be a hassle at a time when you have more pressing matters in your hand.
Well, enough of the problems!
SlideTeam’s collection of PPT Templates is the one-stop solution to all your presentation-related problems. Professionals have curated the designs, and the layouts are thus polished and have a neat look of experience.
Let’s check these out now!
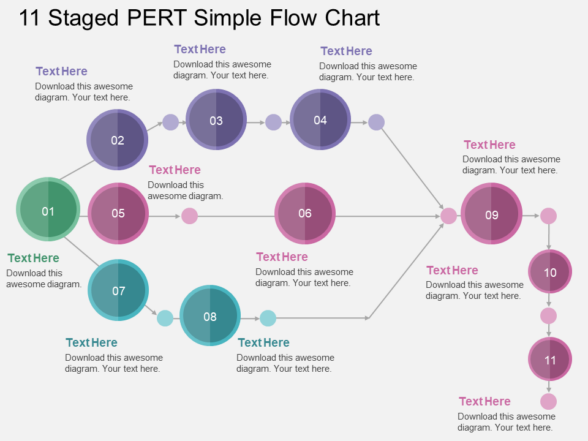
Template 1: 11 Staged PERT Simple Flow Chart PPT Template
If you're looking to design a PERT chart, this is the perfect PERT Flowchart Template for you. The given sample illustrates 11 stages of a project from start to finish. You can use it to schedule, plan, and analyze your project or for any other type of data-driven planning or analysis. The layout is easy to scale and read while using it as your work plan. Download now!
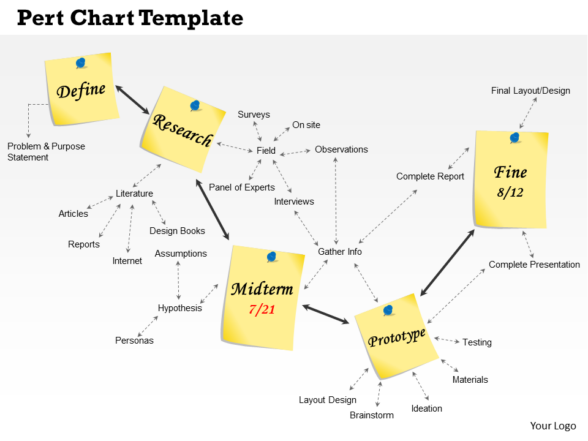
Template 2: PERT Chart Template
The given PERT Chart template is a great tool for planning, implementing, and analyzing your projects. It is meant to meet your research-related needs and enables a concise depiction of all project phases. You can use the diagram for analysis in situations like feasibility study, schedule development, and production planning. Use it to ensure you meet the deadlines outlined in your project plans. Get it now!
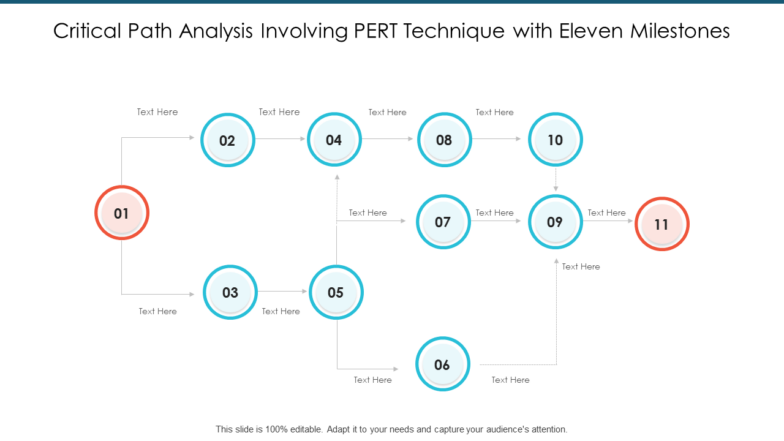
Template 3: Critical Path Analysis Involving PERT Technique PPT Sample
Incorporate this predesigned PERT flowchart PPT sample for conducting a critical analysis. It shows eleven milestones with an innovative color scheme that shows the start and end in red color. Arrows facilitate the process direction allowing better comprehension of how the project will progress. Get it now!
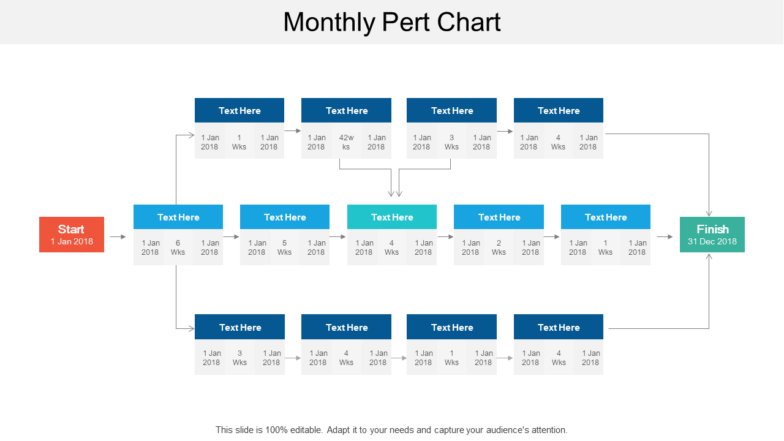
Template 4: Monthly PERT Chart PPT Design
Do you have a project at hand? Don’t know where to start? Look no further! With this well-designed monthly PERT Chart PowerPoint infographic, you can prepare your schedule. You can also use it to analyze the project and see who will work where and when. Grab this customizable presentation template today.
Template 5: Project Design Program PERT Chart Slide
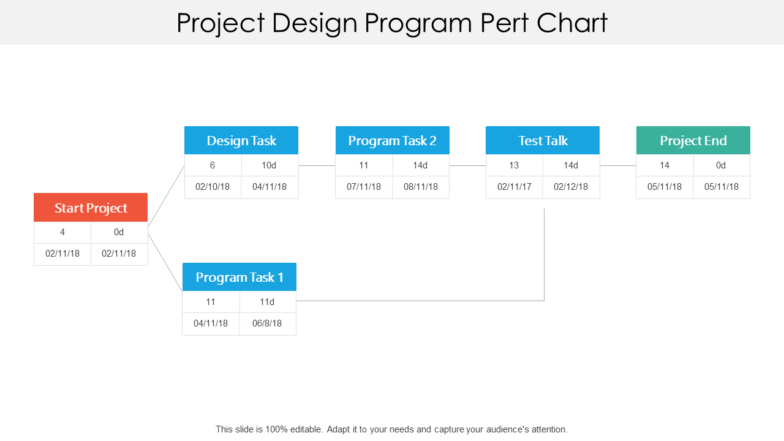
With the given PERT Chart template, you can view and edit a project’s design programs and tasks, as well as set up a project timeline. This PPT Template will help you create a detailed chart with each stage of your project displayed. Download now!
Template 6: Statistical PERT Estimation Worksheet PPT Sample
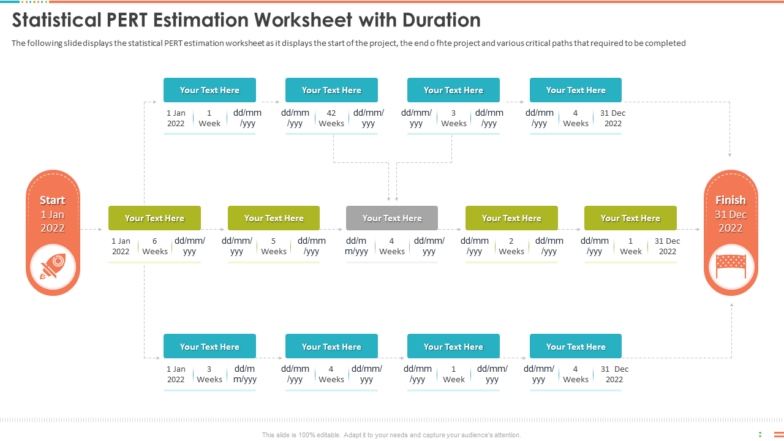
Our ready-made PERT Chart PPT Template is a great tool for your project organization ventures. You can fill in the details and get an idea about time management, task and cost analysis, and critical path analysis. All these components will help you and your team keep track of the project in a logical, wonderful format. Executives and salespeople can use it to keep up with their progress. Download it now!
Template 7: Numeric PERT Chart PPT Sample
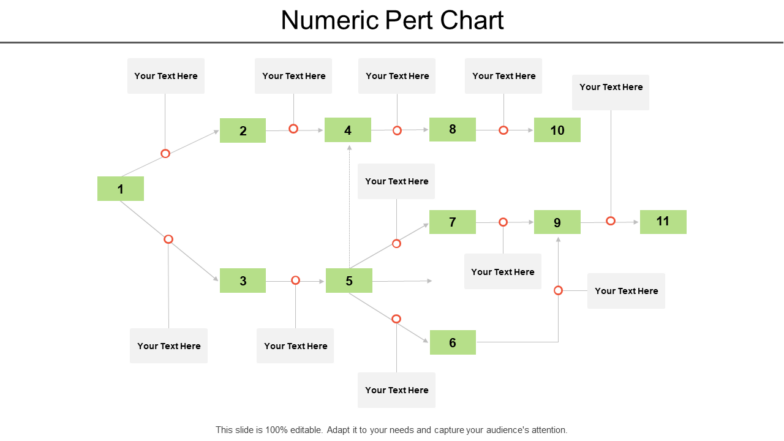
This template is not only a great way to create your project schedule, but it's also an effective communication device. The given numeric PERT Chart design features a design that's intuitive and easy to read, while its state-of-the-art structure will enable you to see at a glance how your project will unfold. You can map out events and tasks involved in the project from start to finish and formulate a viable strategy to ensure the project is successful. Make it yours now!
Template 8: Project Start and End PERT Chart PPT Infographic
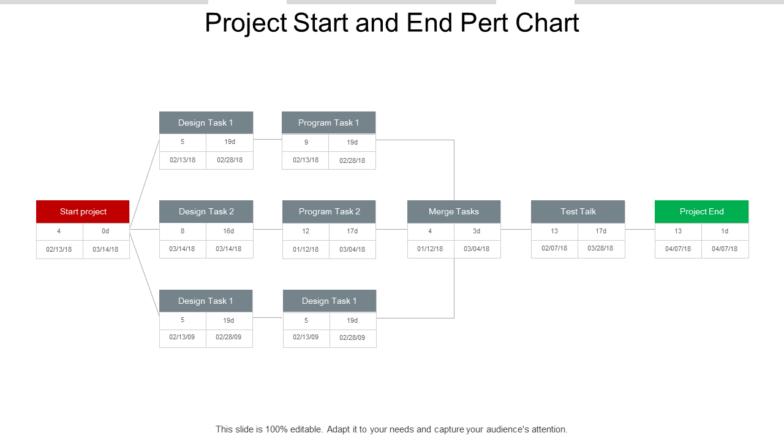
Designed from the ground up to help you with planning and effective management, this template gives you an overview of the project. You can illustrate how the project will progress and what are the stages and phases involved. This information can be further leveraged for tracking productivity, risk management, and delivery. Get it today!
Template 9: Statistical PERT Estimation Worksheet for Revenue Forecasting PPT
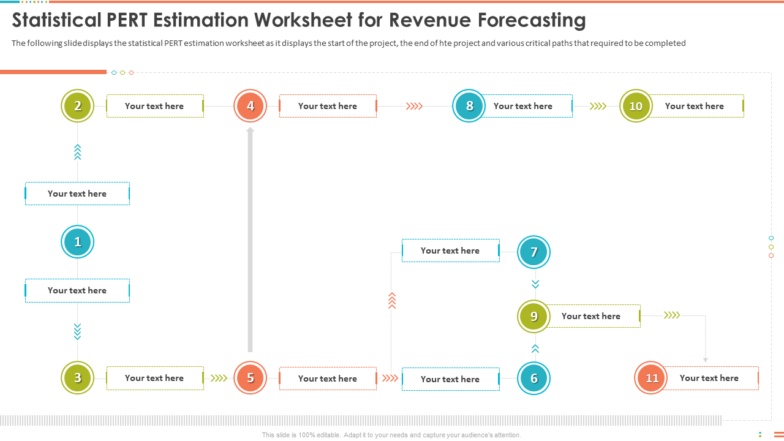
Use this statistical PERT Estimation PowerPoint layout to get the total revenue for the project over time. The design has all details, like events and critical paths that need to be completed. You can use it for project management purposes, such as planning timelines, calculating risks, etc., to curtail uncertainties and maximize productivity. Get it now and assign a percentage to predict how much revenue will be generated if a specific event occurs.
Template 10: PERT Network Diagram Exhibiting Project Scheduling PPT Template
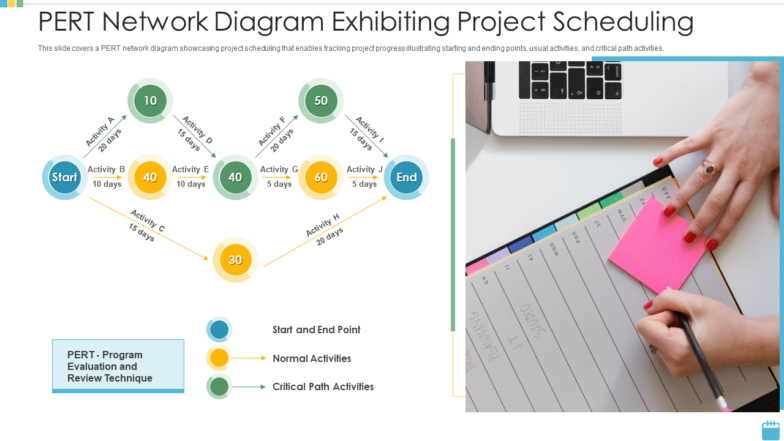
Kickstart your project scheduling activities with this content-ready PERT PowerPoint Template. The diagram will enable you to visualize large-scale projects and break these into smaller, attainable tasks. It contains start and end points, normal activities, and critical paths, which can be used to calculate estimations, requirements, resources, and deadlines. It also provides insight into planning and tracking the progress of each activity. Managers, project leaders, and others love this project. Join their tribe, and download now!
Forecast scientifically!
All of us have been in a situation where we need to forecast projects and timelines but can’t find the right resources or process to do so. Well, now you do! PERT chart is a great solution for your project management needs, and our collection of PERT Chart PPT Templates is the perfect solution to save yourself from the hassle of creating one. The predesigned, editable, and professionally crafted layouts are sure to help you in evaluating critical paths and estimate the cost and time needed for every task involved in an organization's projects. Download them now!
FAQs ON PERT CHART
What is a PERT chart used for?
The PERT chart is used to plan and program a project by breaking down tasks that need to be done into smaller, more manageable chunks. The user can then use it as a guide for completing these tasks efficiently. PERT charts are used to understand the scope, schedule, and network requirements for any development project. The chart can be used for varied tasks such as software development, software testing, configuration management, operations, and maintenance.
What is PERT?
PERT stands for Program Evaluation and Review Technique. It is a project management technique used to plan and manage projects during the implementation phase. It’s a process used by project managers to break down a large project into smaller, manageable chunks that can be worked on at the same time. PERT can be applied to any project, not only software development.
What are the Six Steps in PERT?
The PERT chart is a simple and effective way to plan a project. It is a system used to estimate the time required to complete a project. The PERT chart is a network diagram that shows the dependencies between tasks and their associated duration. The six steps of a PERT chart are:
1. Recognize specific tasks and milestones.
2. Arrange tasks in proper order.
3. Formulate a network diagram.
4. Calculate the time needed for each task.
5. Identify the critical path.
6. Revise the PERT chart in real-time as the project gains momentum





 Customer Reviews



![Top 10 Three-Column Chart Templates to Compare, Contrast, and Visualize Data [Free PDF Attached]](https://www.slideteam.net/wp/wp-content/uploads/2022/02/Top-10-Three-Column-Chart-Templates_1-1013x441.png)


