




 0 Comment
 Customer Reviews

An overwhelming number of businesses (nearly 82% or 4 in every 5) fail due to the inability to track cash flow and costs effectively. That is where the majority of the companies go wrong; they concentrate on making sales yet they do not look at the numbers that matter.
Think about it. You may be making sales, but are you profitable? Without proper financial visualization and real-time financial insights, your business is operating blindly. To stay in operation and flourish, your business requires well-defined profit margin tracking and management of expenses.
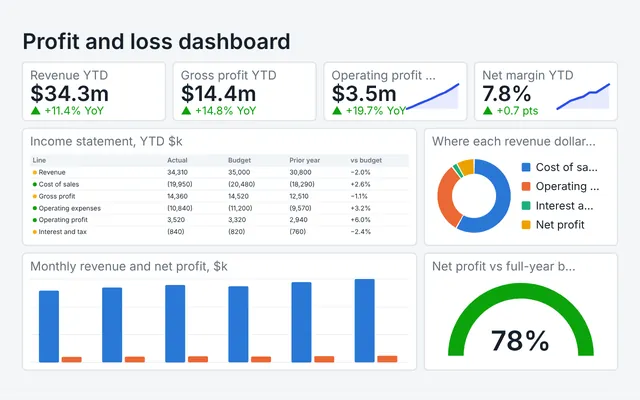
And that is precisely why we made these detailed financial dashboard templates. Our collection has all that you need: P&L analysis, budget vs. actual comparisons, and even full profitability analysis. They are more than just nice charts, but reflect strong business intelligence dashboards that convert hard numbers into simple visuals.
What's the best part? All templates are 100% editable and customizable to match your specific business needs. Stop guessing whether your business made money this month and start knowing for sure. Dive into our monthly P&L dashboard collection and finally get the clarity your finances deserve.
Are you ready to be in control of your business performance measures? Read on to find out what these templates can do for your financial tracking.
Let’s begin!
Template 1: Dynamic Profit and Loss Dashboard PowerPoint Template for Business PPT
The introduction slide presents four numbered sections of benefits, each having a detailed description of financial dashboard implementation. The Visual Insights page describes how to interpret graphical data, the Real-Time Monitoring page describes how to access financial performance instantly, the Trend Analysis page describes how to analyze historical patterns, and the Performance Comparison page describes how to analyze budget vs. actual. The circular dashboard image showcases charts and financial visualization elements, supporting comprehensive business intelligence dashboard displays.

Template 2: Key Components of P&L Dashboard Template
The explanatory slide describes five key elements of a dashboard in detail to provide a thorough analysis of P&L. The revenue section discusses how to monitor the income streams, the expenses section discusses how to analyze the expenses in order to realize savings, the net profit section explains how profitability is determined, the comparative analysis section discusses how to benchmark the capabilities of the industry, and the visual analytics section discusses how to use charts in interpreting data.

Template 3: Company Financial Profit and Loss Dashboard PowerPoint Template
The structure of the complete financial dashboard includes several analytical segments, such as the company revenue and expenses monitoring, the indicator of the total profit percentage, and the charts of the detailed costs breakdown. The design includes profit and loss movement visualization, significant expense segmentation, and revenue source analysis. Key business performance indicators are also important business performance measures as part of the KPI dashboard to present the P&L analysis. Financial reporting tools provide straightforward expense management and revenue tracking capabilities. The template will be a perfect fit to demonstrate profitability analysis based on structured financial visualization.

Your profit and loss numbers deserve better than boring spreadsheets that put everyone to sleep. Transform your financial story with stunning graph templates that
actually make sense to your audience.
Template 4: Finance Profit and Loss Dashboard PPT Template
The professional financial reporting format presents major performance metrics like gross profit margin, operating profit margin, net profit margin and operational expense ratios. Includes charts of revenue analysis and cost analysis, earnings tracking, and presentation of income statement in detail. The dashboard contains monthly tracking of operational expenses and the year to date financial performance measures. The key financial visualization elements facilitate an efficient P&L analysis, expense management and revenue tracking functionality. Business performance metrics are presented in dashboards that are well structured KPI dashboards and business intelligence dashboard reporting.

Template 5: Business Profit and Loss Tracking Software Dashboard PowerPoint Template
The dashboard presents four key indicators of financial performance, including gross profit margin, operational expense ratio, and operating profit margin, and customizable metrics sections. The format contains detailed operational expenditure tracking charts, detailed presentation of the income statement, and visualization of the monthly earnings. The financial reporting tools aid in effective management of expenses, tracking revenues and profitability analysis. The slide is ideal to display business performance data in structured financial visualization.

Template 6: Profit and Loss Dashboard for Managing Accounting Control PPT Template
The dashboard is a multi-purpose financial instrument revealing the total profit margin, the outstanding revenue, consumer growth analysis, and detailed expense categorization charts. The dashboard comprises the visualization of payment status, the analysis of the six-month revenue trend, and the measurement of the customer acquisition. Key business performance indicators help in good management of expenses, monitoring revenue, and profitability presentation. The structured KPI dashboard components, detailed P&L analysis, and the financial visualization framework is perfect to showcase financial health indicators, which provides a complete business intelligence dashboard reporting and data analytics to finance.

Template 7: Profit & Loss Dashboard with Income and Expenses Trend by Dept Slide
The structure of the departmental financial analysis will have a breakdown of the net income, revenue distribution charts and detailed expense monitoring of each department. The dashboard has income trend visualization, expense trend monitoring, and departmental performance analysis. The necessary financial reporting systems serve to help in the tracking of revenues, expenses, and profitability of the organization across departments. This dashboard displays the business performance, with properly organized KPI dashboard features, deep P&L analysis and complex financial visualization, which allows intensive data analytics data reporting with finance and business intelligence dashboards.

Template 8: Working Capital Dashboard with Profit and Loss Analysis Template
The template offers financial analysis layout that includes a profit analysis tracking panel, instant account summaries, an income and expense monitoring panel, and a detailed expense classification. The dashboard also contains the visualization of the trend of net profit, charts of cash flow analysis, and asset and liability breakdowns. Key business performance indicators facilitate effective expense control, revenue monitoring, and working capital analysis. The dashboard effectively showcases financial health metrics through structured KPI dashboard components, comprehensive P&L analysis, and structured financial visualization, enabling comprehensive business intelligence dashboard reporting and financial data analytics.

Template 9: Profit and Loss Statement Dashboard to Assess Company Performance
This template discusses a financial evaluation with elaborate profit reports, structural dynamics, sales monitoring, and ratio displays. The dashboard includes the EBITDA, profitability, debt coverage, and creditworthiness measurement charts. Critical business performance KPIs enable meaningful P&L analysis, revenue tracking and financial health analysis with structured KPI dashboard components, extensive financial reporting solutions and financial visualization of business intelligence purposes and data analytics functionality.

Template 10: Monthly Profit and Loss Statement Analysis Dashboard PPT Slide
The given slide is about the in-depth monthly financial tracking including profit statement segmentation, net revenue, cost analysis, and gross profit graphical display systems. The dashboard has extensive expense tracking, income analysis, interest tracking, and net earnings presentation. Financial reporting tools required to have effective revenue tracking, expense control, and monthly profitability analysis by means of organized KPI dashboard components, full P&L analysis, and structured financial visualization to be used as business intelligence reporting and improved data analytics application.

Template 11: Working Capital Dashboard With Profit and Loss Summary PPT Slide
This PPT discusses the detailed working capital analysis with the tracking of account receivable, payable tracking, equity ratio visualization, and aging analysis charts. The dashboard includes the indicators of current ratio, working capital comparisons, and profit summary presentation. Indicators of financial health are critical to the management of cash flow, revenue monitoring, and capital optimization with structured elements of KPI dashboard, complete P&L analysis, and financial visualization of business intelligence dashboard reporting applications and powerful data analytics capabilities.
[product_image id=650584]
Ready to Transform Your Financial Reporting?
These detailed dashboard templates provide data needed to transform complicated numerical data into business action. Each template focuses on a specific aspect of the financial well-being of an organization, as it follows the activity of a particular month and analyzes each separate department. These tools allow users to identify trends, identify anomalies, and share critical results with team members through interesting charts and a clear structure. These resources make it easy to communicate financial information whether it is during presentations to investors or quarterly strategies.
PS Ready to turn your financial chaos into crystal-clear insights that drive real decisions? Explore these game-changing profitability dashboards and watch your business intelligence soar to new heights.
FAQs on Profit and Loss Dashboard PPT Templates
1. What key metrics are essential to include on a P&L Dashboard?
Essential metrics include gross profit margin, operating profit margin, net profit margin, and revenue tracking. You should also display expense management categories, cost of goods sold, and operational expenses ratios. Key performance indicators like EBITDA, expense trends, and profit margin tracking help stakeholders understand your business performance metrics clearly.
2. How do you build a Profit & Loss Dashboard step by step?
Start by identifying your core financial data sources and key performance indicators you want to track. Choose appropriate charts for revenue tracking, expense management, and profitability analysis visualization. Finally, organize sections logically with clear headings, ensuring your financial dashboard displays real-time financial insights that support effective decision-making.
3. What's the difference between cash‑based and accrual‑based P&L Dashboards?
Cash-based dashboards show revenue and expenses only when money actually changes hands, focusing on immediate cash flow. Accrual-based dashboards record transactions when they occur, regardless of payment timing, providing comprehensive business performance metrics.