





 0 Comment
 Customer Reviews

The deck's done. The service scores aren't.
Someone pulled the customer satisfaction numbers last quarter and they're not where they should be. The team knows it. The managers know it. But what nobody can quite agree on is where things went wrong. Was it the promise? The process? The person who picked up the phone?
That's the uncomfortable part. Service failures rarely announce themselves clearly. A customer doesn't say "you have a knowledge gap between your front-line staff and your management." They just don't come back. They leave a two-star review that says "not what I expected." And internally, everyone points somewhere else.
The Gap Model of Service Quality—developed by Parasuraman, Zeithaml, and Berry—exists because this problem is old and common enough that researchers built a framework around it. It maps the distance between what customers expect and what they actually get, across five distinct gaps. And the uncomfortable truth it surfaces is this: most service failures aren't random. They're structural. Predictable, even, once you know where to look.
Getting leadership to see that is a different challenge. Saying "we have a service delivery gap" in a meeting doesn't land the same as showing it. The model needs a visual. The framework needs structure. And the person presenting it probably doesn't have three days to build slides from scratch—because the analysis itself already took three days.
That's where SlideTeam's pre-designed templates come in. They're built specifically for this kind of work—mapping customer expectations against perceived service, illustrating the SERVQUAL model, walking through each of the five gaps with enough clarity that a room full of stakeholders can actually follow. Content-ready layouts that hold the framework so you can focus on the findings.
What follows are the templates that do the structural work, so you don't have to.
Template 1: Gap Model of Service Quality PowerPoint Shapes
Service failures rarely trace back to a single breakdown point. This PowerPoint slide maps all seven stages of the gap model, from management perceptions of consumer expectations through to external communication to customers. It gives quality analysts and operations leads a complete visual arc of where service reality diverges from customer expectation. Use it to anchor a team debrief, a boardroom review, or a service quality gap analysis presentation for senior stakeholders. The template is 100% editable and customizable.

Download this PowerPoint Template
Template 2: Service Quality Model and Method for Gap Analysis
Bridging the space between customer perception and service provider reality is where most quality conversations stall. This PPT template covers the service quality gap model across communication, service requirements, and the customer-provider divide. It's the kind of structured slide a CX lead or service manager reaches for when they need to align two teams that are measuring success differently. For context, this deck works well in cross-functional workshops where assumptions need to be surfaced fast. The template is 100% editable and customizable.

Download this PowerPoint Template
Template 3: Gap Model of Service Quality PowerPoint Themes
Not every gap analysis needs a dense diagram. This PPT preset keeps it clean — a five-stage visual that lets the framework speak without clutter. Service quality teams use it when the audience is mixed and the goal is orientation, not deep-dive. It's a reliable starting point for any presentation that needs to introduce the gap model before moving into specifics. The template is 100% editable and customizable.

Download this PowerPoint Template
Template 4: 5-Stage Gap Model of Service Quality PowerPoint Slide Deck Samples
The five-gap structure of the Parasuraman Zeithaml Berry model is well-known in theory; presenting it clearly to a non-specialist audience is harder than it looks. This PPT slide deck samples that structure across five distinct stages, giving presenters a scaffolded way to walk stakeholders through each gap without losing the thread. Service quality managers and consultants reach for this when the room needs the full picture before the data comes in. The template is 100% editable and customizable.

Download this PowerPoint Template
Template 5: Performance Gap in Service Quality Single-Slide PPT Explanation
Performance gaps in service delivery are often the most visible — and the hardest to explain without a clear visual frame. This PPT template isolates the performance gap specifically, making it useful for operations teams that already understand the broader model and need to focus their audience on one critical breakdown. So yeah, this slide works well in quarterly reviews where the numbers tell part of the story and the slide tells the rest. The template is 100% editable and customizable.

Download this PowerPoint Template
Template 6: 5 Gaps of Service Quality Model Articulation PowerPoint Slide Backgrounds
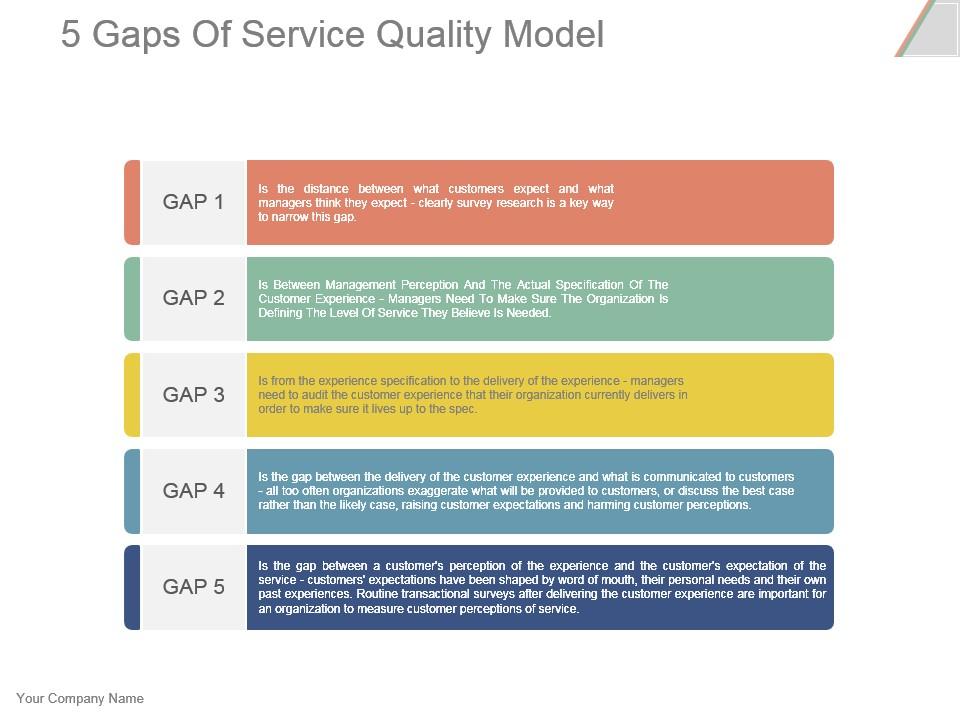
Mapping all five service quality gaps in a single visual is a challenge most presenters avoid — because getting the hierarchy right matters. This deck delivers a five-stage process that connects business, strategy, service quality, and marketing into one coherent view. The structured layout lets you articulate how each gap flows into the next, giving your audience a clear picture of systemic service breakdowns. Compelling visualisations turn abstract gap theory into persuasive, actionable clarity. Transform your service quality presentations today. Download this dynamic template now and unlock your team's diagnostic potential.
Download this PowerPoint Template
Template 7: Service Gap Model Sample of PPT Presentation
Most service gap models stop at five stages. This PowerPoint slide goes to seven, capturing the full journey from word-of-mouth communication and personal needs through to external communication to customers. For practitioners in hospitality service quality or retail service quality, the added granularity matters — it reflects how customer expectations actually form, not just how they're measured. Use it when the audience needs to understand the customer's full pre-service experience before discussing perceived service outcomes. The template is 100% editable and customizable.

Download this PowerPoint Template
Template 8: 4-Tier Service Quality Gap Analysis Presentation Ideas PPT
Gap analysis in service quality often gets presented as a diagnostic exercise divorced from business priorities. This PPT preset reframes that — its four-stage structure ties gap identification to investment allocation and value optimisation decisions. It's the slide a business analyst or consultant reaches for when the audience is less interested in service theory and more focused on where to act first. For context, it fits naturally into strategic planning sessions where resource decisions and service improvement intersect. The template is 100% editable and customizable.

Download this PowerPoint Template
Template 9: Five Dimensions of Quality in Service Promotion
Reliability, tangibility, empathy, responsiveness, assurance—these five service quality dimensions are the backbone of the SERVQUAL model, and this template brings them to life visually. The intuitive five-stage layout delivers instant clarity on what drives customer perception of quality across each dimension. A clean, professional structure ensures your audience grasps the interconnection between these determinants without losing attention. Use this to anchor service quality assessment presentations, training decks, or customer experience strategy reviews. Transform your service quality dimension discussions with precision. Download this dynamic template now and elevate your team's measurement approach.

Download this PowerPoint Template
Template 10: Service Quality Gap Analysis Diagram Key to Differentiation PPT Slide
Different audiences need different angles into the same gap analysis. This deck offers four distinct diagram configurations, letting presenters choose the visual frame that matches their specific service quality scenario — whether that's investment allocation, value optimisation, or assumption-testing. It's practical for consultants who run gap analysis workshops across multiple clients or sectors and need flexible visual options without rebuilding from scratch each time. The template is 100% editable and customizable.

Download this PowerPoint Template
Template 11: Network Quality Service Optimization Model
QoS optimization in network services follows a logic similar to the gap model — identify what performance should look like, measure what's actually delivered, and close the distance. This PPT slide makes that process concrete, covering optimization goals, decision variables, constraints, and fixed parameters in a four-stage structure. It's built for IT leads and network managers who need to present real-time control decisions to stakeholders without getting lost in technical detail. The template is 100% editable and customizable.
[product_image id=1090661]
Template 12: Research Strategy of Service Quality Assessment
Designing a research approach to service quality assessment is less about methodology and more about knowing what you're actually trying to measure. This PowerPoint slide gives quality researchers and service managers a clean, single-stage framework covering implementation, process, and analysis — enough structure to anchor a research design discussion without over-complicating it. It fits well in academic or consultancy settings where the audience needs to agree on approach before data collection begins. The template is 100% editable and customizable.

Download this PowerPoint Template
Template 13: Service Quality Gap Analysis Final Perception Customer PPT Infographic Template
A four-stage infographic that traces the complete path from customer expectations to perceived service output—this template makes the gap model immediately readable for mixed audiences. The visual arc connects word-of-mouth inputs and personal needs through management perceptions, service specifications, and delivery, ending at the customer's final perception. Marketing managers and service designers use it to show how each handoff either preserves or erodes service quality. Compelling structure ensures the model lands cleanly, even with non-specialist stakeholders in the room. Transform your gap analysis presentations with visual precision. Download this dynamic template now and make your service quality story impossible to ignore.

Download this PowerPoint Template
Template 14: Service Quality Specification Service Quality Gaps Poor Market Segmentation
Service quality gaps frequently originate in poor market segmentation—where specifications are built for an assumed customer rather than the actual one. This six-stage graphic surfaces that connection explicitly, linking service quality specifications, quality gaps, and segmentation failures in one coherent visual. Brand managers and service designers reach for it when they need to make the case that quality problems are often upstream decisions, not front-line failures. Elevate your service standards presentations with a framework that drives real accountability. Download this dynamic template now and unlock sharper gap diagnostics across your organisation.

Download this PowerPoint Template
Template 15: Service Quality Delivery Model for Success Working Channels PPT
Delivering service quality at scale requires more than good intentions—it needs a model that connects every touchpoint. This template maps a full service delivery ecosystem, from portals and chatbots to integrated systems, corporate groups, and centres of expertise. Service operations leaders use it to show how problem resolution and customer communication channels work together—or don't. The structured layout creates clarity across complex, multi-channel delivery environments. Transform your service quality delivery presentations today. Download this dynamic template now and drive operational alignment across every customer touchpoint.

Download this PowerPoint Template
Elevate Every Service Interaction with SlideTeam
SlideTeam's PowerPoint templates are the best in the industry for presenting the Gap Model of Service Quality with clarity and authority. These content-ready slides save hours of design time while delivering professional structure across every gap — from knowledge gaps to service delivery failures. Use these PowerPoint slides to align your teams, sharpen your service quality assessment, and make the case for real improvement. Deploy these ready-made frameworks and turn complex service gap analysis into decisions stakeholders actually act on.
FAQs on Gap Model of Service Quality
How does the Gap Model of Service Quality help organizations identify the root causes of service failures rather than just their symptoms?
The model traces service failure back through five structured gaps — from management perception to external communication — so teams stop fixing symptoms and start fixing sources. Each gap points to a specific breakdown: a wrong assumption, a missing standard, an unmet promise. This forces a root cause conversation, not just a performance review. Organisations use it to locate exactly where the customer experience starts to degrade.
What distinguishes the knowledge gap from the communication gap in the context of customer service delivery?
The knowledge gap is what management doesn't know about customer expectations. The communication gap is the mismatch between what the organisation promises and what it actually delivers. One is an internal information failure; the other is an external credibility failure. Both damage customer trust, but they require different fixes — research closes the knowledge gap; consistent messaging closes the communication gap.
How can a company effectively measure and close Gap 1 between customer expectations and management perception?
Start with direct customer research — surveys, interviews, and complaint analysis — to surface what customers actually expect. Then compare those findings against what management believes customers want. Regular feedback loops, front-line staff input, and SERVQUAL-style measurement help close this gap systematically. The goal is to replace assumptions with evidence before service standards are ever written.
In what ways does employee empowerment directly influence the size of Gap 3 in service delivery?
Gap 3 is the delivery gap — the distance between service standards and actual service delivered. Empowered employees can make real-time decisions that keep delivery on standard without waiting for approval chains. When staff lack authority to resolve problems, the gap widens. Giving employees clear boundaries within which they can act independently is the most direct lever organisations have on Gap 3.
How does the Gap Model apply differently to digital service environments compared to traditional brick-and-mortar businesses?
In digital services, the knowledge and standards gaps often appear in algorithm design and UX decisions rather than human interactions. Gap 3 shows up as system latency, broken flows, or unhelpful chatbots. The communication gap surfaces through misleading onboarding copy or feature promises that don't match reality. The model applies equally — the channels are different, but the structural gaps are the same.
What role does internal marketing play in minimizing the policy gap within service organizations?
The policy gap — Gap 2 — occurs when service standards don't reflect what customers actually need. Internal marketing ensures front-line teams understand those standards and believe in them enough to deliver consistently. When employees treat standards as arbitrary rules, delivery suffers. Internal marketing aligns staff around the customer logic behind each standard, which is what makes consistent execution possible.
How can service blueprinting be used as a practical tool to address the delivery gap in complex service operations?
A service blueprint maps every step of service delivery — front-stage, back-stage, and support processes — against the customer journey. This makes the delivery gap visible at each handoff point, not just at the final outcome. Teams can identify where delays, miscommunications, or missing resources create the gap. It turns an abstract quality problem into a concrete process problem with specific owners and fix points.
Why do customer expectations continue to shift over time, and how does this dynamic affect the persistence of Gap 5?
Customer expectations shift as experience accumulates, competitors raise the bar, and word of mouth sets new reference points. Gap 5 — the difference between expected and perceived service — never closes permanently because the benchmark keeps moving. Organisations that measure perceived service quality regularly can track the drift and adjust before the gap becomes visible in churn or complaints. Continuous measurement is the only durable response.