Remember those tiring math lectures as a kid, before the tricky trigonometry and algebra complicated our lives? The time when everything was straightforward and revolved around basic charts and graphs. Yes, all the ‘fun’ stuff. Well, keep hold of those fun memories as they will help you navigate through this guide to Pareto charts and get the hang of the key fundamentals.
The history and evolution of Pareto chart
Pareto analysis was first practiced in the 1940s by quality control pioneer Joseph Juran. He revealed that 80% of the defects stem from 20% of problems, which led to the origination of this rule.
In the simplest form, a Pareto chart is a bar graph arranged in descending order (largest to smallest) from left to right. The biggest bar is presented on the left side and is more important than the smaller bars. The corporate sector mainly uses it for root-cause analysis, making it a vital part of quality management and its counterparts.
However, over the years, this 80/20 principle became highly cited, especially in the economic space, to draw conclusions about inputs and results. Thereafter it flooded every industry vertical, finding applications in quality control and management.
This is also referred to as the 80/20 rule because of the general principle of observation that states that 80% of the outcomes result from 20% causes. For example:
- 80% of the total sales are attributed to 20% of customer liking and trends
- 90% of product complaints in a call center are made by 10% of the clients
- 80% positive results come from 20% of the hardworking team members
- 80% of wealth is acquired by 20% of the people
And so, it is evident that the Pareto chart is a great prioritization tool for organizations to pick the low-hanging fruit!
Not just corporates, but even pop culture has featured noticeable mentions of the Pareto chart. The latest example is the critically-acclaimed Netflix docuseries, The Last Dance, which showcases the exceptional yet brutal account of the Chicago Bulls featuring countless victories by three popular players: Michael Jordan, Dennis Rodman, and Scottie Pippen. All thanks to the Pareto chart that their coach Phil Jackson uses, and, of course, their efforts, the cagers are able to script history.
So my dear cagers, let’s shoot the shot and explore these cherry-picked Pareto chart templates because every company needs one (or will need one someday)!
Pareto chart templates top entrepreneurs swear by
Whether you are a startup or seasoned individual looking to showcase your revolutionary business ideas, the 80/20 rule aka the Pareto principle is a prerequisite. After all, it is applicable to both personal and professional life. The following examples offer some great designs that can be tailored to suit any industry.
Let us seek these designs, weigh their individual elements, and download the best ones from the lot!
Template 1
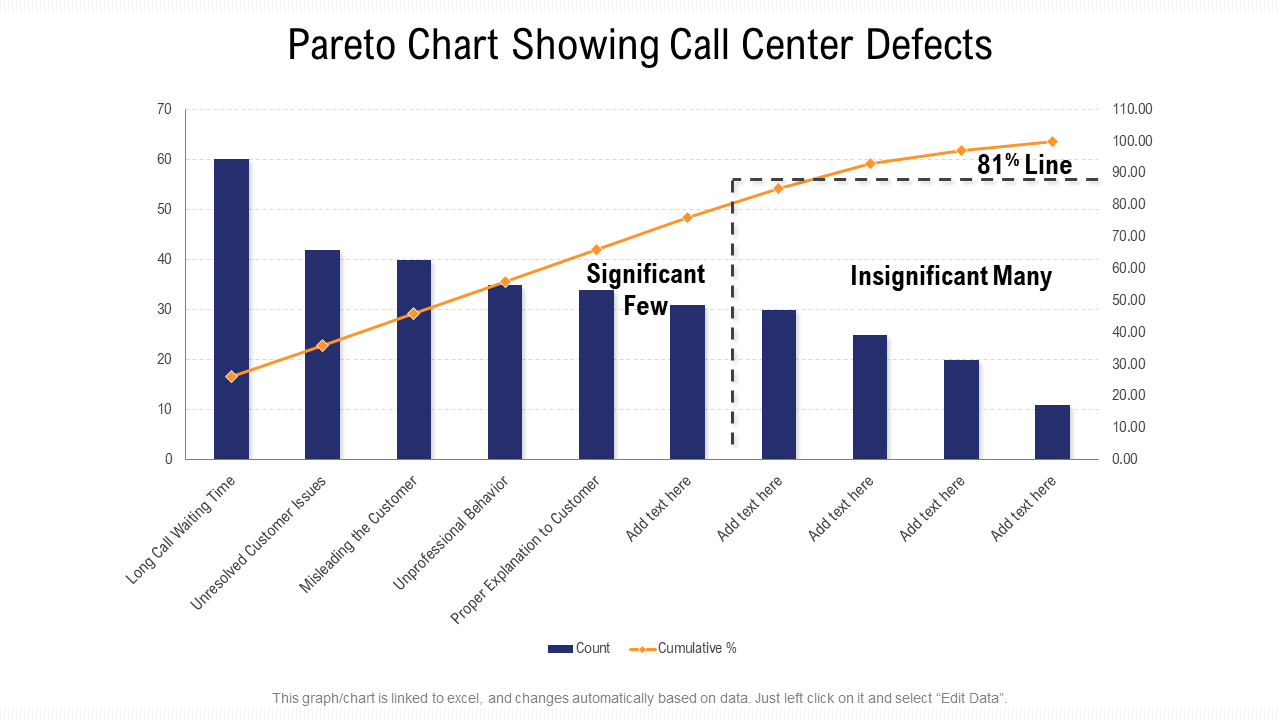
Managers, executives, and entrepreneurs can advocate this Pareto chart template to create real data charts that can be shared with a group of people. Many different scenarios can be clearly shown through this data chart as we have done here. Thus, this template is not only fit for observational purposes but also for judging various parameters, changing which can bring high ROI and other positive results for the organization.
Download Pareto Chart Showing Call Center Defects
Template 2
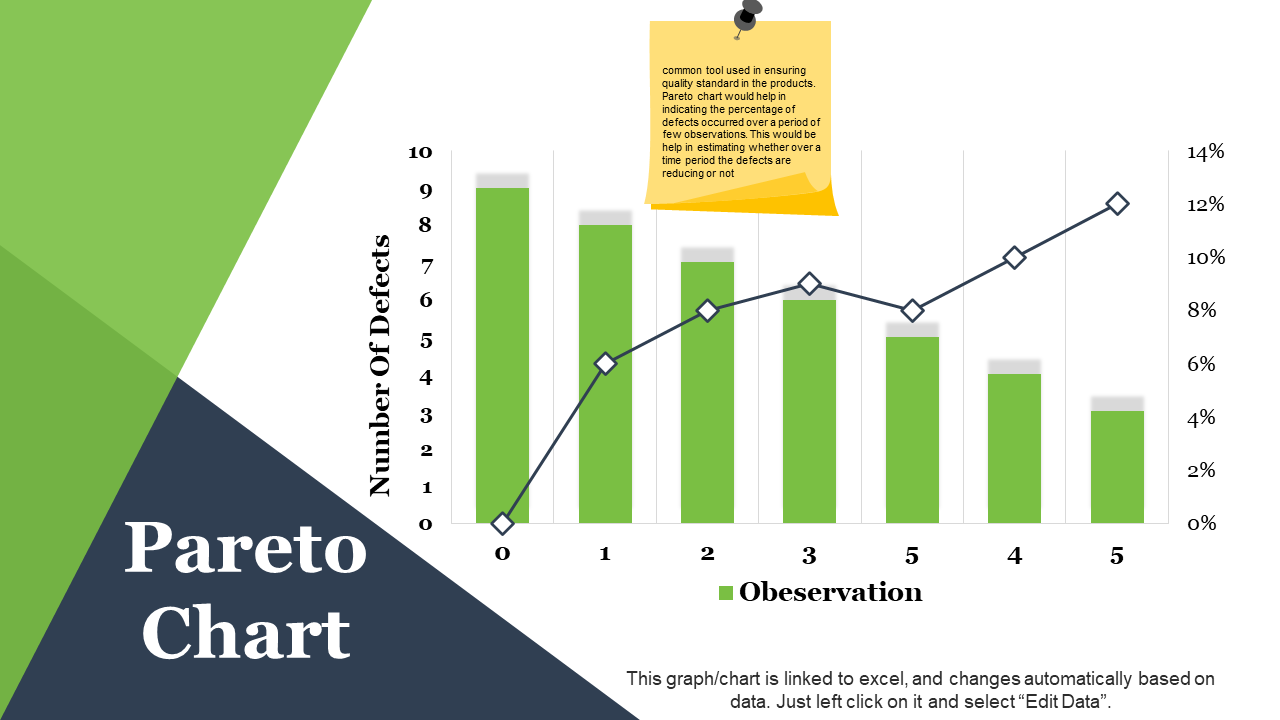
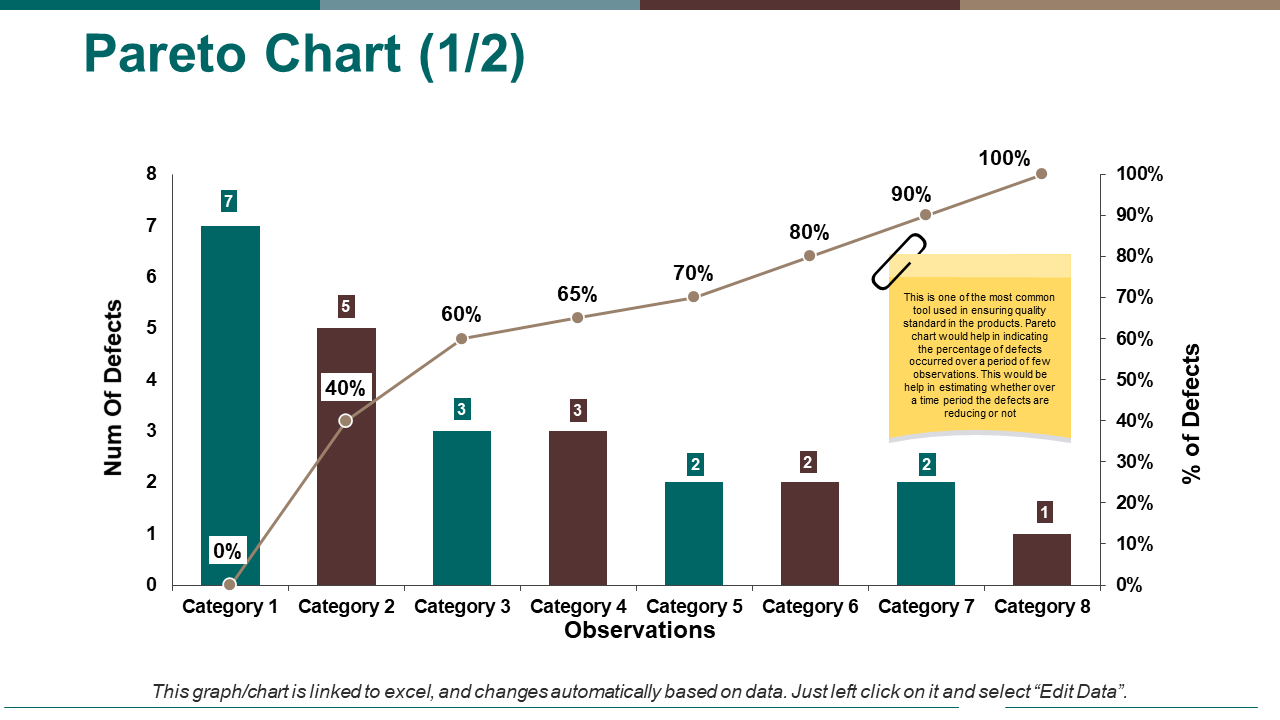
Charts and graphs occupy a different place in business presentations. However, they take hours of effort to construct and make them readable for the spectators. Thus, we have designed this Pareto chart template that will reflect various values and their afflictions without any difficulty. This template is best for problem-solving and other brainstorming issues that come up during team meetings, business seminars, and others. Also, since it is predesigned, it is a valuable asset for both experts and novices to download and use.
Download Pareto Chart PowerPoint Slide Images
Template 3
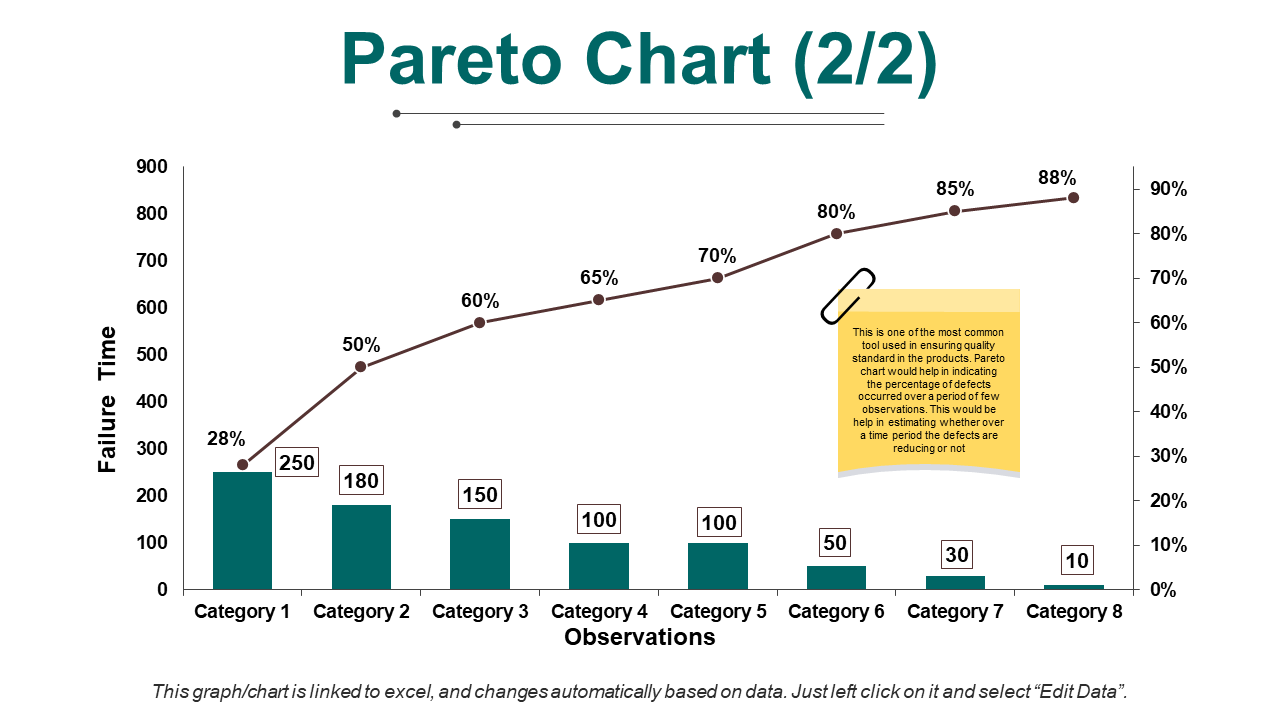
If you struggle with chart creation and depiction of data sets, then this template is the right fit for you. It reflects a series of categories that can be added as per your business needs. It is also very easy to understand and can be widely used for analyzing various parameters and the different impacts they have on the structure. Yes, all this and a lot more with this problem-solving Pareto chart design. Therefore, grab it now!
Template 4
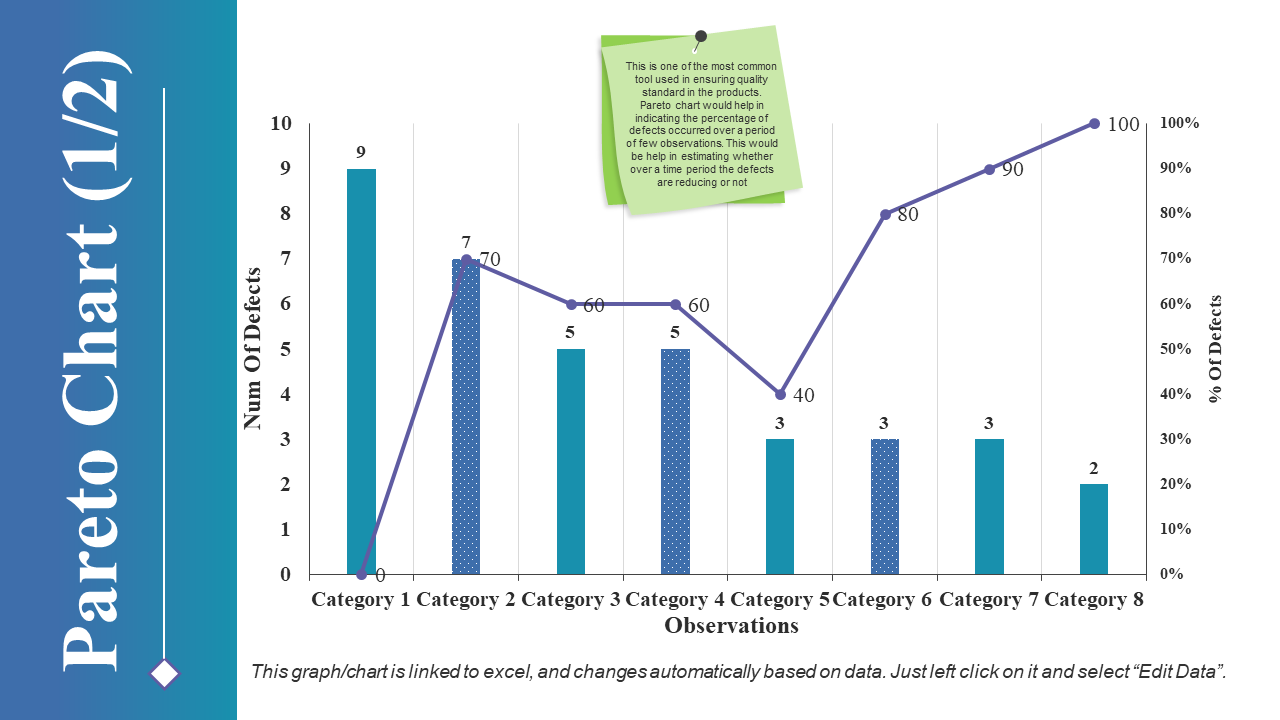
Plot various variables and present their data using this Pareto chart template. This is a data-driven chart and so it is very useful for business leaders, executives, and entrepreneurs to analyze different scenarios. Also, since this is an editable layout, it allows numerous changes and adjustments.
Download Pareto Chart PPT Style Graphic
Template 5
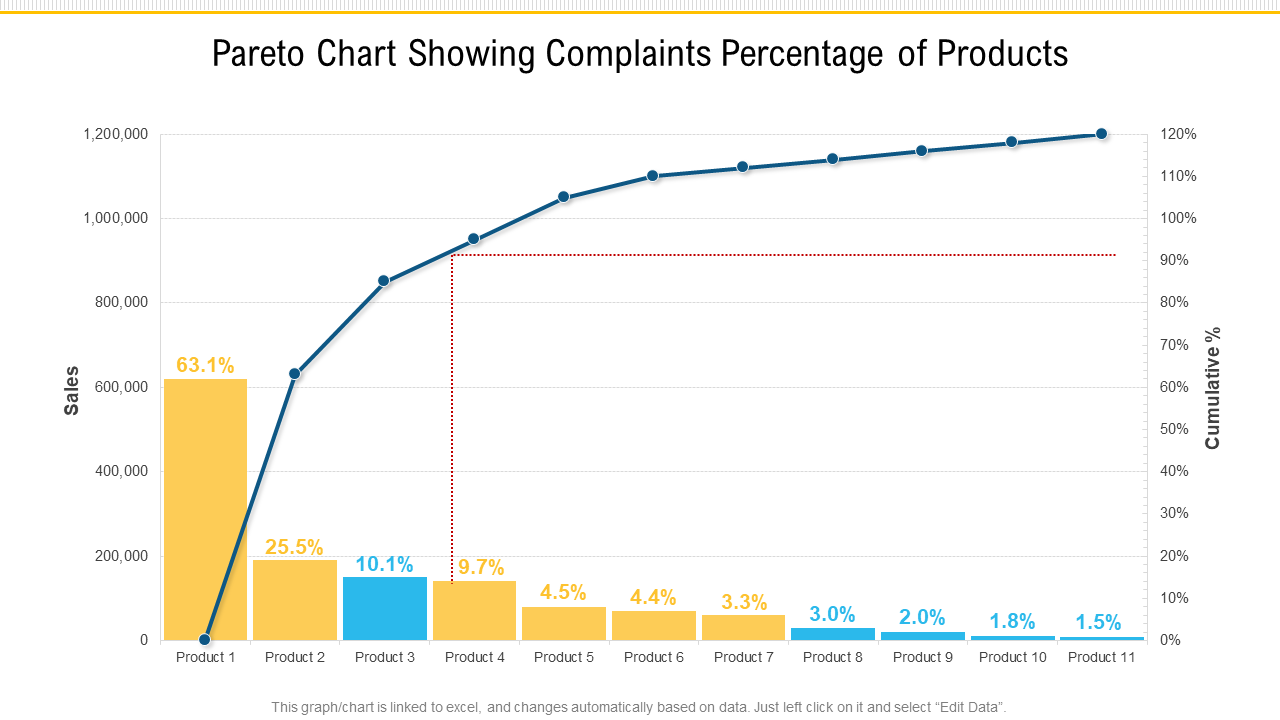
Present and plot various values of customer complaints here in this template, which comes linked with Excel. This template can be put to use for various types of problem analysis activities conducted by your organization and the service industry to make informed decisions. With the assistance of this chart, you can rank various issues and illustrate which have a greater impact on the system.
Download Pareto Chart Showing Complaints Percentage Of Products
Template 6
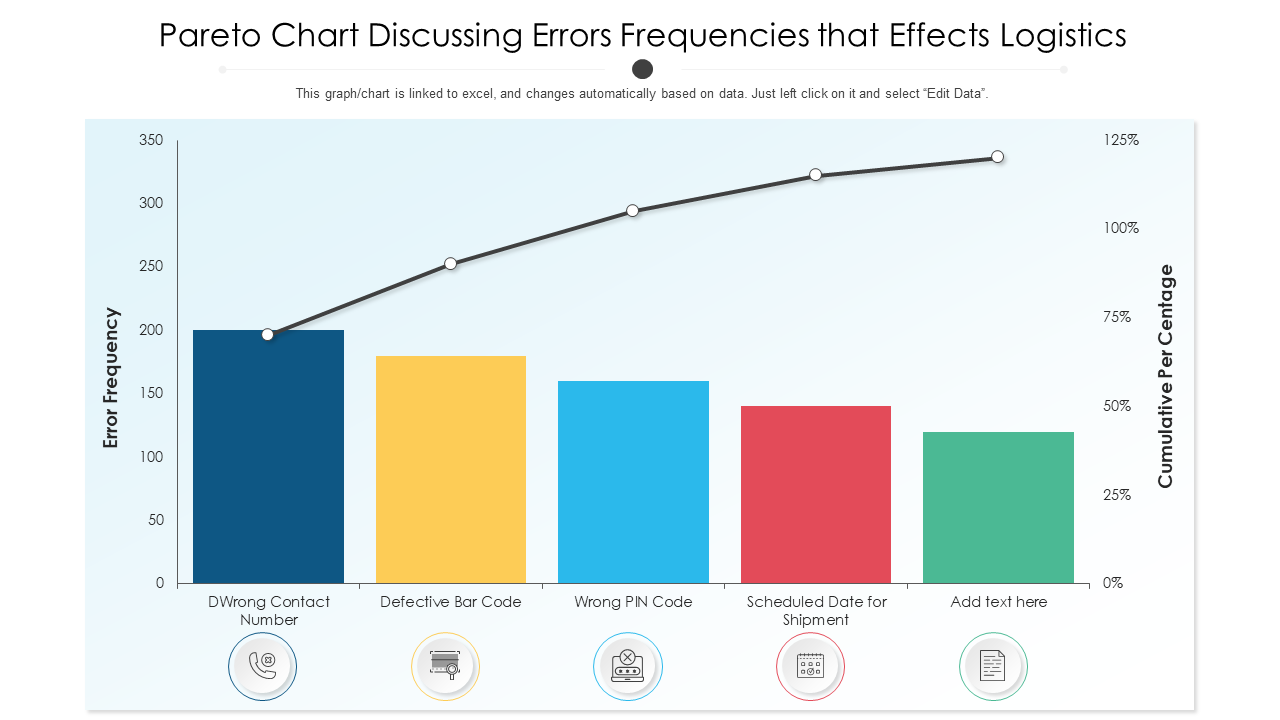
This Pareto chart design acts as a great fault-finding tool because of its pragmatic structure. It can assist you in judging various parameters in logistics that are not bringing variable results to the organization. You can also utilize it to evaluate different variables and their afflictions that are causing serious issues in the system. Since this is a professionally crafted template, it functions well for every industry and domain, the data of which is inputted by the user.
Download Pareto Chart Discussing Errors
Template 7
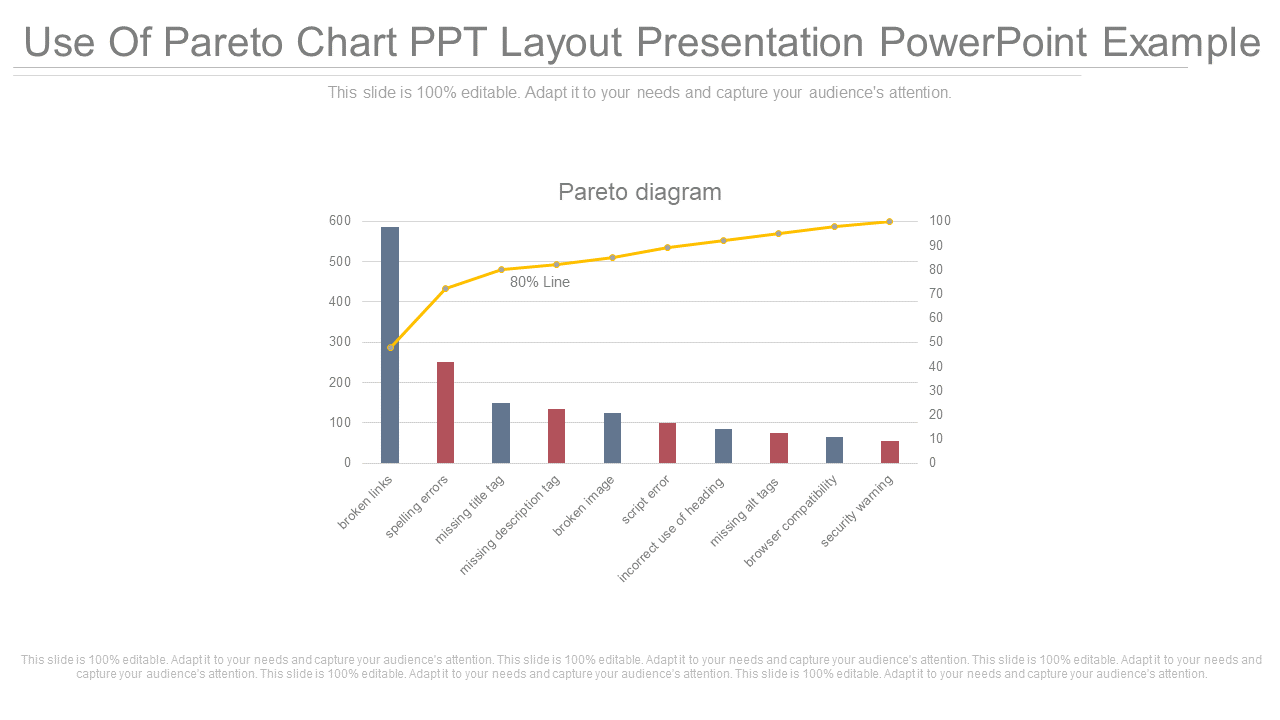
Various variables and data findings can be reflected using this Pareto chart design. It is a data-driven chart that can assist business leaders, executives, and entrepreneurs in analyzing different scenarios and phenomena. Therefore, grab it now!
Download Use Of Pareto Chart PPT Layout
Template 8
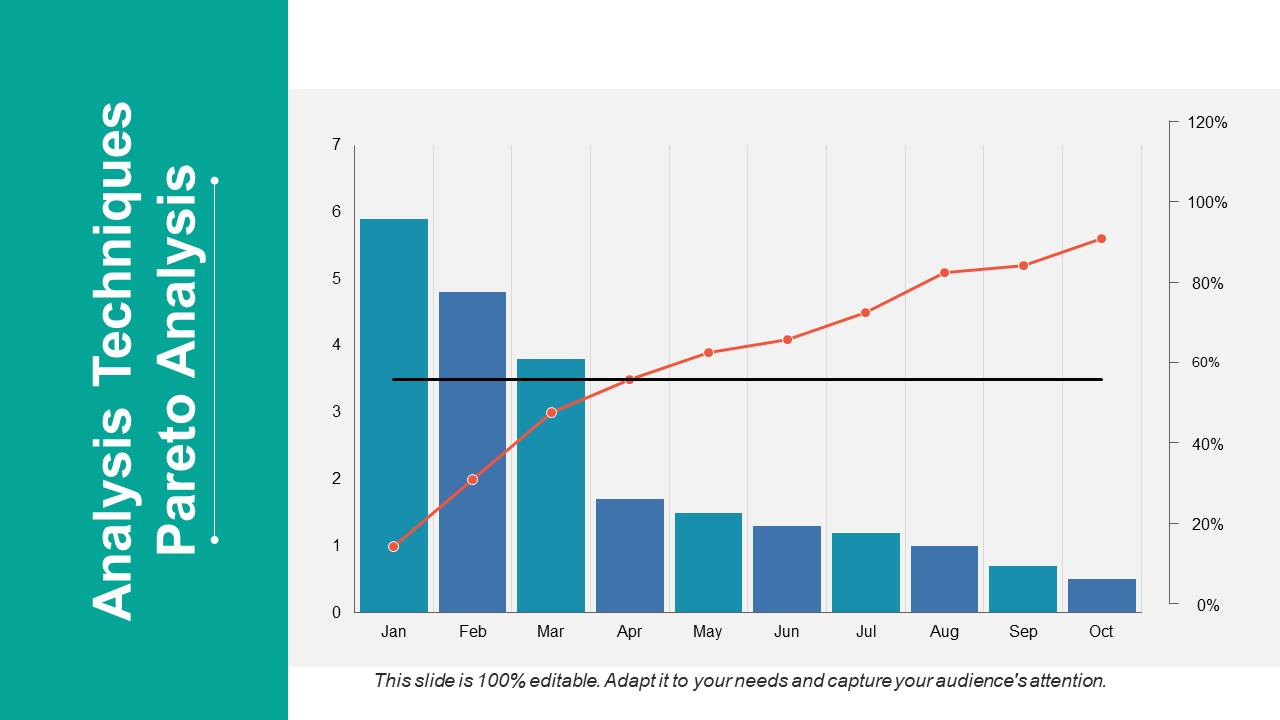
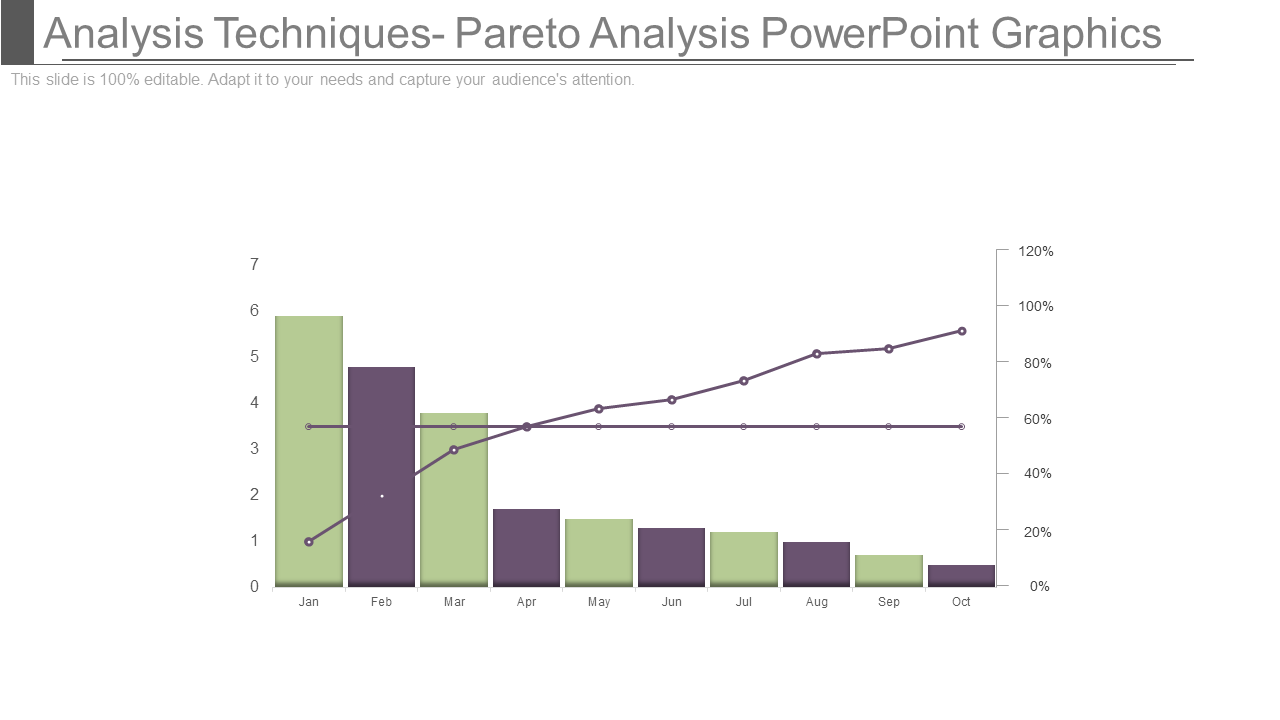
The Pareto principle and its applications can be discussed with this PowerPoint template. You can showcase different phenomena using this static version that can easily be molded and adjusted. Since this is a data-driven Pareto chart design, it allows complete visual customization without any resolution and display issue.
Download Analysis Techniques Pareto Analysis PPT
Template 9
This is a great investment for representing any kind of cause and effect factors and their implications. It adds a new charm to your business presentation as it is easily editable, very comprehensive, and user-friendly.
Download Analysis Techniques Pareto Analysis PowerPoint Graphic
Template 10
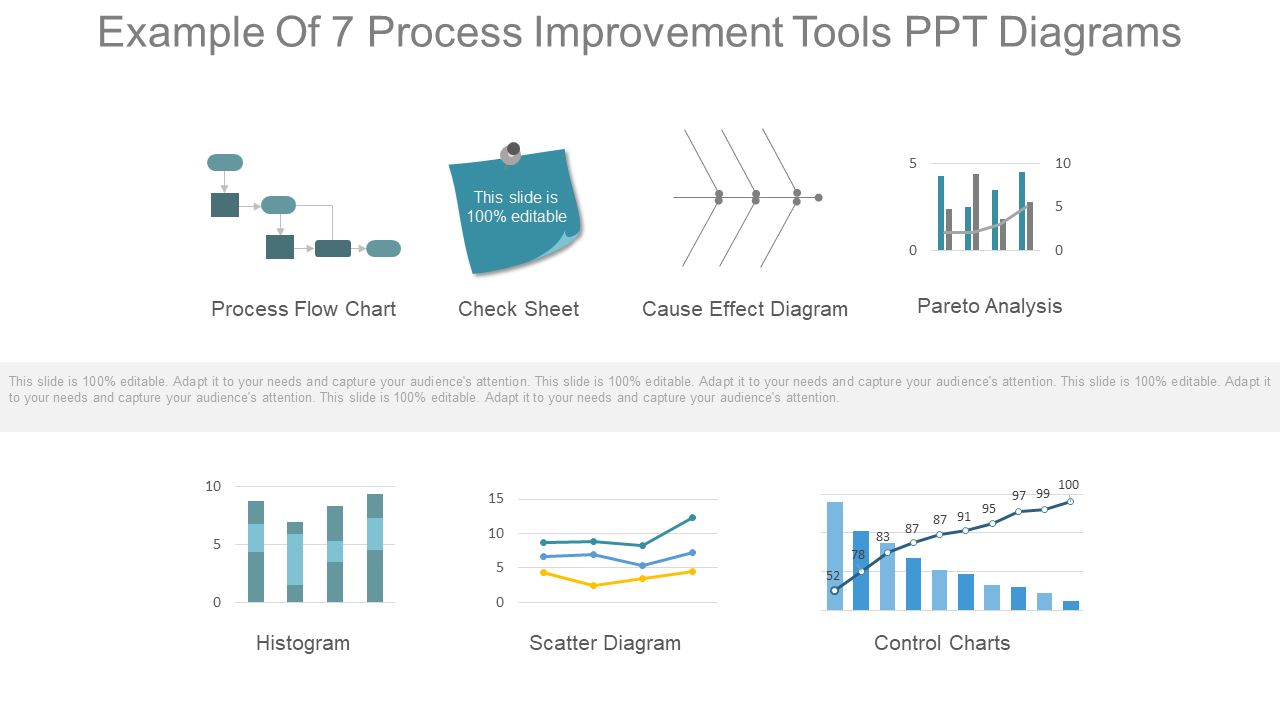
This template shows a number of charts and graphs that can be used for portraying cause and effect relationship between different variables. We have included seven diagrams in this single slide, including histogram, scatter diagram, bar chart, Pareto chart, etc. You can easily adjust them as per your liking.
Download Example Of 7 Process Improvement Tools
Template 11
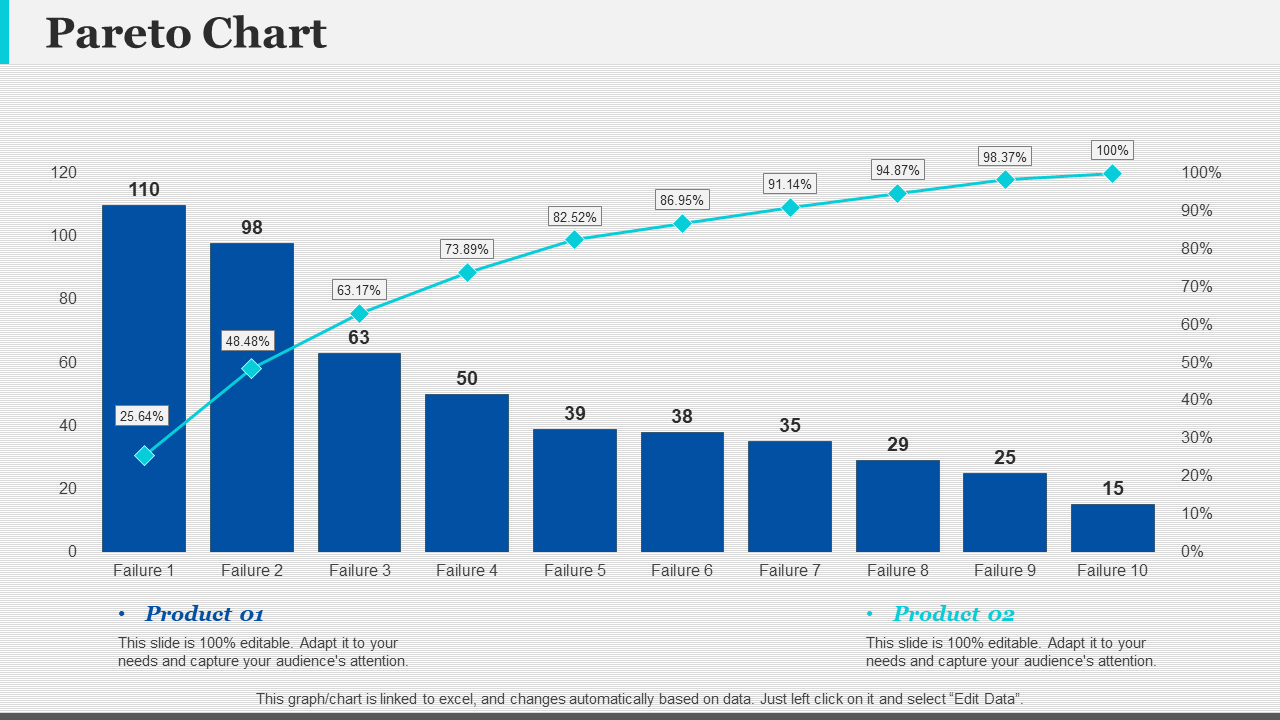
This set offers a data-driven chart that gives you full control over its customization. Therefore, regardless of the industry and your niche, this Pareto chart can be used to reflect any variables that hinder your system, thus making your evaluation and analysis process easier.
Download Pareto Chart Finance PPT
Template 12
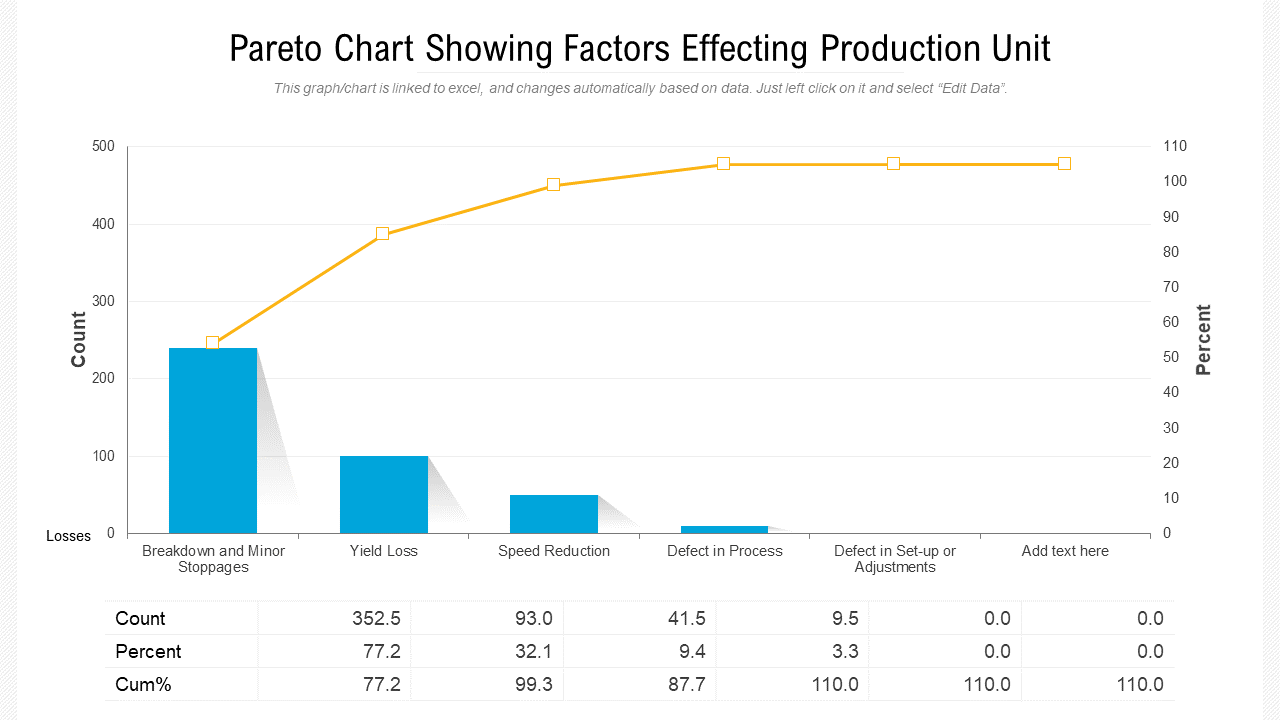
This is a great tool for business leaders to analyze different sets of data and their likelihood of causing certain problems. We have mentioned a few variables in this particular chart for your reference. However, the values and their afflictions can be adjusted as per your convenience. Also, this is a data-driven and Excel-linked chart, providing full control over its usage and interpretations. Therefore, grab it now!
Download Pareto Chart Showing Factors Affecting Production
Template 13
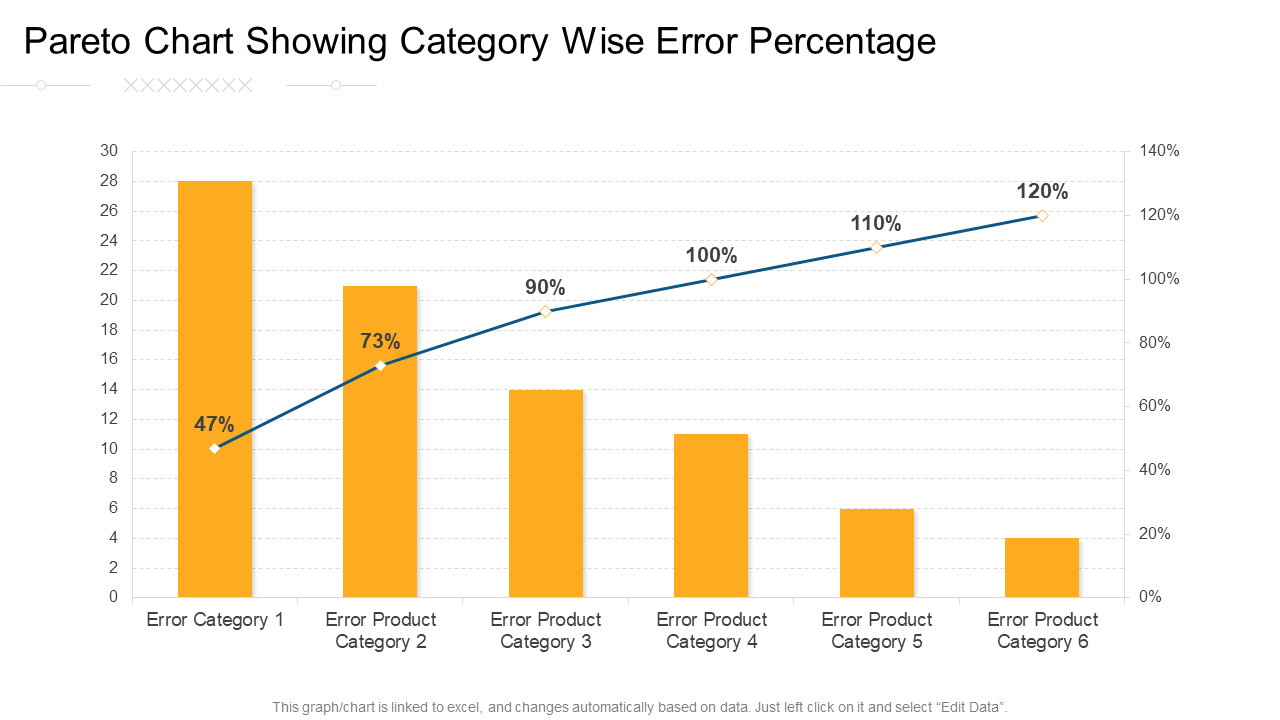
You can use this Pareto chart design to depict Issues that hinder your system and their implications. This is an amazing tool to use in your quality control presentations and other brainstorming activities as it helps analyze the cause-and-effect relationship between various variables. So, download it, edit its elements, and present it with confidence.
Download Pareto Chart Showing Category Wise Error Percentage
Template 14
This sample template contains a table that can be used to showcase various cause-and-effect factors. Use it to evaluate different sets of empirical data, their ranking, and frequencies. This is a single slide chart that can be added to any business presentation to amp up its structure and make it more comprehensive for the viewers.
Download Pareto Chart PPT Pictures
Template 15
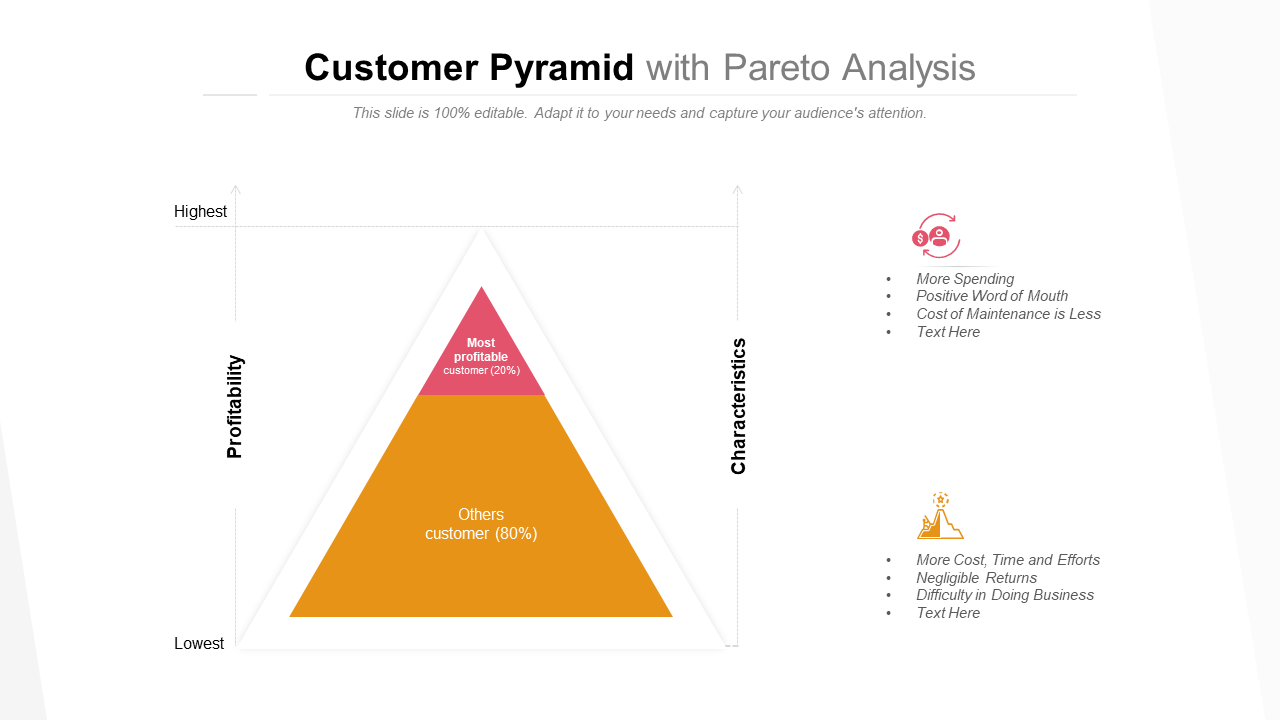
This is another template that can be used to conduct and reflect Pareto analysis results. It is a fully editable layout. Therefore, innumerable changes can be made to make it a better fit for your industry and information set.
Download Customer Pyramid With Pareto Analysis
Go beyond data visualization
Pareto charts have an edge over other forms of visualization because they are more informative and easy to create, especially when you have these 15 templates handy.
But there are other ways too that are equally beneficial in visualizing numerical data. You can get acquainted with them by checking out this blog.
In case you are looking for some more creative data visualization options to amp up your presentations, check out these resourceful links:


 Customer Reviews



![15 Interesting Ways to Use Graphs in a Presentation [Templates Included]](https://www.slideteam.net/wp/wp-content/uploads/2020/10/size1001-436-10-335x146.jpg)


