





 0 Comment
 Customer Reviews

The report's sitting in a shared folder. Has been since Tuesday.
Someone built it. Someone else approved it. And now the sales lead is opening three different spreadsheets trying to figure out why the numbers don't match the story. Leads are coming in. The pipeline looks full. But somewhere between the first touchpoint and the closed deal, things are falling apart—and nobody can point to exactly where.
That's the real problem with conversion tracking. Not the data. There's plenty of data. It's the gap between having numbers and knowing what they mean. Between "our lead volume is up 20%" and "our lead-to-close rate dropped in the same quarter." Both true. Completely opposite implications.
Sales teams don't struggle to collect conversion metrics. They struggle to see them in one place, in context, in a way that makes the next decision obvious. Funnel stages live in the CRM. Marketing numbers live in a separate tool. Finance has its own view of revenue conversion. Nobody's talking to each other, and the dashboard—if there is one—usually shows what happened last month, not what's happening right now.
What makes it worse: when the metrics finally do come together, they often land in a slide deck that wasn't built for this. Generic charts, no stage-level breakdown, no way to compare period over period. You can see the top and the bottom of the funnel. Everything in between is guesswork.
Conversion ratio dashboards exist because this problem is common enough that people started building purpose-built templates for it. Not general sales reports—specifically structured layouts for tracking where prospects drop, what channels convert, and which stages need attention. The structure does some of the thinking for you.
SlideTeam's conversion ratio dashboard templates tackle exactly this gap. These are pre-designed, content-ready frameworks built for sales teams, marketing analysts, and finance leads who need to present conversion performance without starting from scratch every time.
Here's what's in the collection.
Template 1: Lead Conversion and Opportunity Ratio Sales Dashboards
Structured around a four-stage sales process, this deck drives clarity across your entire lead conversion journey. It maps Sales KPIs and Sales Performance into one unified view. Every stage feeds the next, giving your team an immediate read on where deals stall. The intuitive layout transforms complex pipeline data into compelling visual narratives. You can anchor boardroom reviews or weekly team check-ins with confidence. Build a complete lead conversion and opportunity ratio story. Explore more conversion ratio dashboard templates to find the perfect fit for your sales workflow. Transform your sales reporting with this ready-made framework today. Download it now and elevate every pipeline conversation.

Download this PowerPoint Template
Template 2: Business Performance Dashboards with Revenue and Ratios
Combining revenue tracking with ratio analysis, this deck delivers a full business performance picture. High-impact comparison diagrams make trends unmistakable at a glance. Chart-driven layouts translate raw financial data into persuasive, decision-ready insights. The pre-designed structure saves hours of formatting work before every leadership review. Use it to anchor revenue conversion reporting across departments and stakeholders. Transform your business performance presentations with this powerful, professionally structured deck. Download now and make every revenue conversation count.

Download this PowerPoint Template
Template 3: Business Performance Dashboards with Lead Creation and Sales Ratios
Lead creation and sales ratio data rarely live in the same view—this deck changes that. Bright, informative layouts give your marketing and sales teams shared visibility. Every slide is built to eliminate confusion between marketing objectives and conversion outcomes. The structured framework acts as a planning model for future campaign performance. It captures cost efficiency metrics and lead conversion data in one clear presentation. Use this deck to align teams around shared conversion funnel analytics goals. Transform your lead-to-sales reporting today. Download now and present with complete clarity.

Download this PowerPoint Template
Template 4: Customizable Financial Ratio Visualization Dashboard PPT Demonstration
Financial ratio data becomes immediately persuasive when the visual design earns attention first. This deck blends creativity with structured data visualization for maximum audience engagement. Customizable color schemes let you align every slide with your brand identity effortlessly. Pre-built layouts give you a professional financial ratio dashboard in minutes, not hours. Use it for investor briefings, CFO reviews, or cross-functional performance presentations. Transform your financial ratio visualization with this dynamic, professionally crafted deck today. Download now and command every boardroom conversation with confidence.
[product_image id=1779322]
Template 5: Inventory Turnover Ratio Graph Conversion
Inventory efficiency is a core signal in any ecommerce conversion dashboard. This PPT preset helps operations and supply chain teams visualize inventory turnover ratios clearly. A practitioner reviewing stock velocity or dead inventory trends reaches for this slide first. It makes cycle comparisons across periods straightforward to present and act on. The template is 100% editable and customizable.

Download this PowerPoint Template
Template 6: Sales Dashboard for Monitoring Conversion Rates PPT Outline
Conversion rate monitoring needs a visual anchor, not just a spreadsheet export. This PPT template gives sales managers a structured view of where rates hold and where they slip. A team reviewing real-time conversion analytics across deal stages will find this layout immediately useful. It keeps the focus on trends that drive action, not decoration. The template is 100% editable and customizable.
[product_image id=1681368]
Template 7: Sales Conversion Rate Dashboards by Function PPT Outline
Breaking conversion rates down by business function reveals where performance actually lives. This PPT preset is built for analysts and sales leaders presenting conversion performance dashboards to mixed audiences. A VP reviewing marketing versus inside sales conversion side-by-side can use this slide to make the case clearly. It turns segmented data into a coherent, function-level story. The template is 100% editable and customizable.
[product_image id=1579972]
Template 8: Dashboard with Leads to Conversion Ratio for Sales Productivity
Leads-to-conversion ratio is the metric sales productivity conversations keep coming back to. This deck anchors that ratio across three critical pipeline stages: Opportunities, Negotiation, and Proposal. Each stage is structured to show exactly where deals progress—and where they don't. The clean layout makes weekly pipeline reviews faster and more focused. It delivers the visual clarity that transforms data into decisions. Build compelling sales productivity dashboards with this pre-designed, immediately downloadable framework. Download now and make your next sales review count.

Download this PowerPoint Template
Template 9: Sales Dashboard Showing Conversion Rates and Deal Sizes PPT Information
Deal size and conversion rate belong in the same view—this deck puts them there. The visually striking layout makes it easy to spot which deal sizes convert and which stall. Sales leaders can use this slide for client pitches, boardroom reviews, or territory planning. The pre-designed structure eliminates formatting work so you focus on the numbers. It captures the full sales conversion tracking story from first contact to closed revenue. Transform your sales dashboard presentations with this dynamic, results-focused deck today. Download now and walk into every review fully prepared.
[product_image id=1637164]
Template 10: Lead Performance Dashboard with Conversion Funnel
Customer acquisition cost and lifetime value rarely sit next to the conversion funnel—this slide fixes that. This PPT template is built for marketing and sales operations teams tracking lead quality end-to-end. It surfaces cost per lead, cost per customer, and return on marketing investment in one structured view. A demand generation lead reviewing lead conversion metrics across audience, prospect, and customer stages will find this immediately actionable. The template is 100% editable and customizable.

Download this PowerPoint Template
Template 11: Team Selling Dashboard with Lead Conversion Ratio PowerPoint Presentation
Team-level selling performance demands a conversion ratio view that's specific, not aggregated. This deck maps lead conversion ratios across Opportunities, Negotiation, and Proposal stages for the full team picture. Individual contributor performance and team trends become visible in the same layout. The structured design supports weekly standups, quarterly reviews, and coaching conversations equally well. It gives sales managers the visual foundation for clear, data-backed performance discussions. Transform your team selling presentations with this content-ready framework today. Download now and lead every performance review with confidence.

Download this PowerPoint Template
Template 12: Monthly Comparison Dashboard for Lead Conversion
Month-over-month lead conversion data is most useful when segmented correctly. This slide breaks down leads by country, industry type, and source—covering the dimensions that actually explain variance. A marketing analyst comparing campaign performance across periods reaches for this PPT to make the case. It separates leads received from leads converted so the gap is never hidden. The template is 100% editable and customizable.

Download this PowerPoint Template
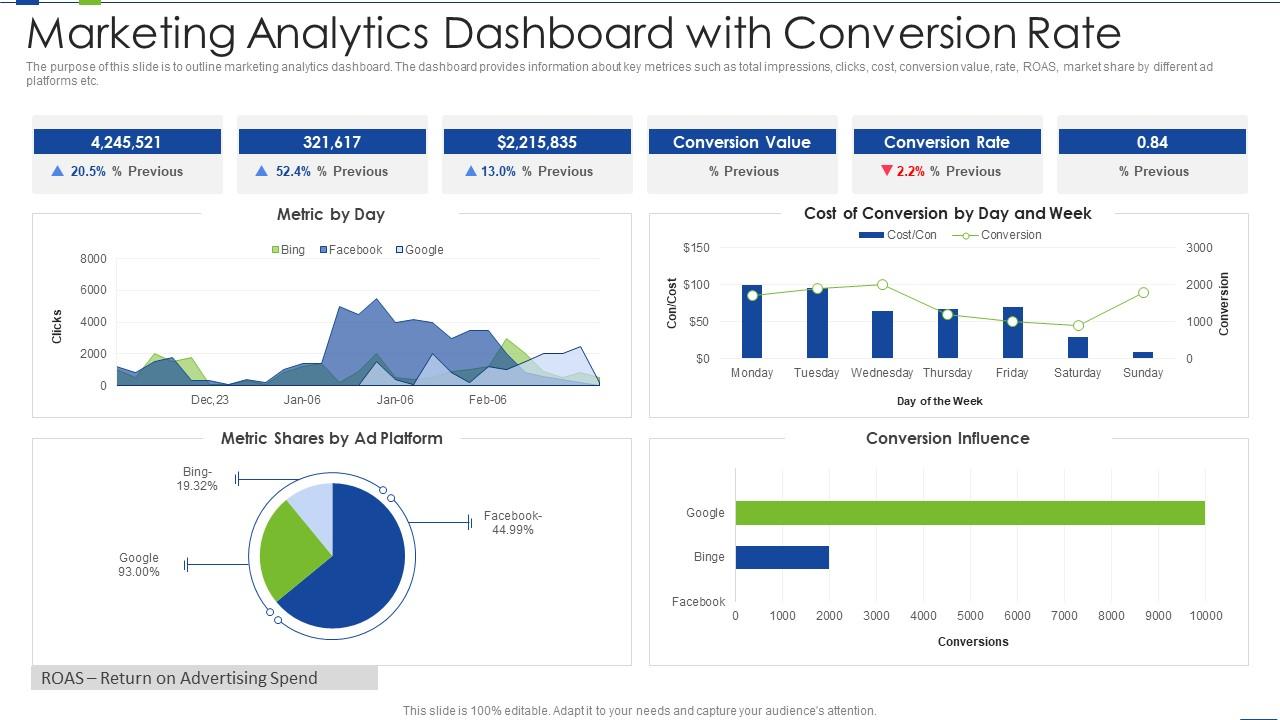
Template 13: Marketing Analytics Dashboard Snapshot with Conversion Rate
Marketing analytics dashboards work best when every key metric shares the same frame. This PPT preset covers total impressions, clicks, cost, conversion value, and ROAS across ad platforms in one snapshot. A digital marketing manager presenting marketing conversion KPIs to a leadership team will find this layout precise and presentation-ready. It makes multi-channel conversion data legible without oversimplifying. The template is 100% editable and customizable.
Download this PowerPoint Template
Template 14: Sales Growth Ratio and Booking This Month Business Dashboard
Sales growth ratio and monthly booking data tell a combined story that neither number tells alone. This PPT preset is structured for sales leaders who need to present both momentum and volume in one view. A revenue operations analyst tracking booking trends against growth targets will find this slide immediately useful. It keeps the sales KPI conversation grounded in current-period reality. The template is 100% editable and customizable.

Download this PowerPoint Template
Template 15: Financial Ratio Analysis Dashboard with Profit Margin
Profit margin sits at the intersection of every financial ratio conversation worth having. This PPT template gives finance teams and CFOs a structured dashboard for presenting ratio analysis with margin context. A financial controller walking leadership through liquidity, efficiency, and profitability ratios can use this slide to keep the narrative coherent. It makes complex financial data approachable without losing rigor. The template is 100% editable and customizable.

Download this PowerPoint Template
Template 16: HR Dashboard with Recruitment Conversion Rate KPI
Recruitment conversion rate is the HR metric that connects hiring activity to actual outcomes. This deck tracks the full funnel—Applications, Assessment, Interview, and Hires—in one structured dashboard. Every stage gives HR leaders clarity on where the pipeline tightens and where it holds. The pre-built layout makes it easy to present recruitment KPI performance in quarterly talent reviews. Use it to align HR and leadership teams around hiring conversion goals efficiently. Transform your HR dashboard presentations with this ready-made, professional framework today. Download now and make every hiring conversation data-driven.

Download this PowerPoint Template
Template 17: Sales and Marketing Dashboard with Conversion Rate
E-commerce conversion performance requires tracking behavior, not just transactions. This PPT slide covers product detail views, new and returning users, cart additions, and product checkouts in one dashboard. A digital commerce analyst presenting ecommerce sales conversion metrics to a growth team will find this layout immediately useful. It connects traffic behavior to conversion outcomes across channels by session. The template is 100% editable and customizable.

Download this PowerPoint Template
Template 18: Financial Quick Ratio Analysis Dashboard
Quick ratio analysis cuts through financial noise to reveal short-term liquidity in one clear view. This deck gives finance professionals a structured dashboard for presenting quick ratio data to leadership. The organized layout makes comparisons across periods straightforward and presentation-ready in minutes. It anchors ROI conversion dashboard conversations where liquidity and performance intersect. Use this pre-built framework for quarterly finance reviews and investor briefings alike. Transform your financial analysis presentations with this polished, instantly downloadable deck today. Download now and present liquidity insights with complete confidence.

Download this PowerPoint Template
Template 19: Website Analytics Report KPI Dashboard with Conversion Rate
Website performance reporting is only useful when conversion rate sits at the center. This PPT template gives digital analysts a structured view of traffic-to-conversion analysis alongside core web KPIs. A growth marketer presenting landing page conversion tracking data to stakeholders reaches for this slide first. It makes the relationship between site behavior and goal completion rate visible and clear. The template is 100% editable and customizable.

Download this PowerPoint Template
Template 20: Shopping Cart Conversion Rate Dashboard Reshaping Product Marketing Campaign
Shopping cart conversion rate is the metric that separates browsers from buyers. This PPT slide covers revenue per visitor, product views per session, and cart conversion rate in one structured layout. A product marketing manager reshaping campaign targeting based on cart behavior will find this slide precise and ready to present. It connects session-level data to revenue outcomes without burying the signal. The template is 100% editable and customizable.

Download this PowerPoint Template
Play in a Different League With Your Stellar Conversion Reporting with SlideTeam
SlideTeam's PowerPoint templates are the best in the industry for conversion ratio dashboards. These content-ready slides give sales, marketing, and finance teams a professional structure to present lead conversion metrics, funnel performance, and revenue outcomes with clarity. Use these ready-made PowerPoint slides to cut reporting time and make every stakeholder meeting count. Deploy these pre-designed frameworks to turn your conversion data into decisions that drive growth.
FAQs on Conversion Ratio Dashboard
What key metrics should be included in a conversion ratio dashboard to provide actionable insights for a sales team?
A useful conversion ratio dashboard tracks lead-to-opportunity rate, opportunity-to-close rate, cost per lead, cost per acquisition, and revenue per conversion. Add channel source and deal stage breakdowns so the team can act on specifics, not averages. Limit the view to metrics that directly inform a sales action. More than eight KPIs on one screen usually means fewer decisions get made.
How can a conversion ratio dashboard help identify bottlenecks in a multi-stage sales funnel?
A conversion ratio dashboard reveals bottlenecks by showing drop-off rates at each funnel stage—awareness, consideration, proposal, close. When one stage shows a sharp fall in conversion, it isolates the problem. Without stage-level data, teams chase symptoms instead of causes. Compare conversion rates across periods at each stage to confirm whether a bottleneck is new or chronic.
What is the difference between lead-to-opportunity conversion ratio and opportunity-to-close conversion ratio, and why should both be tracked separately?
Lead-to-opportunity ratio measures how well marketing qualifies leads before sales touches them. Opportunity-to-close ratio measures how well sales converts those qualified leads into revenue. Tracking both separately shows whether a revenue problem sits in lead quality or in closing execution. Fixing the wrong stage wastes budget and time.
How frequently should a conversion ratio dashboard be updated to ensure data-driven decision-making remains effective?
Sales-facing dashboards should refresh daily or in real time for high-volume pipelines. Marketing conversion dashboards work well on a weekly cadence. Monthly updates suit financial ratio and revenue conversion reporting. The right frequency matches the speed at which your team can actually act on a change—faster data with no response process is just noise.
Which visualization types—bar charts, funnel charts, or heat maps—best represent conversion ratio trends over time?
Funnel charts are the clearest choice for showing stage-by-stage drop-off in a conversion sequence. Bar charts work best for period-over-period comparisons of conversion rates by channel or segment. Heat maps add value when comparing conversion performance across many variables simultaneously, like day of week by traffic source. Use funnel charts first; add the others only when the question requires them.
How can segmenting conversion ratios by traffic source reveal which marketing channels deliver the highest-quality leads?
Segment conversion ratios by traffic source—organic search, paid, email, direct, referral—and compare both volume and rate. A source with high lead volume but low conversion signals poor targeting or a mismatched landing page. A source with low volume but high conversion is worth scaling. This analysis directly informs budget reallocation decisions.
What role does cohort analysis play in making a conversion ratio dashboard more predictive rather than just descriptive?
Cohort analysis groups users by the period they first converted and tracks their behavior over time. This shifts the dashboard from reporting what happened to predicting what a new cohort will likely do. It reveals whether conversion rates are improving across acquisition batches or just fluctuating with volume. Sales and marketing leaders use it to validate whether process changes are actually working.
How should a conversion ratio dashboard handle seasonality to avoid misinterpreting temporary dips as performance failures?
Build a year-over-year comparison line directly into the dashboard so current-period dips show against the same period last year. Flag known seasonal windows—holiday, fiscal year-end, school cycles—as reference markers. Compare against a rolling 12-month average, not just the prior month. This context stops teams from over-correcting on temporary drops that repeat every year.