




 0 Comment
 Customer Reviews

The deck's been sent. Three slides cover the next five years of revenue, expenses, and cash flow. Nobody's read them yet.
Not because the numbers are bad. They're probably reasonable—maybe even optimistic in the right places. But somewhere between the spreadsheet and the boardroom, someone has to stand up and make those numbers feel believable. Not just accurate. Believable.
That's where it gets uncomfortable. Financial projections aren't hard to build. What's hard is presenting them in a way that doesn't invite every skeptic in the room to poke holes before you've finished talking. One bad chart layout, one unlabeled axis, one slide that looks like it was assembled at midnight—and the credibility gap opens up fast.
And the stakes aren't abstract. Investors decide on funding. Leadership decides on headcount. Partners decide on commitments. All of it riding on how well you can show—not just tell—that your numbers make sense and your KPIs hold up under scrutiny.
Most people building these decks aren't starting from nothing, either. They know their business. They know what the revenue growth metrics show. They know where the break-even point falls. But translating that into a presentation that holds together visually, logically, and narratively? That's a different skill set entirely.
So the templates exist. Not because financial modeling is mysterious—it isn't. They exist because the structure matters as much as the substance. Because a well-organized financial projection slide communicates confidence before anyone reads a single number.
SlideTeam's pre-designed financial projections and key metrics templates handle exactly this gap—the space between knowing your numbers and making your audience trust them. Content-ready frameworks built for the scenarios that actually come up: investor pitches, budget reviews, five-year forecasts, KPI dashboards.
Here's what's available.
Template 1: Steps in Formulating Financial Projections Financial Projections and Valuation
A structured ten-stage framework drives clarity through every financial projection workflow. This deck maps the complete process—from industry benchmarks to regression analysis and appropriate forecasting methods. Each stage builds on the last, giving your audience a logical path through complex financial data. The visual flow transforms abstract planning steps into a compelling, decision-ready narrative. Use it to present business financial planning roadmaps, resource allocation rationale, and goal-setting frameworks with authority. Transform your financial projection presentations today. Download this dynamic template now and unlock confident, structured forecasting communication.
[product_image id=931316]
Template 2: Financial Projections and Key Metrics PowerPoint PPT Bundles
Solid financial projection work often sits across scattered slides with no common thread. This PPT preset brings twelve thematically consistent slides together in one complete deck. It suits expert discussion meetings where practitioners need to walk stakeholders through revenue projections, KPIs, and cash flow analysis without losing visual cohesion. Reach for this when a single slide won't carry the full picture. The template is 100% editable and customizable.
[product_image id=576863]
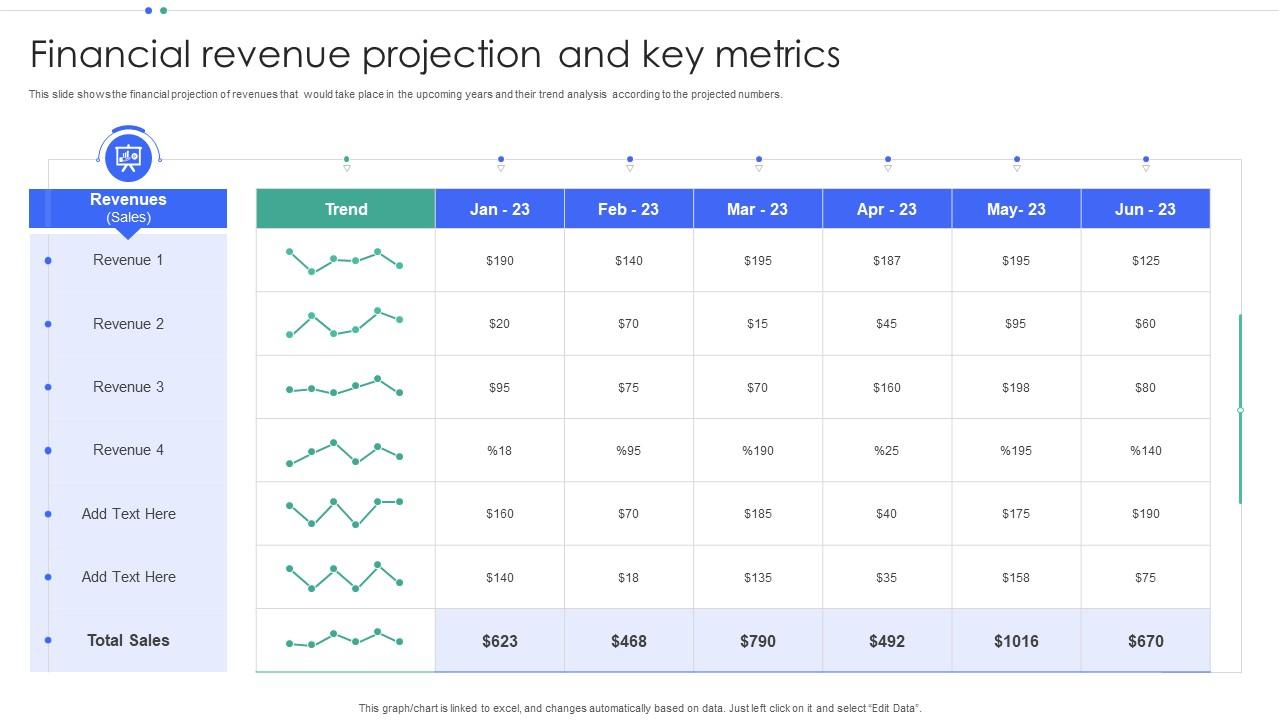
Template 3: Financial Revenue Projection and Key Metrics
Revenue trend analysis over multiple years needs more than a table — it needs a clear visual arc. This PowerPoint slide is built for finance leads and analysts who present annual revenue forecasts and track projection accuracy over time. Use it when walking a leadership team or investor group through projected revenue numbers and the trend lines behind them. It keeps multi-year data readable without losing detail. The template is 100% editable and customizable.
Download this PowerPoint Template
Template 4: Financial Projections and Key Metrics PPT Summary
Structured financial storytelling starts with a deck that doesn't fight your content. This template delivers a clean, innovation-balanced design for financial projections and key metrics presentations. It empowers you to align every slide to your brand's visual identity effortlessly. Deploy it for investor-facing decks, internal planning reviews, or board-level financial performance metric summaries. Transform your financial projection presentations today. Download this content-ready template now and make every number count.
[product_image id=1494986]
Template 5: Key Financial Metrics and Projections Dashboard PPT Mockup
A KPI dashboard slide needs to communicate performance at a glance—without clutter. This deck delivers a polished mockup that surfaces key financial metrics and projection data in one focused view. The design balances simplicity with visual impact, making complex figures immediately accessible to any audience. Use it for executive reviews, investor briefings, or real-time financial performance metric reporting. Transform your dashboard presentations today. Download this dynamic template now and elevate your financial reporting clarity.
[product_image id=1550145]
Template 6: Five Year Financial Projections and Key Metrics
Five-year financial modeling requires a slide that can hold multiple data layers without becoming unreadable. This deck showcases customer counts, revenue trajectories, expense trends, and cash flow across a full five-year horizon. Each KPI gets its own visual space, so growth patterns and capital expenditure needs read clearly. Use it to present long-term startup financial projections or capital planning narratives to investors and leadership. Transform your multi-year financial presentations today. Download this template now and make your five-year story credible.

Download this PowerPoint Template
Template 7: Financial Projection Coca Cola Business PPT Example
Real-world business financial planning benefits from seeing how established companies structure their projections. This PPT template uses a Coca-Cola business context to ground financial projection concepts in a recognizable corporate framework. For context, it works well when practitioners need to illustrate projection methodology alongside a credible brand reference. Use this deck in training sessions, client pitches, or business valuation metric presentations. The template is 100% editable and customizable.
[product_image id=1597333]
Template 8: Financial Projections and Key Metrics PPT Demonstration
Visual design carries weight when numbers alone won't hold a room's attention. This deck merges creative layout flexibility with structured financial projections and key metrics content. Brand-aligned color schemes and adaptable elements let you tailor every slide to your specific audience. It suits pitch decks, budget forecasting reviews, and revenue growth metrics presentations equally well. Transform your financial presentations today. Download this dynamic template now and engage every stakeholder in the room.
[product_image id=1597334]
Template 9: Financial Projections and Metrics for Investors
Investor audiences need financial projections that are both credible and visually sharp. This deck combines design versatility with a framework built specifically for investor-facing financial metrics and projection data. Adaptive color schemes and flexible elements help you align every slide to your brand identity. Use it for funding rounds, ROI projections presentations, or financial performance reviews with institutional stakeholders. Transform your investor presentations today. Download this template now and unlock funding-ready financial clarity.
[product_image id=1490637]
Template 10: Financial Projections and Metrics for Investors PPT Guidelines
Guidelines for investor-facing financial presentations need to be as clear as the projections themselves. This deck provides a structured, fully adaptable framework for communicating financial projections and metrics to investor audiences. Every element adjusts quickly, keeping your workflow tight even under deadline pressure. Use it to guide teams on building investor-ready financial projections and key metrics presentations that hold up in due diligence conversations. Transform your investor guidelines presentations today. Download this template now and set your team up for confident delivery.
[product_image id=1498887]
Template 11: Financial Projections and Key Metrics Dashboard PPT Guidelines
A well-built dashboard slide answers the CFO's questions before they're asked. This PPT preset is designed for finance teams who need to present financial projections and key metrics in a boardroom-ready format. It works equally well for client pitches and internal quarterly reviews where clarity on KPIs and budget forecasting matters. So yeah, reach for this when the data volume is high and the audience patience is not. The template is 100% editable and customizable.
[product_image id=1750458]
Template 12: Financial Planning and Analysis with Budgeting Table PPT Demonstration
Business financial planning without a structured budgeting table often leaves stakeholders guessing. This PowerPoint slide is built for finance analysts and planning leads who need to present detailed budget forecasting data alongside analytical commentary. It fits annual planning cycles, mid-year reviews, and cost projection analysis conversations with leadership. The layout keeps numbers and narrative in balance, so nothing gets buried. The template is 100% editable and customizable.
[product_image id=1750457]
Template 13: Income Forecast Analysis Revenue and Expense Projections PPT Sample
Income forecasting gets complicated when revenue and expense projections run on separate slides. This PPT template brings both into one cohesive view, letting analysts walk stakeholders through profit and loss projections without switching decks. It suits quarterly business reviews, investor updates, and internal financial performance metric presentations where side-by-side income analysis is needed. The template is 100% editable and customizable.
[product_image id=1631948]
Template 14: Financial Performance and Key Metrics PPT Information
Financial performance reporting works best when the design stays out of the way of the data. This deck is built for practitioners who present key financial metrics—gross profit margin, operating cash flow, net profit projections—to leadership or external stakeholders. It pairs a clean visual structure with flexibility for any business context. Use it in boardroom meetings or client-facing financial performance reviews. The template is 100% editable and customizable.
[product_image id=1551965]
Template 15: Financial Projections and Go to Market Milestones PPT Information
Aligning financial projections with Go-to-Market milestones is a presentation challenge most decks don't solve well. This template bridges both—pairing revenue and growth forecasts with a clear milestone timeline in a single, cohesive deck. The innovation-balanced design lets you customize for any industry or audience without starting from scratch. Use it for startup pitch decks, market entry planning, or sales forecasting reviews tied to product launches. Transform your Go-to-Market financial presentations today. Download this ready-made template now and align your numbers with your strategy.
[product_image id=1551986]
Template 16: Financial Projections and Metrics for Investors PPT Mockup
Investor pitch preparation often stalls at the metrics slide — too much data, too little structure. This PPT mockup is built for founders and finance leads who need to present financial projections and key metrics to investors in a format that reads quickly and clearly. It works well for seed rounds, Series A decks, and due diligence prep where first impressions carry significant weight. The template is 100% editable and customizable.
[product_image id=1531164]
Template 17: Financial Projections and Metrics for Your Pitch PPT Slides
Pitch decks live or die on how well financial data lands with a non-technical audience. This deck delivers a creative, versatile framework for presenting financial projections and key metrics to potential investors and partners. Brand-aligned color schemes and adaptable layouts let you tailor every slide without sacrificing visual consistency. Deploy it for startup financial projections, EBITDA projections, or revenue growth metrics in high-stakes pitch environments. Transform your pitch presentations today. Download this dynamic template now and make your financial story impossible to ignore.
[product_image id=1506809]
Template 18: Tools and Software for Effective Financial Projections PPT Presentation
Selecting the right tools for financial projection work is a decision that shapes accuracy and speed. This deck maps out software and tooling options in a clean, structured presentation format. It suits finance operations leads, CFOs, and analysts who need to present or justify their financial modeling stack to stakeholders. Use it for internal capability reviews or team onboarding sessions focused on financial planning tools. Transform your financial tools presentations today. Download this ready-made template now and make the case for smarter forecasting infrastructure.
[product_image id=1512221]
Template 19: Financial Projections and Metrics Pitch Decks PPT
Pitch deck financial slides need to do two things at once: show rigor and keep attention. This deck merges structured financial projections and metrics content with a visually compelling layout built for high-stakes presentations. Every element adapts to your brand, and the design holds up across boardroom screens and shared decks alike. Use it for investor pitches, funding rounds, and ROI projections presentations where credibility is non-negotiable. Transform your pitch deck today. Download this template now and present your financial metrics with confidence.
[product_image id=1515069]
Template 20: Financial Projections and Metrics for Investor Pitches PPT Mockup
Investor pitch preparation demands financial slides that project confidence before anyone reads the numbers. This mockup deck provides a polished, adaptable framework for presenting financial projections and key metrics in investor pitch contexts. The innovation-balanced design scales across funding stages—from early-stage startup financial projections to later-round capital raise decks. Use it when the room is full of people who will test every assumption. Transform your investor pitch today. Download this dynamic template now and walk into funding conversations fully prepared.
[product_image id=1507058]
Elevate Your Financial Projections and Key Metrics with SlideTeam
SlideTeam's PowerPoint templates are the best in the industry for financial projections and key metrics presentations. These content-ready slides save hours of formatting work while delivering the professional structure investors and leadership teams expect. From KPI dashboards to five-year revenue forecasts, these ready-made frameworks handle every financial storytelling scenario. Grab these templates to present your numbers with clarity, credibility, and confidence.
FAQs on Financial Projections and Key Metrics
What are the most critical financial metrics that early-stage startups should prioritize when building their first financial projection model?
Early-stage startups should focus on monthly recurring revenue, burn rate, gross margin, and customer acquisition cost. These four tell investors how fast money is leaving, how much revenue is repeating, and what it costs to grow. Add runway and net revenue retention if the model is subscription-based. Keep the projection model simple — three scenarios (base, bear, bull) across 24 months is enough to start.
How do you differentiate between vanity metrics and actionable metrics when presenting financial data to potential investors?
Vanity metrics look good but don't connect to revenue or decisions — page views and total sign-ups are common examples. Actionable metrics tie directly to business outcomes: conversion rate, churn, and average contract value all drive decisions. When presenting to investors, show only metrics that change how you operate or allocate capital. If a number doesn't answer 'so what?' — cut it from the deck.
What role does burn rate play in determining a startup's runway, and how should it be visually communicated in pitch decks?
Burn rate is the monthly cash spend net of revenue. Divide current cash reserves by burn rate to get runway in months. In pitch decks, show burn rate and runway on the same slide — a simple bar or waterfall chart works best. Investors want to see you know exactly when the money runs out and what milestone you'll hit before it does.
How can scenario-based financial modeling help businesses prepare for market volatility and economic downturns?
Scenario-based financial modeling builds three versions of the plan: base case, upside, and downside. Each scenario changes key assumptions — revenue growth rate, customer churn, and fixed cost coverage. This lets leadership make real decisions before a downturn hits, not during it. Run scenarios quarterly and update assumptions when market data shifts. Two or three variables per scenario is enough — don't overcomplicate it.
What are the key differences between top-down and bottom-up revenue forecasting approaches, and when should each be used?
Top-down starts with total market size and works down to your projected share — useful for early-stage businesses with limited sales history. Bottom-up builds from unit-level data: price per unit, sales capacity, and close rates — more credible for investor conversations. Use top-down to frame the opportunity and bottom-up to defend the number. Most strong forecasts use both together.
How do you calculate and interpret Customer Lifetime Value in the context of long-term financial projections?
Customer Lifetime Value (LTV) equals average revenue per customer divided by churn rate. In long-term financial projections, LTV justifies acquisition spend — if LTV is three times customer acquisition cost, the unit economics hold. Track LTV by customer cohort, not just as a company-wide average. Cohort-level LTV tells you which segments are actually worth acquiring and which are eroding your margins.
What common mistakes do founders make when projecting revenue growth rates, and how can they be avoided?
The most common mistake is projecting hockey-stick growth without showing what operationally drives it — more salespeople, new channels, or product expansion. A second mistake is using industry-average growth rates without adjusting for your company's stage and market position. Fix both by anchoring every growth assumption to a specific operational input. If you can't name what drives the number, the number isn't credible.
How should gross margin trends be analyzed to assess the scalability potential of a SaaS business model?
For a SaaS business, gross margin should improve as revenue scales — because infrastructure costs grow slower than revenue. If gross margin stays flat or falls as the business grows, it signals the cost of delivery is scaling with revenue, not below it. Track gross margin by cohort and by product tier. A SaaS business targeting scalability should show gross margins trending above 70% over a three-to-five year horizon.