





 0 Comment
 Customer Reviews

The review's scheduled. Someone's already asked for the slides.
Not because there's a clear picture of what's working—there rarely is at this stage. But the meeting's on the calendar, the stakeholders are expecting numbers, and somebody has to stand up and explain why the quarter looked the way it did.
Performance evaluation metrics exist in a strange space. Everyone agrees they matter. Fewer people agree on which ones. And almost nobody agrees on what a good presentation of them looks like. So the prep becomes the problem. Not the data—the data's usually there, sitting in a dashboard somewhere. The problem is turning it into something that doesn't make the room glaze over by slide three.
There's also this: metrics without structure feel like accusations. A dropped KPI with no context reads as blame. A workforce productivity chart with no benchmarks reads as noise. The person presenting has to do a lot of work to make numbers feel like insight instead of just numbers.
And it compounds. You're not just presenting to one audience. Finance wants ROI performance metrics. HR wants employee performance review data. Leadership wants something that fits in ten minutes. The same underlying data has to speak four different languages, and the deck has to hold together across all of them.
That's partly why performance evaluation templates exist—not because the subject is impossible, but because structuring it from scratch every time is its own kind of tax on your time and focus. The framework's the hard part. Once it exists, the thinking can happen.
SlideTeam's pre-designed performance evaluation metrics templates handle that structural layer. Content-ready slides that cover everything from operational dashboards to HR analytics to KPI tracking—already laid out, already organized. You bring the numbers; the template brings the logic.
Here's what's in the collection.
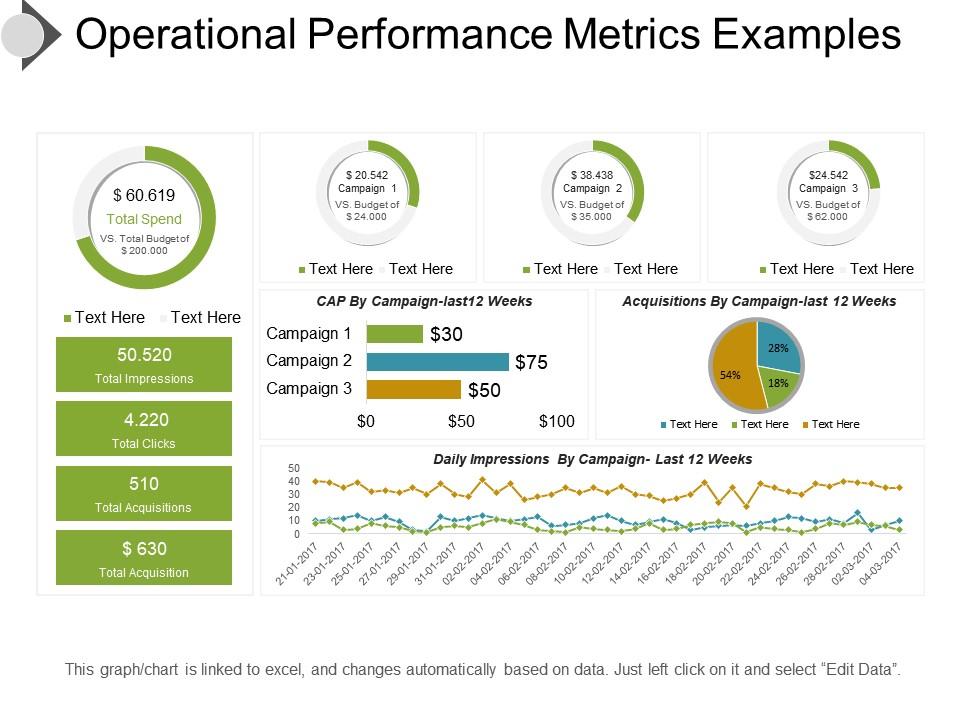
Template 1: Operational Performance Metrics Examples Presentation Ideas
Operational performance data rarely tells a clear story on its own. This PowerPoint slide is built for business managers who need to present operational metrics credibly to mixed audiences. It gives practitioners a ready structure for tracking business performance metrics across departments. Explore more performance metrics samples to pair with this layout for a complete reporting suite. The template is 100% editable and customizable.
Download this PowerPoint Template
Template 2: Team Performance Evaluation Planning Metrics
Team performance reviews work best when the conversation has a clear structure before it starts. This PPT template covers three core evaluation stages: reviewing goals, providing feedback, and discussing strengths. HR leads and team managers use this slide to run employee performance review sessions that stay on track. It fits continuous performance management cycles where regular check-ins replace annual reviews. The template is 100% editable and customizable.

Download this PowerPoint Template
Template 3: Java Performance Metrics in Enterprise Application
Enterprise Java applications generate a lot of operational noise — separating signal from failure mode is the real task. This PPT preset is built for IT architects and application managers evaluating Java performance within an APM strategy. It covers four indicators: application topology, garbage collection, external dependencies, and business transaction health. Use it to present data-driven performance metrics to engineering leads or operations teams. The template is 100% editable and customizable.

Download this PowerPoint Template
Template 4: Performance Metrics and Evaluation Techniques PPT Sample
Structured thinking about performance evaluation becomes persuasive when the visuals match the message. This deck merges analytical clarity with presentation-ready design for precise, audience-focused delivery. Intuitive slide architecture drives faster comprehension of complex performance appraisal methods. A balanced blend of simplicity and innovation gives every metric its rightful stage. You can build compelling performance benchmarking presentations with clear visual hierarchy and professional polish. Transform your evaluation presentations today. Download this dynamic template now and unlock sharper performance storytelling.
[product_image id=1483881]
Template 5: Performance Evaluation Metrics and Best Practices PPT Slides
Best practices in performance measurement deserve a presentation framework that matches their rigor. This slide is built for practitioners presenting performance evaluation metrics alongside actionable guidance. Whether walking a leadership team through balanced scorecard metrics or outlining improvement benchmarks, this PPT delivers structure. Browse related performance evaluation metrics templates for additional slide options that complement this deck. The template is 100% editable and customizable.
[product_image id=1484100]
Template 6: Measuring and Analyzing Performance Metrics PPT Outline
Measuring and analyzing performance data is only half the work — presenting it clearly is the other half. This PPT template is built for analysts and operations leads who need to communicate quantitative performance measures to decision-makers. It works well for organizational performance measurement reviews where the audience ranges from finance to HR. So yeah, this deck handles the structural layer so your analysis can do the talking. The template is 100% editable and customizable.
[product_image id=1493787]
Template 7: Quality Process Metrics for Performance Evaluation PPT Example
Quality metrics lose impact when the slide design fights the message instead of supporting it. This deck captures the full visual and analytical weight of quality process benchmarking in one cohesive framework. Creative layouts translate complex QA performance data into instant audience clarity. Flexible color schemes align every slide to your brand without sacrificing professional credibility. You can build authoritative quality evaluation presentations that hold up in boardroom and client settings alike. Transform your quality performance presentations today. Download this dynamic template now and unlock evaluation-ready visual impact.
[product_image id=1489787]
Template 8: Operational Performance Metrics Complete Deck PowerPoint Presentation Slides
Operational dashboards rarely communicate themselves—they need structure, flow, and deliberate visual hierarchy. This deck delivers all three across 15 professionally crafted slides covering operational KPI tracking essentials. Compelling visuals, icons, and graphs work together to make complex operations data immediately readable. Pre-built layouts save hours of formatting work for performance managers and operations leads. You can present end-to-end operational performance measurement narratives with consistent, polished design throughout. Transform your operations presentations today. Download this dynamic template now and unlock presentation-ready performance clarity.
[product_image id=134602]
Template 9: Financial Metrics for Product Performance Evaluation PPT Outline
Financial performance metrics for product evaluation require a presentation that keeps numbers in context. This PPT outline is designed for finance leads and product managers who present ROI performance metrics to stakeholders. It structures product-level financial data into a clear, audience-friendly narrative. See top performance review templates that pair well with this financial metrics deck for full-cycle evaluation reporting. The template is 100% editable and customizable.
[product_image id=1487074]
Template 10: Key Metrics to Measure Performance Evaluation Success PPT Complete Deck
Measuring what actually drives performance evaluation success requires slides that match the analytical weight of the content. This deck combines visual creativity with functional KPI tracking architecture to deliver real clarity. Pre-designed layouts let you anchor key metrics immediately without starting from a blank canvas. A clean, professional design ensures your performance benchmarking data commands attention in any setting. You can present goal-setting and performance tracking frameworks that resonate from boardroom meetings to client pitches. Transform your performance success presentations today. Download this dynamic template now and unlock metrics-driven audience impact.
[product_image id=1665565]
Template 11: Key Metrics for Project Performance Evaluation PPT Example
Project performance reviews are easier to run when the metrics have a home before the meeting starts. This deck is built for project managers and PMO leads who need to present KPIs against project milestones clearly. It handles the structural work of organizing project-level performance data into a coherent story. For context, this PPT works especially well for OKR framework reviews where goal progress needs visual anchoring. The template is 100% editable and customizable.
[product_image id=1514967]
Template 12: Performance Evaluation Metrics and KPIs Explained PPT Example
Explaining KPIs to a mixed audience is always harder than it looks on paper. This deck merges performance evaluation metrics with KPI explanation frameworks for audiences who need both the numbers and the context. Clear slide architecture turns abstract indicators into accessible, decision-ready information. Polished design builds instant credibility with stakeholders who expect professional-grade presentations. You can build comprehensive KPI tracking and evaluation presentations that work equally well for HR and executive audiences. Transform your KPI explanation presentations today. Download this dynamic template now and unlock structured performance clarity.
[product_image id=1485498]
Template 13: Marketing Metrics for Performance Evaluation PPT Guidelines
Marketing performance is one of those areas where everyone has opinions and few have clear frameworks. This deck gives marketing leads and analytics teams a structured presentation foundation for sales and marketing performance metrics reviews. It merges visual appeal with functional reporting architecture so campaign data lands with precision. Flexible design means every slide adapts to your brand without losing professional consistency. You can build compelling marketing evaluation presentations that make data-driven performance metrics impossible to ignore. Transform your marketing measurement presentations today. Download this dynamic template now and unlock sharper campaign performance storytelling.
[product_image id=1479177]
Template 14: Evaluating Performance Bayesian Metrics for Better Outcomes PPT Outline
Bayesian approaches to performance evaluation are useful — but they're hard to present to a non-technical room. This PPT outline is built for data scientists and analysts who need to make probabilistic performance outcomes legible to business audiences. It handles the translation layer between statistical rigor and boardroom communication. Check out objective performance evaluation templates that complement this deck for a more complete analytical presentation suite. The template is 100% editable and customizable.
[product_image id=1501906]
Template 15: Measuring Performance and Metrics PPT Sample
Measuring performance is a discipline; presenting it well is a different skill entirely. This deck bridges both — designed for practitioners who need visual clarity as much as analytical depth. Creative, versatile layouts give every performance metric its proper visual weight without overwhelming the audience. Pre-designed slides save significant prep time while preserving the freedom to adapt content to any reporting context. You can build polished performance measurement presentations that turn raw data into actionable executive insight. Transform your performance reporting presentations today. Download this dynamic template now and unlock visually driven measurement clarity.
[product_image id=1496813]
Template 16: Human Resource Metrics for Performance Evaluation PPT Information
HR performance analytics work best when the presentation matches the depth of the data behind it. This PPT deck is built for HR leads and people operations managers presenting workforce productivity metrics to leadership. It gives structured form to HR data — from headcount analysis to employee efficiency metrics — in one coherent layout. Find additional performance evaluation templates that extend this HR metrics deck into a full people analytics report. The template is 100% editable and customizable.
[product_image id=1488953]
Template 17: Support Team Performance Metrics for Evaluation PPT
Support team performance is one of the clearest windows into customer experience health. This deck captures the full scope of support-side evaluation—response times, resolution rates, and team efficiency—in a structured, visual framework. Audience-ready design ensures that customer support KPI data lands with impact for both operations and executive audiences. Pre-built layouts simplify the formatting work so team leads can focus on the conversation, not the slide. You can build comprehensive support team performance assessment presentations that drive accountability and clarity. Transform your support metrics presentations today.
[product_image id=1489940]
Template 18: Top Assessment Tools for Effective Performance Evaluation PPT Structure
Assessment tools matter most when they're presented in a way that makes their output actionable. This deck gives HR professionals and performance managers a structured framework for presenting evaluation tools and their results. Compelling slide architecture turns assessment findings into clear, decision-ready narratives for leadership teams. Pre-designed layouts reduce preparation time significantly for performance appraisal methods reviews and 360-degree feedback presentations. You can build authoritative assessment tool presentations that move from findings to next steps without losing the room. Transform your evaluation tool presentations today. Download this dynamic template now and unlock structured assessment clarity.
[product_image id=1684620]
Template 19: Measuring Success Key Metrics for Vendor Performance Evaluation PPT Slides
Vendor performance reviews are one of those conversations where unclear metrics create real downstream risk. This PPT deck is designed for procurement leads and vendor managers who need to present supplier KPIs with precision and authority. It handles the full arc of vendor evaluation — from baseline benchmarking to success measurement — in a single structured layout. This slide also works well for quarterly business reviews where vendor scorecards need to be both credible and visual. The template is 100% editable and customizable.
[product_image id=1433326]
Template 20: Performance Appraisal Metrics and KPIs PPT Outline
Performance appraisal conversations land better when the KPI framework is visible before the discussion begins. This PPT outline is built for HR managers and team leaders presenting performance appraisal metrics and KPIs in formal review cycles. It gives structure to both quantitative measures and qualitative indicators in a single, coherent deck. For context, it pairs naturally with continuous performance management programs where regular data visibility matters. The template is 100% editable and customizable.
[product_image id=1499878]
Turn Performance Reviews into a Great Show with SlideTeam
SlideTeam's PowerPoint templates are the best in the industry for performance evaluation metrics. These content-ready slides save you hours of formatting work while delivering professional-grade KPI tracking, balanced scorecard layouts, and HR performance analytics frameworks. Use these pre-designed PowerPoint slides to turn raw data into clear, decision-ready presentations your stakeholders will actually act on. Deploy these ready-made templates today and drive stronger performance outcomes across every review cycle.
FAQs on Performance Evaluation Metrics
How do you choose between precision and recall when evaluating a classification model for imbalanced datasets?
Choose precision when false positives are costly — think spam filters or fraud alerts where bad calls have real consequences. Choose recall when missing a positive case is worse — cancer screening is the classic example. In imbalanced datasets, recall often matters more because the minority class is usually the one you can't afford to miss. Check both, then decide based on your specific cost of error.
What distinguishes the F1 score from the F-beta score, and when should each be prioritized?
The F1 score weights precision and recall equally. The F-beta score lets you shift that balance — a beta above 1 favors recall, below 1 favors precision. Use F1 when both errors cost roughly the same. Use F-beta when one type of error is clearly more damaging. Medical diagnosis typically calls for high beta; email filtering often calls for low beta.
How does the ROC-AUC metric behave differently from the precision-recall AUC in skewed class distributions?
ROC-AUC measures a model's ability to rank positives above negatives across all thresholds. In skewed distributions, it can look optimistic because the large negative class inflates true negative rates. Precision-recall AUC focuses only on the positive class, making it more honest about how well your model finds rare events. When your positive class is small, precision-recall AUC gives you the truer picture.
What are the limitations of using accuracy as a primary performance metric in machine learning models?
Accuracy treats all classes equally, so a model predicting the majority class every time can score 95% on a 95/5 split — while being completely useless. It hides class imbalance problems. It also gives no information about where the model fails. For any real-world classification task with unequal class sizes, accuracy alone will mislead you. Always pair it with precision, recall, or a confusion matrix.
How can Mean Absolute Error and Root Mean Squared Error lead to model selection decisions?
Mean Absolute Error treats all errors the same size equally. Root Mean Squared Error penalizes large errors more heavily. If your dataset has a few big outliers, RMSE will flag a model as worse even if it performs well on most cases. MAE gives a cleaner average-case picture. When large errors are operationally costly — say, demand forecasting — prefer RMSE. For robust general performance, MAE is more informative.
What role does the confusion matrix play in diagnosing specific failure modes of a classification model?
A confusion matrix breaks predictions into four buckets: true positives, true negatives, false positives, and false negatives. Each bucket points to a specific failure. High false negatives mean the model misses too many real cases. High false positives mean it over-triggers. You can't get this detail from a single accuracy or F1 number. Use the matrix first — it tells you which failure mode to fix.
How do you evaluate model performance when ground truth labels are noisy or unreliable?
Start by estimating the noise level — how often are labels wrong, and is the noise random or systematic? Random label noise usually degrades all models equally, so relative rankings still hold. Systematic noise is more dangerous and needs annotation audits or multiple labeler agreement checks. Cross-validation on cleaner subsets helps. When ground truth is genuinely unreliable, treat model comparisons as directional, not definitive.
What is the difference between macro, micro, and weighted averaging in multi-class classification metrics?
Macro averaging computes the metric per class, then takes an unweighted mean — every class counts equally regardless of size. Micro averaging aggregates all true positives and false positives before computing, so large classes dominate. Weighted averaging scales each class by its frequency in the data. Use macro when small classes matter equally. Use micro or weighted when class size reflects real-world importance.


