




 0 Comment
 Customer Reviews

The report's sitting in the shared drive. Has been for a week.
Everyone's seen it. Nobody's quite sure what to do with it. The numbers are there—response times, feature sets, pricing tiers, customer ratings—but somewhere between the raw data and the meeting room, the story gets lost. Somebody asks, "So where do we actually stand?" and the silence that follows is longer than it should be.
That's the benchmarking problem. Not the analysis itself—most product teams can pull competitor data. The hard part is what comes after. How do you present a performance gap without making it sound like a disaster? How do you show market positioning clearly enough that a VP can make a call in fifteen minutes? How do you take a matrix of feature comparisons and turn it into something that actually moves people?
Product benchmarking decks tend to go one of two ways. Either they're too dense—tables inside tables, footnotes nobody reads—or too thin, just a handful of slides that leave the room with more questions than it started with. Neither works. The wrong structure makes the analysis look shaky, even when the underlying research is solid.
This is exactly why these templates get built. Because every product manager, market analyst, and strategy lead eventually hits the same wall: the data's ready, but the presentation isn't. And starting from a blank slide when you've already spent three weeks gathering competitive intelligence is a genuinely bad use of time.
SlideTeam's product benchmarking templates exist for this gap—pre-designed frameworks built around how these presentations actually need to work. Whether you're comparing SaaS pricing tiers, mapping feature differentiation against three competitors, or presenting KPI tracking results to a skeptical executive team, the structure's already there.
Here's what's available.
Template 1: Product Feature Benchmarking Process with Competitors
Structured benchmarking across every major competitive dimension starts here. This deck maps product quality, variations, store delivery, customer service quality, after-sale support, and delivery speed side by side. Each element gives your audience a clear view of where your product stands. Presenting competitive analysis across multiple variables has never been more direct. You can confidently highlight strengths and expose competitor gaps with precision. The layout keeps complex multi-variable comparisons visually clean and instantly readable. Built for product managers who need actionable insights, not cluttered data walls. Transform your competitive analysis presentations with this powerful deck. Download it now and command every feature benchmarking conversation with confidence.

Download this PowerPoint Template
Template 2: Product Benchmarking Made Easy with Editable PPT
Clarity under pressure is what this deck delivers—no clutter, no compromise. Every layout prioritises your message, ensuring your audience absorbs the benchmarking story quickly. The design combines visual impact with functional structure for high-stakes presentations. You can align each slide to your brand without losing the professional finish. Ideal for product teams presenting performance metrics to leadership or investors. This deck turns raw competitive data into persuasive, board-ready narratives efficiently. Transform your product benchmarking presentations with this ready-made framework. Download now and make every comparison count where it matters most.
[product_image id=1455141]
Template 3: Competitive Product Price Benchmarking Comparative Analysis Table
Pricing decisions get easier when the data is laid out this precisely. This slide delivers a structured price benchmarking comparison across same-category products from multiple vendors. Every row covers product description, units, quantity, and vendor-specific pricing—all in one table. Stakeholders can spot price differentials immediately without digging through separate reports. The comparative table format supports procurement decisions and competitive positioning reviews alike. Finance and strategy teams will rely on this slide in vendor negotiation discussions. Transform your competitive pricing presentations with this sharp, data-driven layout. Download now and bring instant clarity to every vendor price conversation.

Download this PowerPoint Template
Template 4: Product and Service Benchmarking for Smart Phones
Side-by-side smartphone comparisons are deceptively hard to present well. This deck solves that by visually mapping screen size, battery life, and 5G readiness across three devices. Decision-makers see each product's strengths and weaknesses without wading through specs. The layout guides the audience toward informed conclusions rather than leaving them to interpret raw data. Perfect for product evaluation teams, retail analysts, and consumer tech strategists. Each visual element is structured to highlight differentiation and support market positioning discussions. Transform your product and service benchmarking presentations today. Download this deck and make complex feature comparisons immediately persuasive.
[product_image id=1127658]
Template 5: Product Benchmarking Best Practices PPT Sample
Best practices are only as good as how clearly you communicate them. This deck gives product benchmarking best practices a visual structure that commands attention immediately. It blends creativity with professional polish, ensuring your content doesn't disappear into slide noise. You can align color schemes and layouts to your brand in minutes. From boardroom reviews to product team workshops, this deck fits every context. Its pre-designed structure saves significant preparation time without sacrificing depth. Transform your product benchmarking best practices presentations with this dynamic deck. Download now and ensure your benchmarking methodology lands with maximum clarity.
[product_image id=1532541]
Template 6: Product Benchmarking Techniques and Insights PPT Information
Techniques and insights lose impact when the deck holding them is forgettable. This presentation gives product benchmarking techniques a visual framework that sustains audience attention from start to finish. The design balances analytical depth with clean, engaging aesthetics that work in any setting. You can use it equally well for client pitches, internal reviews, or executive briefings. Its structure naturally guides stakeholders through insight layers without overwhelming them. Every slide supports a confident, data-driven conversation about performance optimization. Transform your benchmarking techniques presentations with this striking, ready-made deck. Download now and ensure your insights make the impression they deserve.
[product_image id=1817957]
Template 7: Product Benchmarking Matrix Chart Showing Ratings of Product Features
Matrix charts reveal patterns that simple tables miss—this deck makes that advantage clear. Feature ratings across product quality, cost of serving, sales service, customer service, and price are mapped in one visual frame. Stakeholders immediately see where each product excels and where gaps exist. The matrix format supports rapid quality assessment across multiple benchmarking dimensions simultaneously. Product managers and analysts use this slide to anchor prioritisation conversations. No hunting through separate data sources—every rating sits in one clean, legible view. Transform your product benchmarking matrix presentations today. Download now and turn multi-dimensional ratings into decisive, board-ready intelligence.

Download this PowerPoint Template
Template 8: Product and Service Benchmarking for Product Features
Setting the right industry standards as benchmarks requires more than a list of features. This deck presents a structured comparison of different product features measured against established industry benchmarks, including direct user feedback. The side-by-side layout makes it straightforward to see where your product meets, exceeds, or falls short of expectations. User feedback sits alongside objective feature data, giving the comparison real-world credibility. Ideal for product development teams building roadmaps around validated performance gaps. The format turns feature comparison into a clear, actionable brief for any stakeholder audience. Transform your product and service benchmarking presentations with this ready framework. Download now and give your feature analysis the structure it needs to drive decisions.
[product_image id=1127647]
Template 9: Product Benchmarking to Identify Gaps and Innovation Opportunities
Identifying gaps is only half the work. The harder part is turning those gaps into a clear innovation argument for leadership. This PPT template is built for product managers who need to move from gap analysis to opportunity framing quickly. Whether you're presenting competitive intelligence findings or product analytics to a cross-functional team, this deck gives the work a credible structure. Product benchmarking templates like this one help teams move from raw findings to actionable priorities efficiently. The template is 100% editable and customizable.
[product_image id=1746091]
Template 10: Best Practices for Product Benchmarking Process
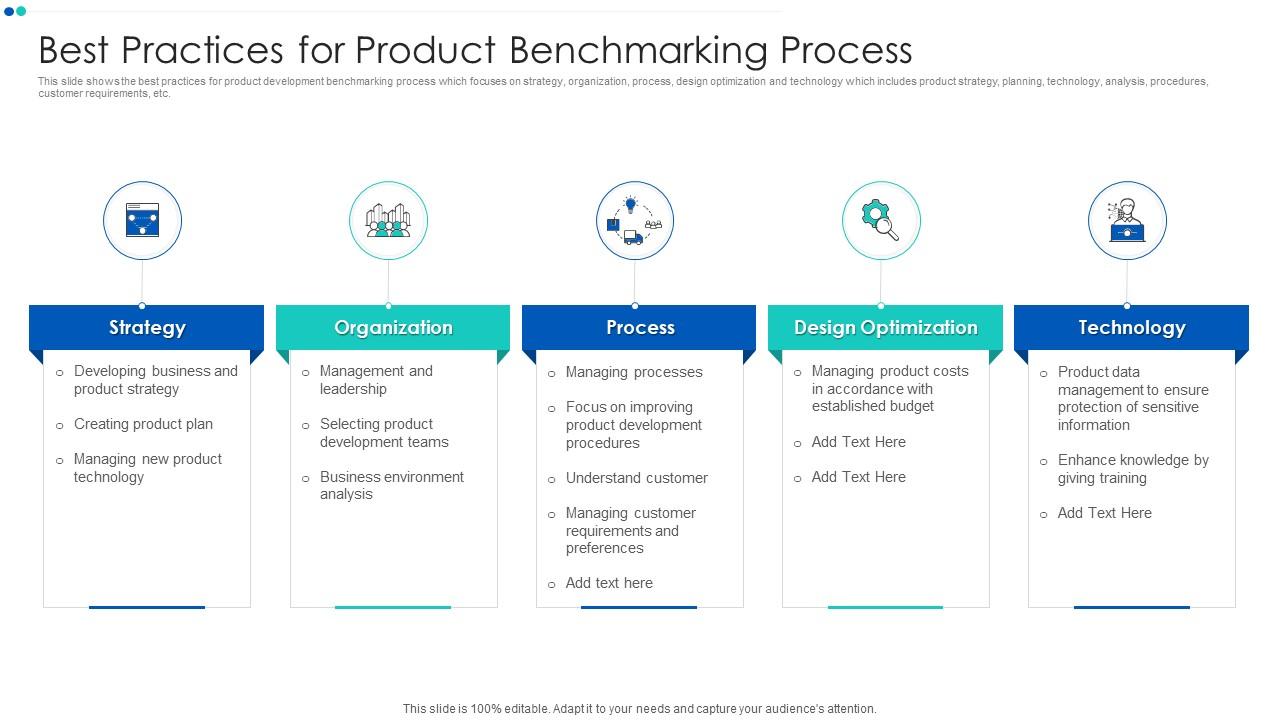
Good product development benchmarking needs a clear process, not just a checklist. This PPT preset maps five core practices—strategy, organization, process, design optimization, and technology—into one structured visual. It's the kind of slide a product lead reaches for when presenting a benchmarking program to senior stakeholders or a cross-functional team. The five-stage layout keeps the conversation grounded and makes each practice area easy to discuss separately. For context, this industry benchmarking template resource is a useful companion reference. The template is 100% editable and customizable.
Download this PowerPoint Template
Template 11: How to Compare and Improve Product Performance using Product Benchmarking PPT
Comparing and improving product performance takes more than good data. It takes a deck that makes the case clearly enough to drive decisions. This presentation gives product teams a structured framework for presenting performance benchmarks, improvement plans, and competitive positioning in one cohesive flow. The visually dynamic design works equally well in boardroom reviews and client pitches. You can surface ROI measurement findings and performance optimization priorities without losing your audience mid-deck. Its pre-designed layout removes the setup friction so you focus on the argument, not the formatting. Transform your product performance benchmarking presentations with this engaging deck. Download now and ensure every comparison leads to a clear next step.
[product_image id=1746090]
Template 12: Competitive Product Benchmarking PPT Mockup
Competitive product benchmarking is most persuasive when the presentation itself looks credible. This PowerPoint slide gives competitive analysts and product strategists a clean, professional layout that carries authority. It's built for moments when you're presenting market positioning data to leadership and the deck needs to hold up under scrutiny. The structure adapts easily to different competitor sets and benchmarking dimensions. Competitive benchmarking template resources like this one make it faster to build a presentation that matches the depth of your analysis. The template is 100% editable and customizable.
[product_image id=1496367]
Template 13: Transform Your Insights Using Product Benchmarking Template
Raw insights rarely speak for themselves—this deck gives them the structure they need. It transforms scattered benchmarking findings into a coherent, visually compelling narrative for any audience. The balanced design pairs simplicity with enough sophistication to hold attention in high-stakes settings. You can shape the color theme and layout to match your organisation's visual identity quickly. Ideal for product analysts and strategy leads who need their data to land with conviction. Transform your product benchmarking insights presentations with this ready-made deck. Download now and make every finding count where decisions get made.
[product_image id=1457106]
Template 14: Product and Service Benchmarking PPT Information
Product and service benchmarking often needs to cover both quantitative metrics and qualitative judgments. This PowerPoint slide gives practitioners a layout that holds both types of information cleanly. It suits product managers, service quality leads, and analysts who present benchmarking reviews to mixed audiences. The structure is flexible enough to cover different product categories or service dimensions without redesigning from scratch. So yeah, for teams managing vendor benchmarking alongside product evaluation, this PPT preset works across both conversations. The template is 100% editable and customizable.
[product_image id=1538426]
Template 15: Competitor Product Sales Benchmarking PPT Summary
Sales benchmarking against competitors rarely gets the visual clarity it deserves. This PPT template gives sales strategists and product marketing teams a structured layout for presenting competitor sales performance data. It's built for the moment when a leadership team needs to see, in one slide, how product sales stack up across the market. The design is clean enough to present in a board meeting and flexible enough to adapt to different competitor sets. Real business decisions—pricing, positioning, sales focus—get easier when this kind of data is presented well. The template is 100% editable and customizable.
[product_image id=1507822]
Template 16: Benchmarking Competitors' Product Comparison PPT Demonstration
Feature-by-feature product comparison is one of the most common benchmarking tasks, and one of the hardest to present without losing the room. This PPT preset gives analysts and product leads a comparative layout that walks audiences through competitor features without overwhelming them. It's the kind of deck that works in a product strategy review or a market analysis briefing. The structure keeps each comparison point readable and the narrative intact. For teams doing deep product differentiation work, this slide handles visual heavy lifting. The template is 100% editable and customizable.
[product_image id=1672219]
Template 17: Competitive Product Analysis PPT Presentation
Competitive product analysis needs a presentation structure that matches its analytical depth. This deck delivers exactly that—a visually striking layout built for teams presenting competitor analysis to demanding audiences. Every slide balances data density with readability, ensuring complex comparisons stay clear. You can use it across boardroom strategy sessions and client-facing briefings with equal confidence. The pre-designed layout means you spend time on the analysis, not the slide architecture. It supports data-driven insights presentations where every detail of competitive positioning needs to register. Transform your competitive product analysis presentations with this powerful deck. Download and ensure your analysis drives real strategic action.
[product_image id=1524318]
Template 18: Competitive Product Benchmarking Feature-by-Feature Comparison PPT Example
Feature-by-feature comparison is where competitive benchmarking gets granular. This PowerPoint slide is built for product managers and analysts who need to walk stakeholders through a detailed, attribute-level competitor comparison without losing clarity. The structure works whether you're benchmarking two products or six, across a handful of features or a full product specification. It's a reliable tool for product differentiation discussions and competitive intelligence presentations. For context, teams building a broader benchmarking program will find this PPT preset fits naturally into a larger competitive review deck. The template is 100% editable and customizable.
[product_image id=1728659]
Template 19: How to Conduct Effective Product Benchmarking Analysis PPT
Conducting a product benchmarking analysis is straightforward in theory and genuinely hard in practice. This PPT template gives analysts and product teams a structured walkthrough of the benchmarking process—clear enough to present to stakeholders who aren't close to the methodology. It's useful when you need to explain not just the findings, but how you arrived at them. The layout supports both the process narrative and the data presentation in one coherent deck. For teams working through systematic market analysis, this slide handles the structural complexity. The template is 100% editable and customizable.
[product_image id=1729174]
Template 20: Product Benchmarking Best Practices for Continuous Improvement PPT Graphics
Continuous improvement in product benchmarking requires a framework that evolves with your product. This deck gives that framework a visual structure that holds up over repeated review cycles. The design pairs strong aesthetics with functional clarity, ensuring best practices don't get buried under visual noise. You can adapt it to quarterly benchmarking reviews, annual product audits, or ongoing KPI tracking cycles without redesigning from scratch. Product teams committed to sustained performance optimization will find this deck structures their thinking as much as their presentations. Its pre-built layouts keep every improvement cycle visually consistent and strategically focused. Transform your continuous improvement benchmarking presentations with this dynamic deck. Download now and keep your product performance standards rising every review cycle.
[product_image id=1706792]
Win Every Product Review with SlideTeam
SlideTeam's PowerPoint templates are the best in the industry for product benchmarking. These content-ready slides save hours of formatting work while delivering the professional quality your competitive analysis deserves. Use these PowerPoint slides to present performance metrics, feature comparisons, and market positioning with clarity and confidence. Grab these ready-made templates and turn your benchmarking data into decisions that drive real results.
FAQs on Product Benchmarking
What are the most critical metrics to include when benchmarking a SaaS product against its competitors?
Focus on four to five metrics that directly reflect user value and market fit. These typically include monthly active users, churn rate, average revenue per user, customer satisfaction score, and feature adoption rate. Pricing tier comparison and time-to-value are worth adding for SaaS-specific context. Avoid tracking everything — pick the metrics where you have reliable competitor data and clear internal baselines.
How can businesses determine whether performance gaps identified through benchmarking are worth addressing?
Apply two filters: the size of the gap and the cost of closing it. A large gap in a feature customers actively choose competitors for is worth addressing. A gap in a feature with low customer demand is not. Run a quick ROI estimate — what revenue or retention improvement does closing this gap realistically produce? If the number doesn't justify the engineering effort, move on.
What distinguishes competitive benchmarking from functional benchmarking in a product development context?
Competitive benchmarking compares your product directly against named rivals on shared metrics — pricing, features, market share. Functional benchmarking looks outside your industry entirely, studying how a best-in-class process works regardless of sector. In product development, competitive benchmarking tells you where you stand today. Functional benchmarking tells you what's possible if you borrow a better approach from elsewhere.
How do you ensure the data collected during product benchmarking remains unbiased and statistically significant?
Use at least three independent data sources for every metric — customer reviews, published reports, and direct product testing where possible. Standardize how you collect data across all products being compared so no single product gets measured under easier conditions. Document your methodology. Have someone outside the analysis team review the findings before presenting. Sample size matters — thin data produces unreliable conclusions.
Which benchmarking framework is most effective for early-stage startups with limited market data?
The lean competitive benchmarking approach works best for early-stage startups. Pick three to five direct competitors and compare on five features or metrics your target customers have said matter most. Use publicly available data — review sites, pricing pages, product documentation. Avoid complex scoring models when data is sparse. The goal is directional clarity, not statistical precision.
How can product teams use benchmarking results to prioritize their roadmap without losing sight of innovation?
Separate gaps into two buckets: table-stakes gaps that put you at a competitive disadvantage, and innovation opportunities that could create differentiation. Fix table-stakes gaps first — they protect retention. Then allocate a portion of the roadmap to innovation that benchmarking data points toward but doesn't fully define. Benchmarking tells you where the market is; your product instinct tells you where it could go.
What role does customer perception play in benchmarking when objective performance metrics tell a different story?
Customer perception is a performance metric — treat it as data, not noise. When perception and objective metrics diverge, the gap usually lives in communication, not the product. A technically superior product that customers don't believe is superior has a marketing and messaging problem. Benchmarking should include customer satisfaction scores and perception surveys alongside feature and performance data to give an honest picture.
How frequently should a product benchmarking cycle be conducted to stay relevant in a fast-moving market?
In fast-moving markets, run a lightweight competitive scan quarterly and a full benchmarking cycle twice a year. Trigger an unscheduled review when a major competitor launches a significant product update or enters a new segment. Annual cycles are too slow for most software and consumer tech categories. The frequency should match how quickly your competitive landscape actually changes.