





 0 Comment
 Customer Reviews

The deck's built. The KPIs are in it. Someone still can't explain what they mean.
That's the gap nobody talks about. Not the data problem—most organizations have too much data, not too little. The real problem is the space between having numbers and knowing what they say about where things are headed. Between tracking activity and measuring outcomes that actually connect to something bigger.
Performance reviews tend to expose this. A manager walks in with a slide full of metrics. Green indicators everywhere. And then someone asks, "So are we on track for the annual goal?"—and there's a pause. Because the metrics on screen measure what happened last month, not whether the organization is moving in the right direction.
That pause is expensive. Not just in the meeting. In every decision made without a clear read on strategic performance—the hiring call, the budget reallocation, the product bet. When measurement doesn't connect to strategy, people default to what's easy to count. Outputs instead of outcomes. Activity instead of impact.
It compounds fast. Different teams track different things. No one agrees on what "good" looks like. Dashboards multiply. Reporting becomes a ritual instead of a tool. And the executives who need clear signals get noise.
So the templates exist. Not because building a performance framework is impossible—it isn't. But because structuring one from scratch, slide by slide, is where most teams lose two weeks and still end up with something that doesn't hold together in a room.
SlideTeam's strategic performance measurement templates handle exactly this—the structure you need when the framework has to be clear, credible, and ready to defend. Pre-designed slides that cover everything from KPI dashboards to Balanced Scorecard models to project-level process maps, without starting from zero.
Here's what's in the collection.
Template 1: Strategic Objectives Performance Measures Categorized
Connecting organizational goals to measurable outcomes demands a clear, structured visual framework. This template drives instant alignment between strategic objectives and the performance measures that track them. Intuitive visual layouts deliver immediate clarity on which metrics map to which goals. You gain a compelling structure to present strategic intent alongside accountability indicators. Use this to anchor executive presentations around goal setting frameworks and data-driven decision making. Every section links purpose to performance without ambiguity. Transform your strategic objectives presentations into decisive leadership communication tools today. Download this dynamic template now and unlock your strategic performance measurement potential.

Download this PowerPoint Template
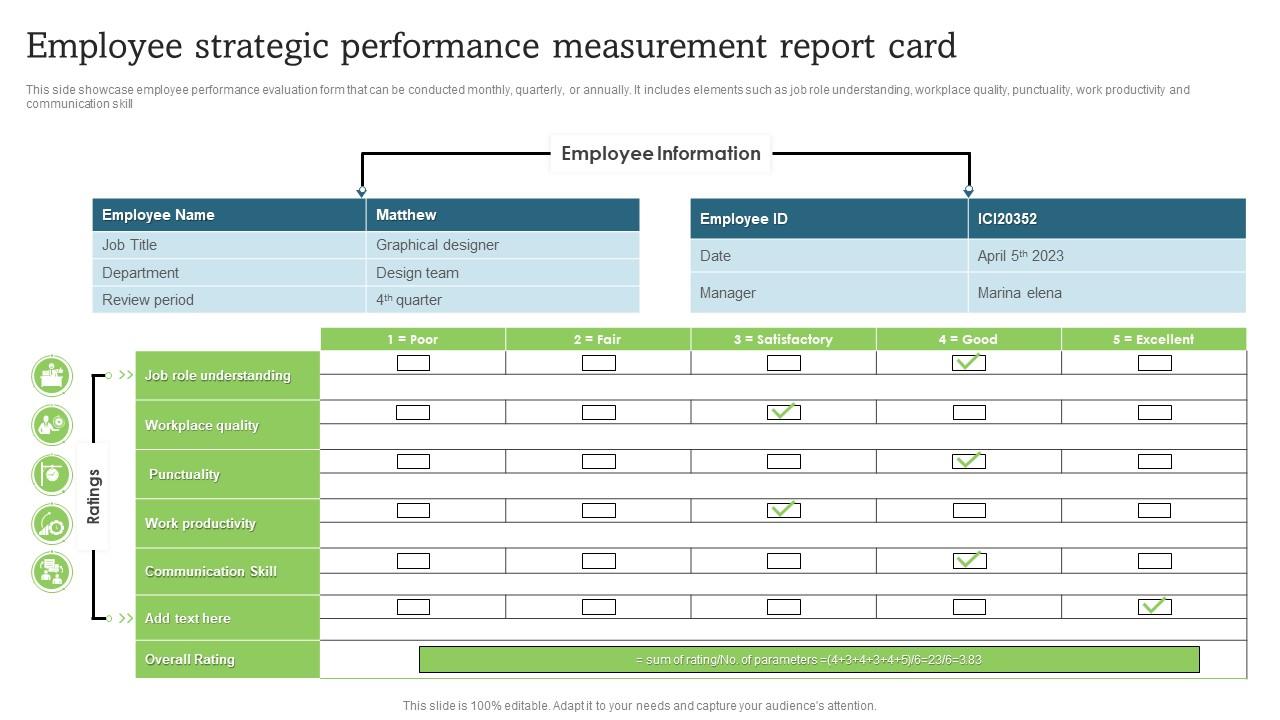
Template 2: Employee Strategic Performance Measurement Report Card
Workforce performance management becomes concrete when evaluation criteria are visible and consistent. This template captures job role understanding, workplace quality, punctuality, productivity, and communication skills in one structured report card. Monthly, quarterly, or annual review cycles are all accommodated without restructuring the layout. The clean, logical design ensures evaluators and employees read the same story from the same data. Use this to run credible, repeatable performance evaluations across teams and departments. Transform how your organization documents and communicates employee performance outcomes. Download this template now and elevate your workforce performance reporting.
Download this PowerPoint Template
Template 3: Performance Measurement Dashboard for Managers PPT Outline
Managers need performance data at a glance, not buried in spreadsheets. This PPT preset gives practitioners a clean KPI dashboard structure designed for fast, confident review. A strategy director presenting monthly business performance management results reaches for a layout exactly like this. The template organizes metrics clearly so leadership can act, not just observe. The template is 100% editable and customizable.
[product_image id=1784129]
Template 4: Performance Measurement Frameworks for Strategic Growth PPT
A sound performance measurement framework is the backbone of any credible growth narrative. This template captures multiple strategic frameworks side by side, giving you the comparative structure executives need to evaluate options. Rich visual layouts translate complex methodology into clear, persuasive communication. You can build compelling presentations on benchmarking strategies and strategy execution with professional confidence. Use this to anchor boardroom discussions on corporate strategy and business outcomes measurement. Transform your performance framework presentations with structure that commands attention. Download this dynamic template now and unlock sharper strategic growth conversations.
[product_image id=1784130]
Template 5: Strategic Performance Measurement Systems Evaluation Matrix PPT Complete Deck
Evaluating which performance measurement system fits your organization is not a simple call. This PPT template gives analysts and strategy teams a structured matrix to compare systems side by side. Whether the context is rolling out a Balanced Scorecard or reviewing an integrated performance model, this deck keeps the comparison grounded. It suits performance evaluation workshops and senior leadership briefings equally well. The template is 100% editable and customizable.
[product_image id=1831176]
Template 6: Performance Measurement in Strategic Management PPT Information
Performance measurement inside strategic management requires a framework that connects daily decisions to long-term direction. This PPT slide is built for strategy officers and planning teams who need to show that connection clearly. It suits sessions where leadership reviews whether current operations support corporate strategy. Use it to present how performance analytics feed back into planning cycles. The template is 100% editable and customizable.
[product_image id=1795447]
Template 7: Performance Measurement Aligning Goals with Strategic Objectives
Misaligned goals quietly drain organizational momentum—this template fixes the visibility problem. It delivers a structured visual bridge between performance indicators and strategic objectives, so every metric earns its place on screen. Crisp layouts help you communicate how individual targets ladder up to enterprise-level priorities. The result is a presentation that makes goal alignment look intentional, not accidental. Use this in executive scorecard reviews and cross-functional planning sessions to drive clarity across teams. Transform your alignment presentations into confident strategy execution tools today. Download this template now and make every performance indicator count.
[product_image id=1664819]
Template 8: Effective Strategic Planning to Achieve Company Goals PPT
Good strategic planning only works when the execution story is equally clear. This PPT preset is built for leaders presenting how company goals translate into action across teams and functions. A COO or division head mapping out organizational goals for the next planning cycle would use a deck structured exactly like this one. It keeps the audience focused on outcomes, not just activities. The template is 100% editable and customizable.
[product_image id=1642093]
Template 9: Strategic Performance Measurement Systems Evaluation Matrix
Choosing between performance measurement systems is easier when the comparison is already structured. This PowerPoint slide maps five major frameworks—Balanced Scorecard, business excellence model, Cambridge model, integrated performance measurement, and performance pyramid—into a single evaluation matrix. Strategy teams and management consultants use this kind of side-by-side view to align leadership on which model fits the organization's stage and sector. It removes the guesswork from a high-stakes decision. The template is 100% editable and customizable.

Download this PowerPoint Template
Template 10: Performance Measurement Governance Overview PPT Information
Performance measurement without governance tends to drift—different teams track different things, and accountability blurs. This PPT template gives governance leads and compliance officers a clear structure to present oversight roles, review cadences, and accountability lines. It works well in performance monitoring tool rollouts or audit committee briefings. For context, governance is often the missing layer between good data and consistent decisions. The template is 100% editable and customizable.
[product_image id=1795446]
Template 11: Strategic Partnerships and Collaborations PPT Sample
Strategic partnerships only deliver value when both sides can measure progress against shared goals. This PPT preset helps partnership leads and business development teams present collaboration frameworks with structure and clarity. Whether the context is a joint venture review or a co-investment progress briefing, this slide keeps the narrative grounded in performance. It ties partnership activity back to measurable business outcomes. The template is 100% editable and customizable.
[product_image id=1831175]
Template 12: Balanced Scorecard Approaches to Strategic Performance Measurement
Balanced Scorecard adoption often stalls because the presentation doesn't make the method feel practical. This PPT slide changes that by giving strategy teams a structured, visually clear way to show how the Balanced Scorecard drives performance measurement success. A CFO or strategy director presenting the case for this framework to the board would benefit from exactly this level of clarity. It moves the conversation from theory to application fast. The template is 100% editable and customizable.
[product_image id=1866362]
Template 13: Strategic Performance Measurement and Reporting PPT Bundles
Building a complete strategic performance measurement narrative across fourteen slides demands more than good data—it requires structure. This bundle delivers that structure, covering the full scope of performance reporting from KPI definition to executive scorecard review. Fourteen distinct slides let you assign one topic per slide, keeping each layer of the story clean and followable. Use this when you need a full-deck solution for performance analytics briefings, planning off-sites, or board strategy sessions. The template is 100% editable and customizable.
[product_image id=650334]
Template 14: Measuring Strategic Performance and Impact PPT Sample
Measuring strategic performance and its real-world impact is one of the harder stories to tell clearly. This template gives you a visually persuasive structure to present outcomes, not just activities. Striking design elements focus audience attention on what changed—and why it matters at the strategic level. You gain a ready-made framework for presenting progress against long-term business outcomes measurement goals. Use this in investor briefings, strategy reviews, or annual performance presentations. Transform your impact reporting with a deck that makes results land decisively. Download this template now and give your performance narrative the clarity it deserves.
[product_image id=1503137]
Template 15: Aligning Business Strategy with Performance Measurement Outline PPT
Business strategy only holds up when the measurement system behind it matches the ambition. This PPT template is built for teams presenting how performance measurement structures reinforce—not just track—business direction. Strategy leads and business analysts use this kind of deck to show leadership that measurement is built into execution, not bolted on after. It suits planning reviews where alignment between metrics and corporate strategy is on the agenda. The template is 100% editable and customizable.
[product_image id=1617966]
Template 16: Aligning Performance Indicators with Strategic Goals PPT Slides
KPIs that don't connect to strategic goals are just numbers with a label. This PPT preset gives planning teams a clear way to show how each performance indicator traces back to a specific strategic objective. It works well in OKR rollout presentations or mid-year strategic review sessions. So, if your organization is rebuilding its performance monitoring tools, this slide does the alignment work visually. The template is 100% editable and customizable.
[product_image id=1494228]
Template 17: Strategic Performance Review and Management Meeting Chart
Strategic review meetings only work when participants know exactly what documents, parties, and focal points are in scope. This template maps three core meeting types—enterprise and department strategy, and enterprise strategy refresh—into a single, readable chart. Attendee roles and required documents are visually separated so nothing falls through the cracks. Use this to standardize performance review cycles and drive accountability across leadership tiers. Transform your strategic review meeting communications into structured, repeatable processes today. Download this template now and bring discipline to your performance management cadence.

Download this PowerPoint Template
Template 18: Strategic Performance Measurement Scale Icon
Visualizing the scale and scope of a performance measurement system helps audiences grasp its architecture quickly. This icon-led template captures three distinct stages of strategic performance measurement in a clean, adaptable visual format. Strong iconography gives abstract concepts immediate visual weight in any presentation context. Use this in strategy workshops or executive briefings where you need to map performance thinking without dense text. Transform your strategic measurement communications with clarity that sticks in the room. Download this template now and make your performance framework instantly readable.

Download this PowerPoint Template
Template 19: Measuring Success KPIs for Business Strategy PPT Outline
KPIs only serve business strategy when they're defined, visible, and tied to outcomes that matter. This template drives that connection—presenting success metrics in a structure that leadership can interrogate and act on. Clean visual hierarchy ensures audiences immediately understand which KPIs signal strategic health. You gain a compelling framework for presenting performance analytics across business units or planning cycles. Use this to anchor quarterly business reviews and goal setting framework discussions with precision. Transform your KPI presentations into tools that drive real decisions. Download this template now and make your metrics mean something.
[product_image id=1489102]
Template 20: Strategic Project Management Performance Measurement Process Map
Project-level performance measurement gets complex fast when cost, schedule, and resources all move at once. This template maps the full process—cost accounting measures, schedule status, and resource management measures—into a clear four-stage process chart. Instant visual clarity ensures project sponsors and PMO leads can track what's slipping before it becomes a problem. Use this to present project performance data in strategy execution reviews and operational efficiency briefings. Transform your project management reporting with a process map that speaks to both detail and direction. Download this template now and bring structure to your project performance narrative.

Download this PowerPoint Template
Elevate Your Strategic Performance Measurement with SlideTeam
SlideTeam's PowerPoint templates are the best in the industry for strategic performance measurement. These content-ready slides save hours of design work while delivering the professional quality your KPI dashboards, Balanced Scorecard reviews, and executive scorecards demand. Use these ready-made frameworks to present performance metrics with clarity, structure, and strategic credibility. Deploy these PowerPoint slides to turn complex data into decisions that drive real business outcomes.
FAQs on Strategic Performance Measurement
How do you align performance metrics with long-term organizational strategy without sacrificing short-term operational visibility?
Use a two-tier measurement structure. At the top, track three to five long-term outcome metrics tied directly to strategic goals. Below that, run operational metrics on shorter cycles—weekly or monthly. The key is to schedule a regular checkpoint where both tiers are reviewed together. This keeps short-term visibility intact without letting it crowd out the strategic picture. Separate the cadence; connect the conversation.
What distinguishes a strategic KPI from a tactical KPI, and how should organizations manage both simultaneously?
A strategic KPI measures progress toward a multi-year goal—market share, customer lifetime value, or revenue growth. A tactical KPI tracks the actions driving that goal—conversion rates, ticket resolution times, or output volumes. Both matter. Run tactical KPIs at team level on short cycles. Review strategic KPIs quarterly at leadership level. The discipline is making sure each tactical metric can be traced back to at least one strategic outcome.
How can the Balanced Scorecard be adapted for organizations operating in highly volatile or disrupted industries?
Shorten the planning horizon. In volatile industries, a three-year Balanced Scorecard perspective becomes less useful than a rolling 12-month view. Keep the four quadrants—financial, customer, process, learning—but revisit the targets quarterly, not annually. Weight leading indicators more heavily than lagging ones, since past performance predicts less in disrupted markets. The structure of the Balanced Scorecard stays; the rigidity of its targets does not.
What are the most common pitfalls organizations face when transitioning from activity-based measurement to outcome-based measurement?
The biggest pitfall is keeping the old activity metrics running alongside new outcome metrics. Teams end up reporting both, which doubles the reporting load without doubling the insight. A second common failure is setting outcome metrics without controlling for external factors, making results hard to attribute. Start by retiring at least one activity metric for every outcome metric added. Make attribution explicit from day one.
How do you determine the right number of KPIs to track without creating metric fatigue or diluting strategic focus?
The practical ceiling for strategic KPIs is five to seven per organizational level. Beyond that, attention dilutes and prioritization breaks down. Start by asking which metrics would change a decision if they moved significantly. If a metric wouldn't trigger action, it probably doesn't need to be tracked at the strategic level. Push granular metrics down to operational teams. Keep the executive view lean and decision-focused.
In what ways does poor data quality undermine strategic performance measurement, and what governance structures can prevent it?
Poor data quality makes metrics untrustworthy, and untrustworthy metrics stop being used. The damage is quiet—people work around the numbers rather than with them. Prevent it by assigning a data owner to every KPI, not just a reporter. Establish a simple data governance structure: define the source, the update frequency, and who validates before publication. Even a lightweight governance layer cuts most data quality failures.
How should organizations measure intangible assets like brand equity, culture, and intellectual capital within a formal performance framework?
Use proxy metrics. Brand equity can be tracked through Net Promoter Score, share of voice, or brand recall surveys. Culture shows up in employee engagement scores, voluntary turnover rates, and internal mobility data. Intellectual capital maps to patent filings, training hours per employee, or knowledge-base usage rates. None of these are perfect, but consistent tracking over time reveals real trends. The goal is direction, not precision.
What role does cascading play in translating enterprise-level strategy into department and individual performance metrics?
Cascading breaks an enterprise-level goal into the specific contributions each department and individual must make. Without it, a company-level revenue target stays abstract for the sales team and invisible for operations. In practice, each department takes the enterprise KPI and defines what success at their level looks like in support of it. Each individual then does the same for their role. Cascading works when the logic is traceable—from the CEO's dashboard down to a team member's weekly targets.