Business Competition Strategies To Emerge As The Market Leader In Your Industry Complete Deck
Our Business Competition Strategies To Emerge As The Market Leader In Your Industry Complete Deck are topically designed to provide an attractive backdrop to any subject. Use them to look like a presentation pro.
- Google Slides is a new FREE Presentation software from Google.
- All our content is 100% compatible with Google Slides.
- Just download our designs, and upload them to Google Slides and they will work automatically.
- Amaze your audience with SlideTeam and Google Slides.
-
Want Changes to This PPT Slide? Check out our Presentation Design Services
- WideScreen Aspect ratio is becoming a very popular format. When you download this product, the downloaded ZIP will contain this product in both standard and widescreen format.
-

- Some older products that we have may only be in standard format, but they can easily be converted to widescreen.
- To do this, please open the SlideTeam product in Powerpoint, and go to
- Design ( On the top bar) -> Page Setup -> and select "On-screen Show (16:9)” in the drop down for "Slides Sized for".
- The slide or theme will change to widescreen, and all graphics will adjust automatically. You can similarly convert our content to any other desired screen aspect ratio.
Compatible With Google Slides

Get This In WideScreen
You must be logged in to download this presentation.
PowerPoint presentation slides
Presenting our Business Competition Strategies To Emerge As The Market Leader In Your Industry Complete Deck Presentation Slides that are sure to impress executives, inspire team members, and other audiences. We have used eye-pleasing PowerPoint graphics, templates, icons, and diagrams. The content has been well researched by our excellent team of researchers. You can change the colour, fonts, texts, images without any hassle to suit your business needs. The PPT is available in both standard screen and widescreen aspect ratios. Download the presentation, enter your content in the placeholders, and present it with confidence!
People who downloaded this PowerPoint presentation also viewed the following :
Content of this Powerpoint Presentation
Slide 1: This is the title slide for Business Competition Strategies to Emerge as the Market Leader in Your Industry. Add Your Company Name and you are good to go!
Slide 2: This slide shows the Table of Contents with headings covering Sources of Competitive Advantage, Sample Strategies, and Competitive Advantage Generic Strategies.
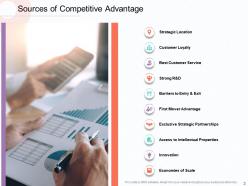
Slide 3: This slide lists the Sources of Competitive Advantage such as Strategic Location, Customer Loyalty, Best Customer Service, Strong R&D, Barriers to Entry & Exit, First Mover Advantage, Exclusive Strategic Partnerships, Access to Intellectual Properties, Innovation, and Economies of Scale.
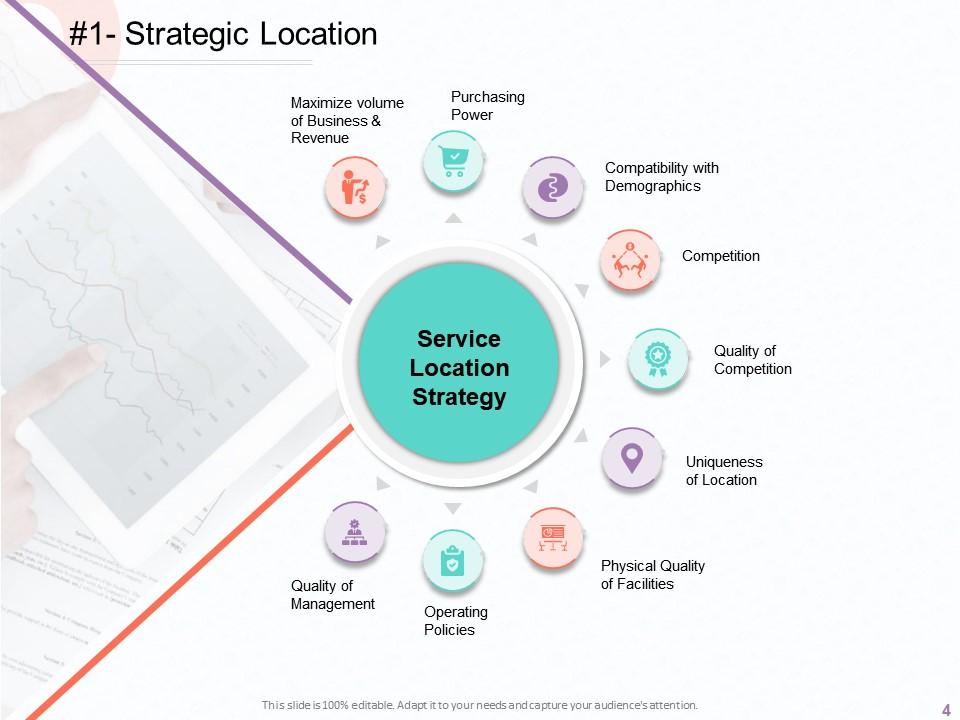
Slide 4: This slide shows the factors for selecting a Strategic Location including Maximize volume of Business & Revenue, Purchasing Power, Compatibility with Demographics, Competition, Quality of Competition, Uniqueness of Location, Physical Quality of Facilities, Operating Policies, and Quality of Management.
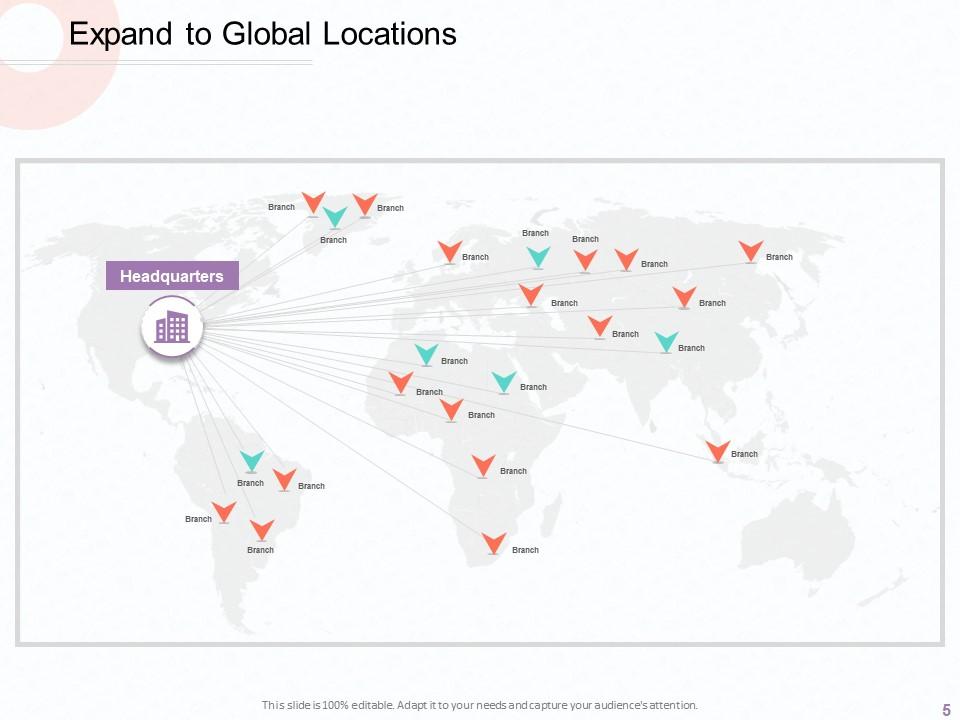
Slide 5: This slide shows a world map to show Expansion to Global Locations from a single headquarters site.
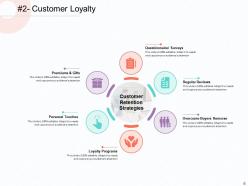
Slide 6: This slide displays the steps to maintain Customer Loyalty and Customer Retention Strategies such as Questionnaire/ Surveys, Regular Reviews, Overcome Buyers Remorse, Loyalty Programs, Personal Touches, and Premiums & Gifts.
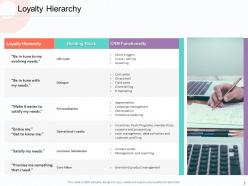
Slide 7: This slide showcases the Loyalty Hierarchy with Building block and CRM Functionality in a tabulated format.
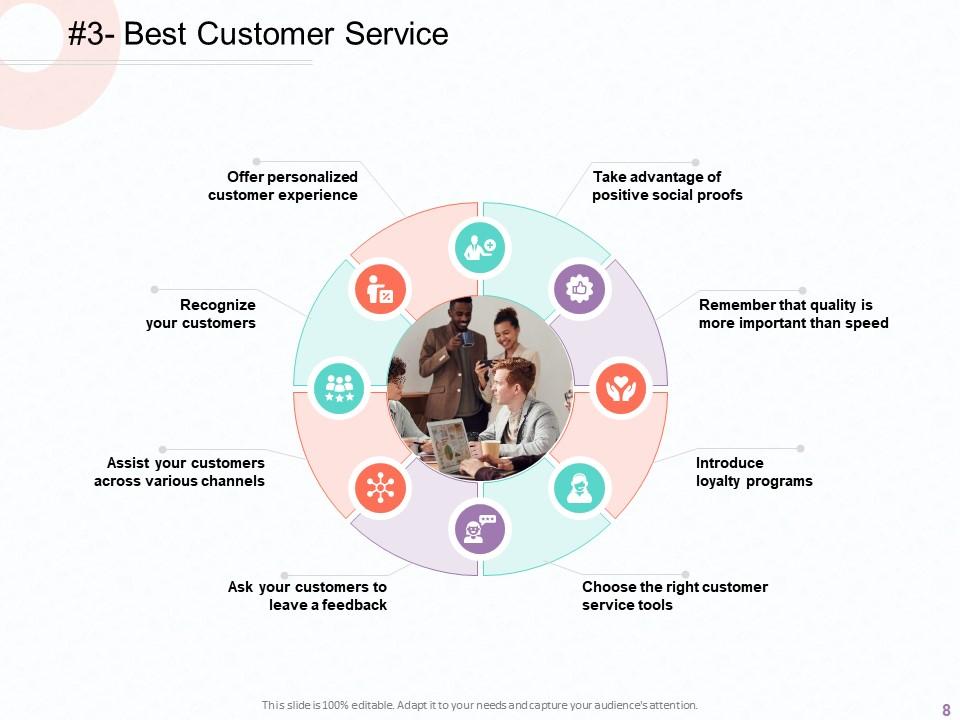
Slide 8: This slide displays the parameters for Best Customer Service including Take advantage of positive social proofs, Remember that quality is more important than speed, Ask your customers to leave feedback, Recognize your customers, Offer personalized customer experience, Assist your customers across various channels, Introduce loyalty programs, and Choose the right customer service tools.
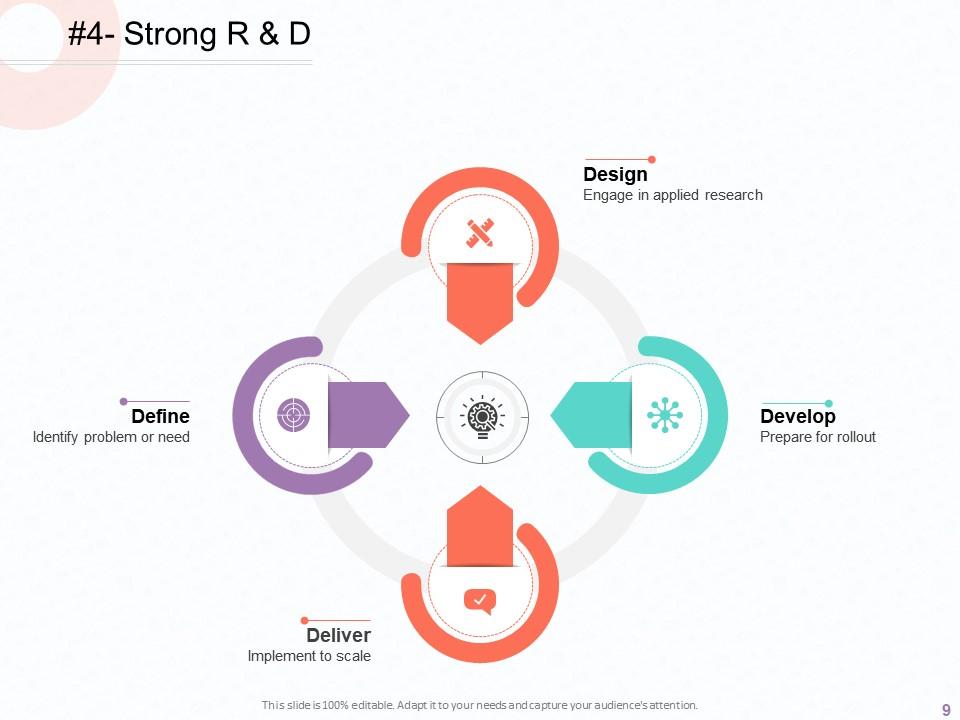
Slide 9: This slide shows the parts of a Strong R & D plan covering Design, Develop, Deliver, and Define.
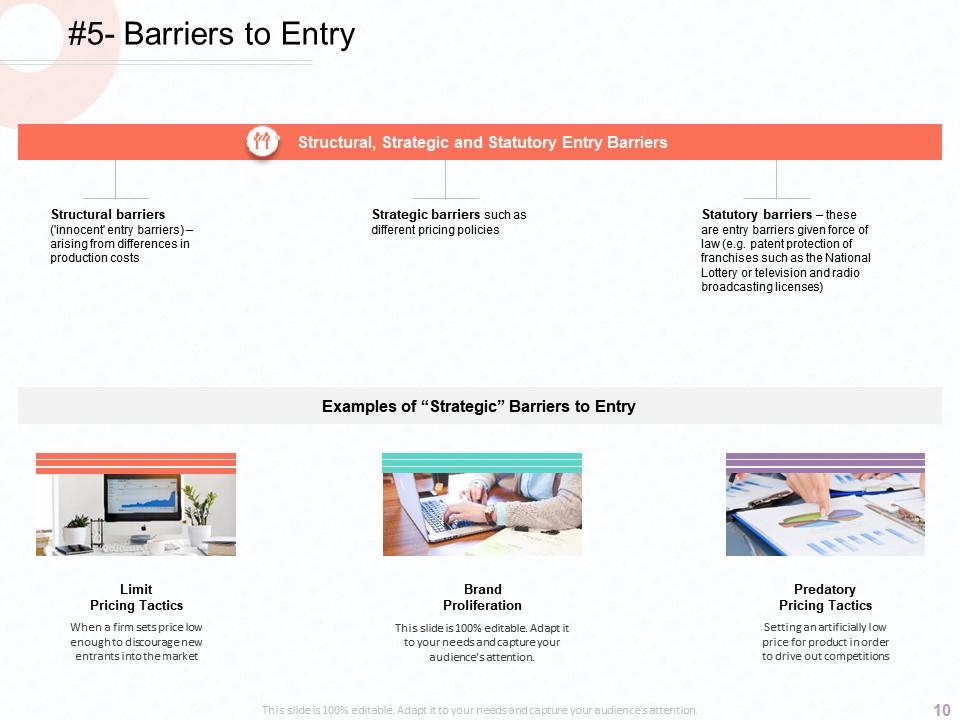
Slide 10: This slide presents the Barriers to Entry covering Structural barriers, Strategic barriers, and Statutory barriers. This slide lists the Examples of Strategic Barriers to Entry such as Limit Pricing Tactics, Brand Proliferation, and Predatory Pricing Tactics.
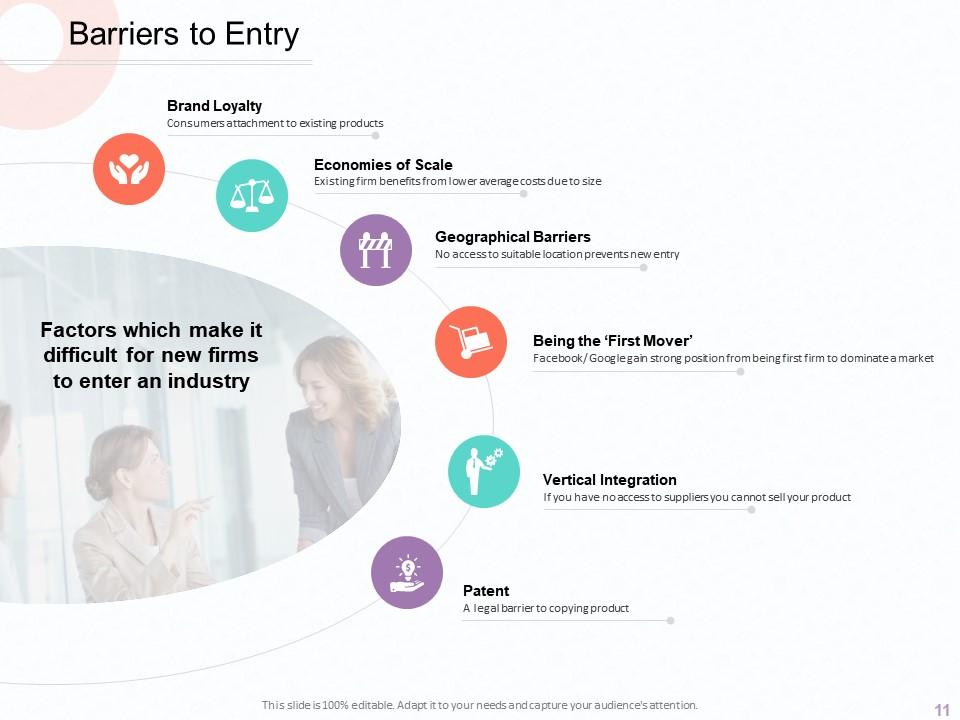
Slide 11: This slide displays the Barriers to Entry including Brand Loyalty, Economies of Scale, Geographical Barriers, Being the ‘First Mover’, Vertical Integration, and Patent.
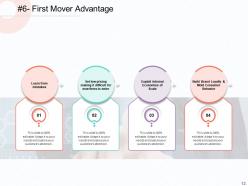
Slide 12: This slide shows the First Mover Advantage such as Learn from mistakes, Set low pricing making it difficult for new firms to enter, Exploit Internal Economies of Scale, and Build Brand Loyalty & Mold Consumer Behavior.
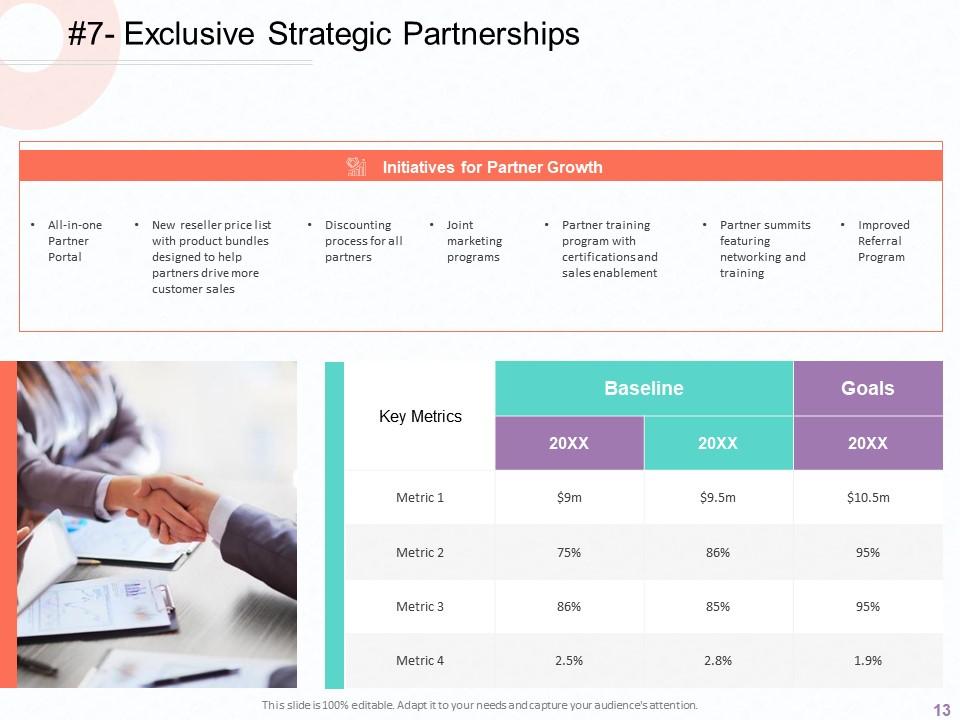
Slide 13: This slide displays the Exclusive Strategic Partnerships with Initiatives for Partner Growth and Key Metrics, Baseline, and Goals.
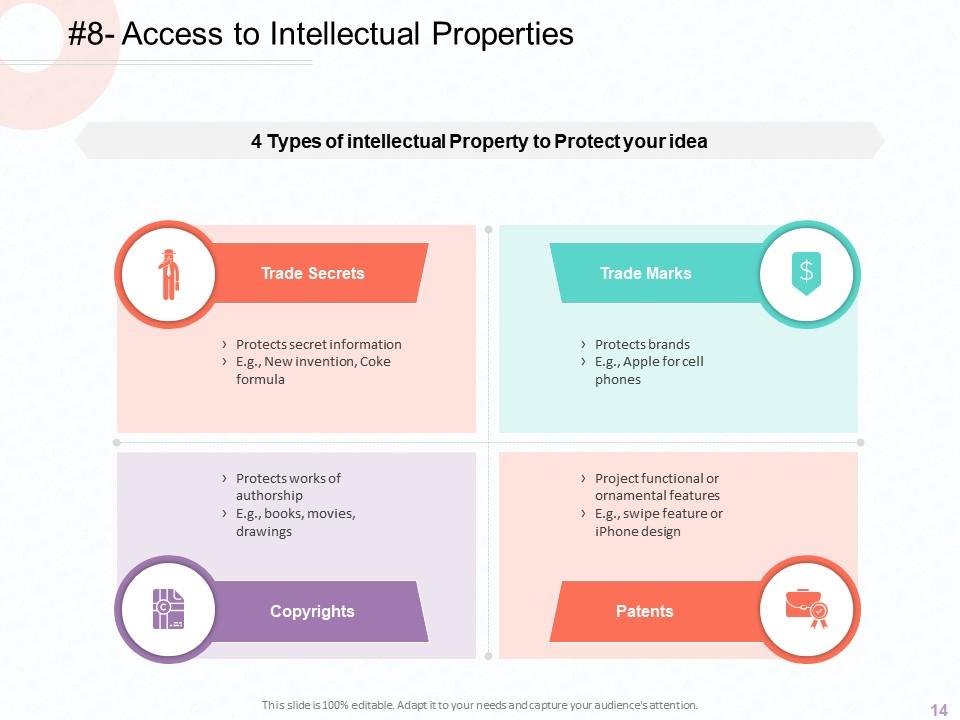
Slide 14: This slide showcases Access to Intellectual Properties covering Patents, Copyrights, Trade Marks, and Trade Secrets.
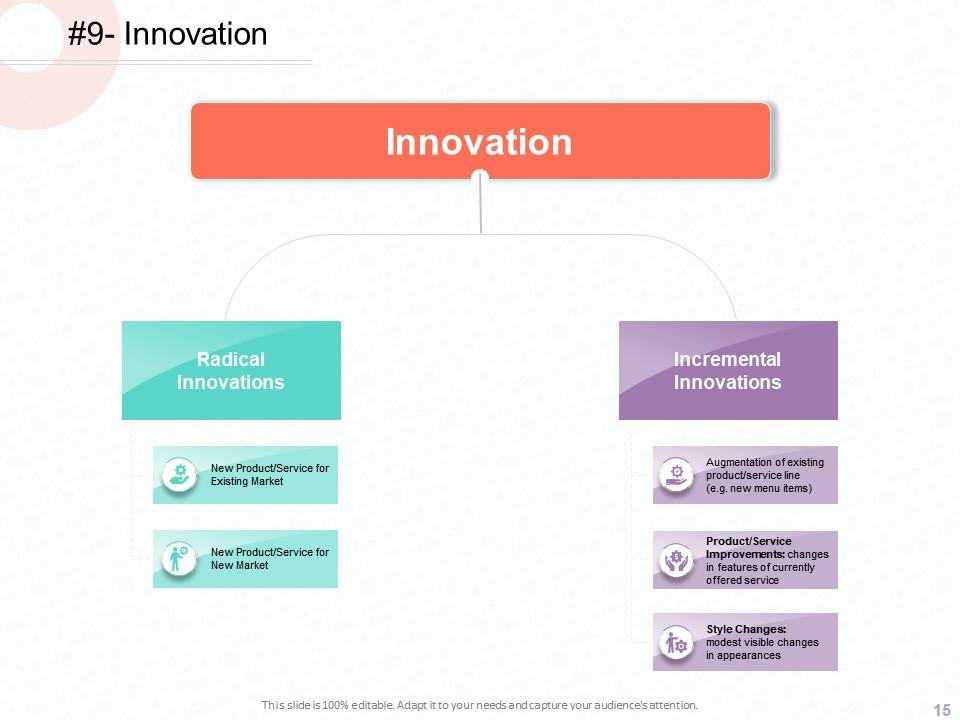
Slide 15: This slide presents the Innovation lists with respect to Radical Innovations and Incremental Innovations.
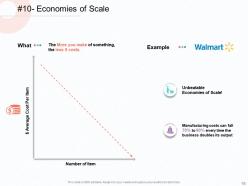
Slide 16: This slide shows the Economies of Scale with a line diagram for Average Cost Per Item and Number of Items.
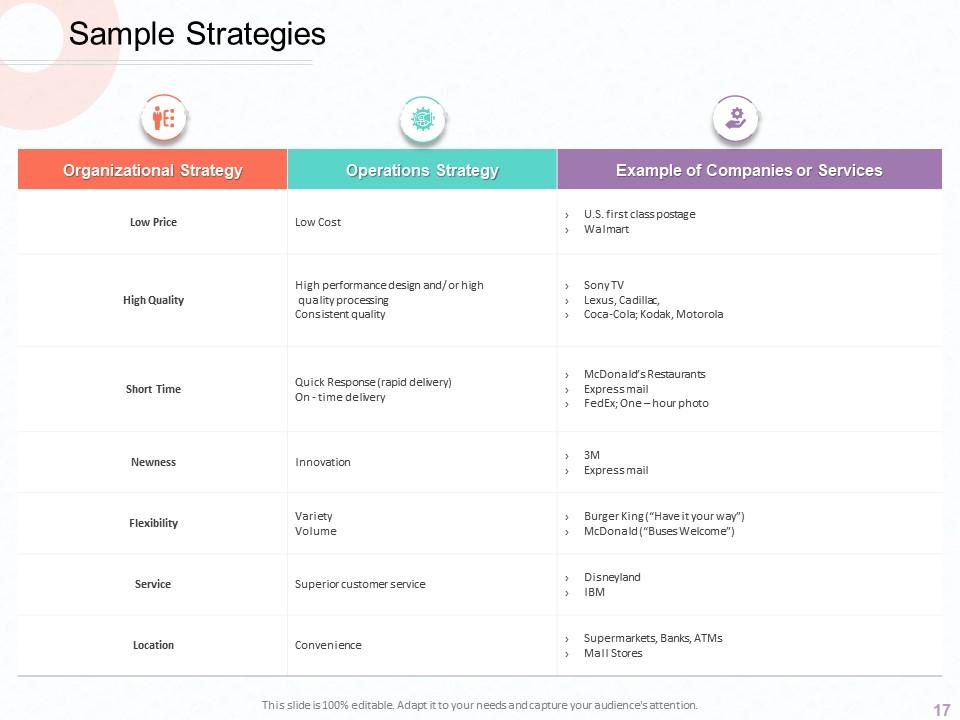
Slide 17: This slide displays the Sample Strategies covering Organizational Strategy, Operations Strategy, and Examples of Companies or Services.
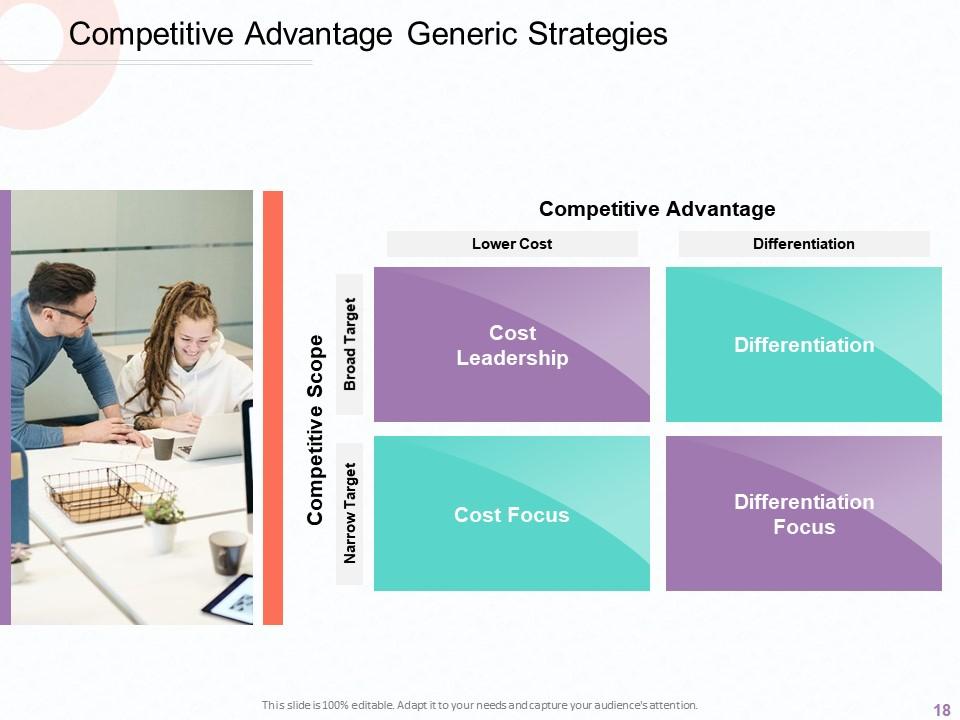
Slide 18: This slide showcases the Competitive Advantage Generic Strategies relative to Competitive Advantage and Competitive Scope.
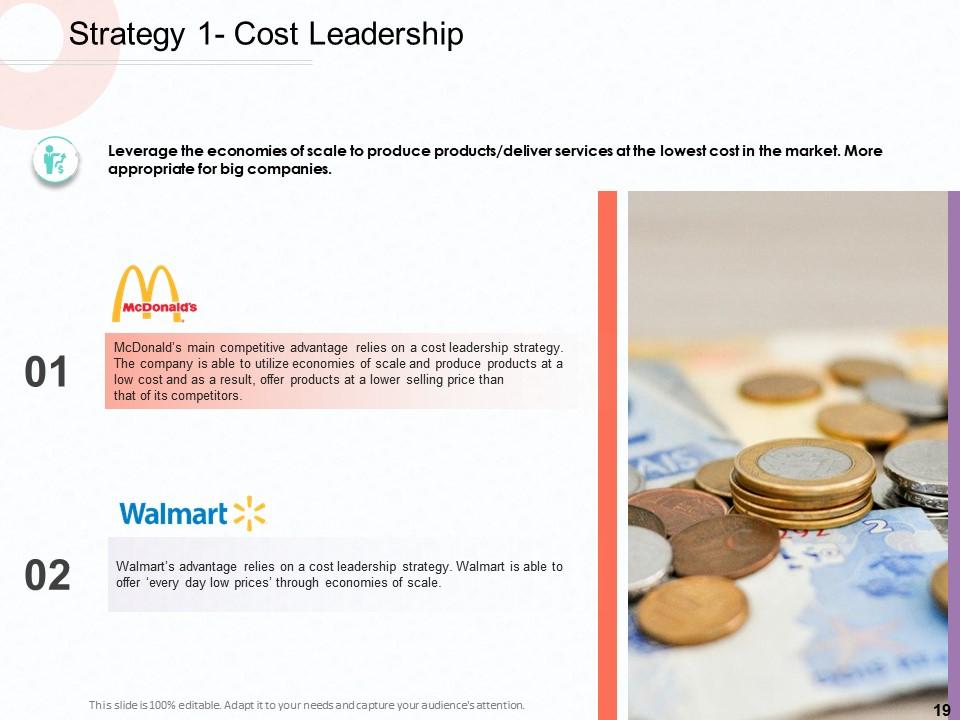
Slide 19: This slide covers Strategy 1- Cost Leadership in relation to McDonald's and Walmart. Leverage the economies of scale to produce products/deliver services at the lowest cost in the market. More appropriate for big companies.
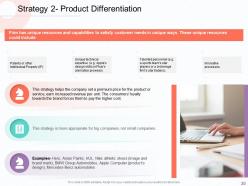
Slide 20: This slide shows Strategy 2- Product Differentiation covering Patents or other Intellectual Property (IP), Unique technical expertise (e.g. Apple's design skills or Pixar's animation prowess), Talented personnel (e.g. a sports team's star players or a brokerage firm's star traders), and Innovative processes.
Slide 21: This slide displays Strategy 3- Focus Strategies covering cost focus and differentiation focus.
Slide 22: This slide showcases the additional Icons provided with this presentation outline.
Slide 23: This slide introduces the Additional Slides provided with this presentation.
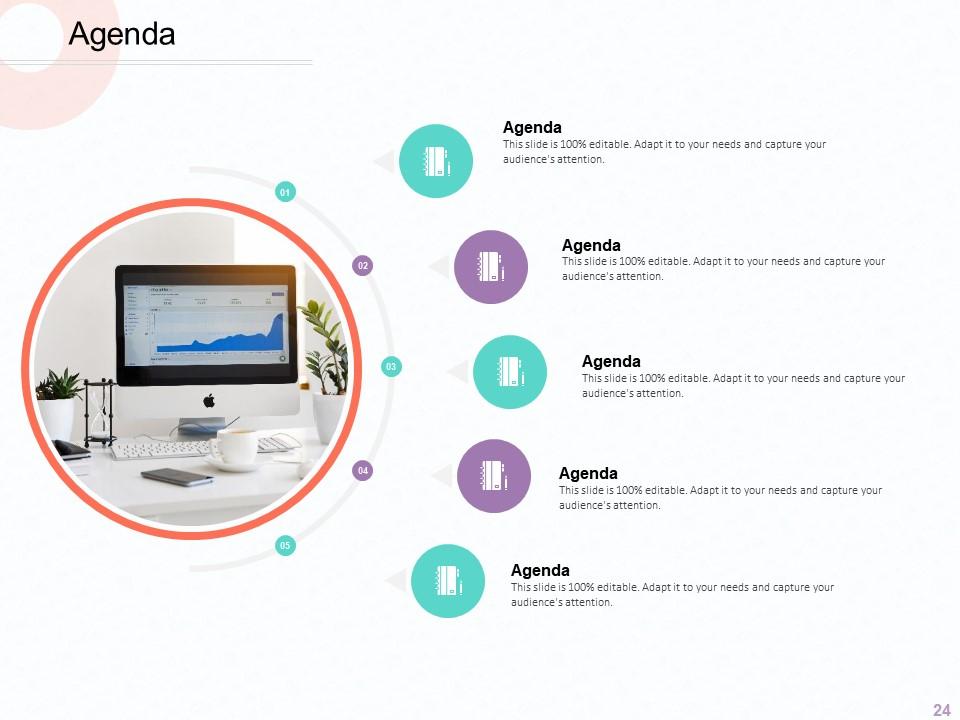
Slide 24: This slide shows the Agenda slide with room to add five points and a diagram/image.
Slide 25: This slide displays the Company Introduction with details on the Professional and the Creative.
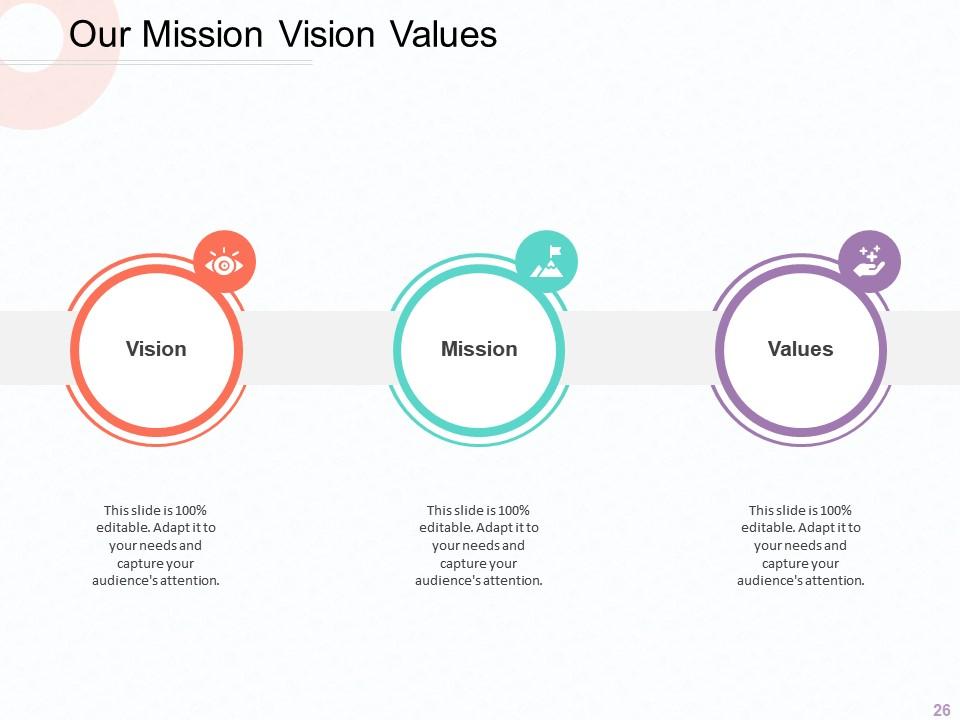
Slide 26: This slide showcases Our Mission, Vision, and Values with dedicated text boxes for each point.
Slide 27: This slide presents Our Goals with three icon-attached places for description.
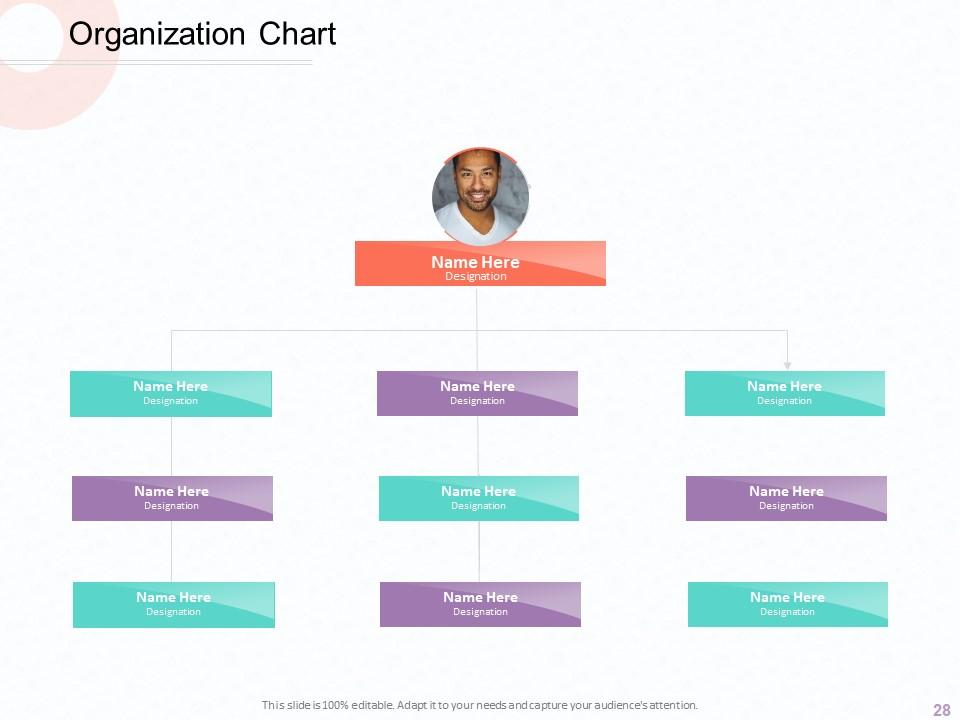
Slide 28: This slide shows the Organization Chart with your team's name and designation.
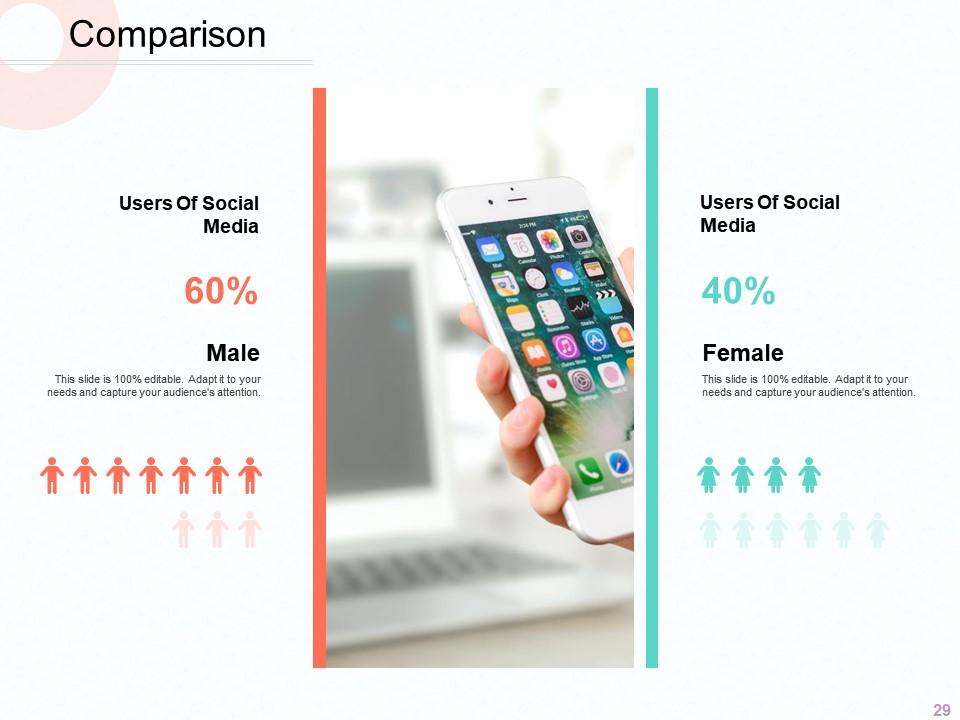
Slide 29: This slide displays the Comparison on a gender basis for users of social media.
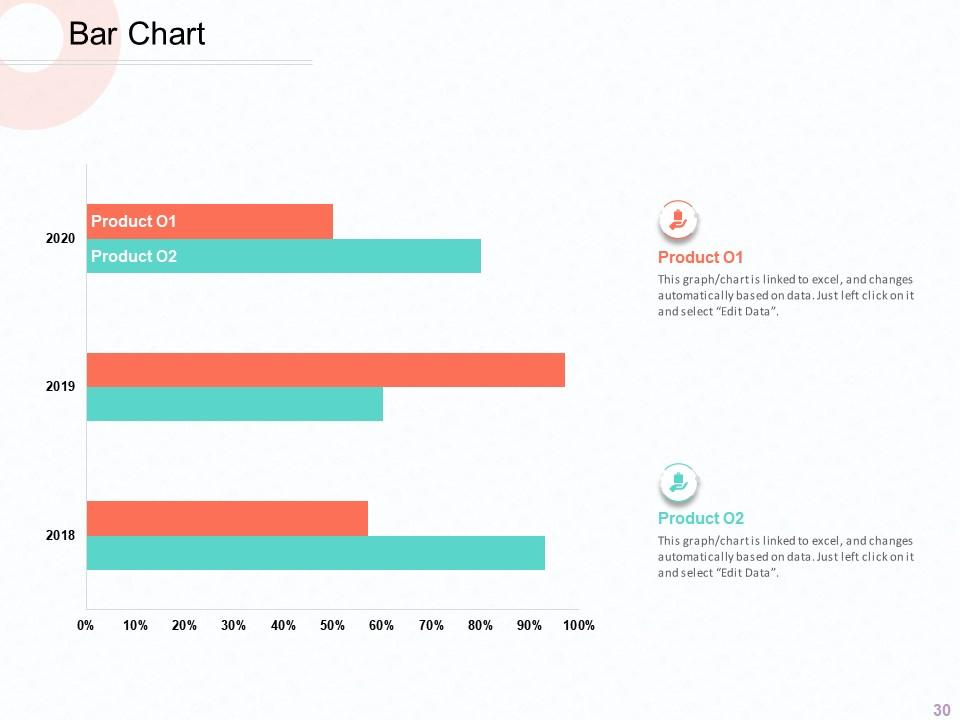
Slide 30: This slide showcases the stacked Bar Chart for two products and control products with description sections.
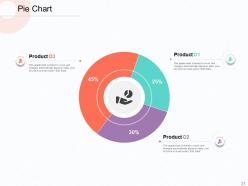
Slide 31: This slide presents a three-part Pie Chart that is linked to excel and changes automatically based on data. Just left-click on it and select “Edit Data”.
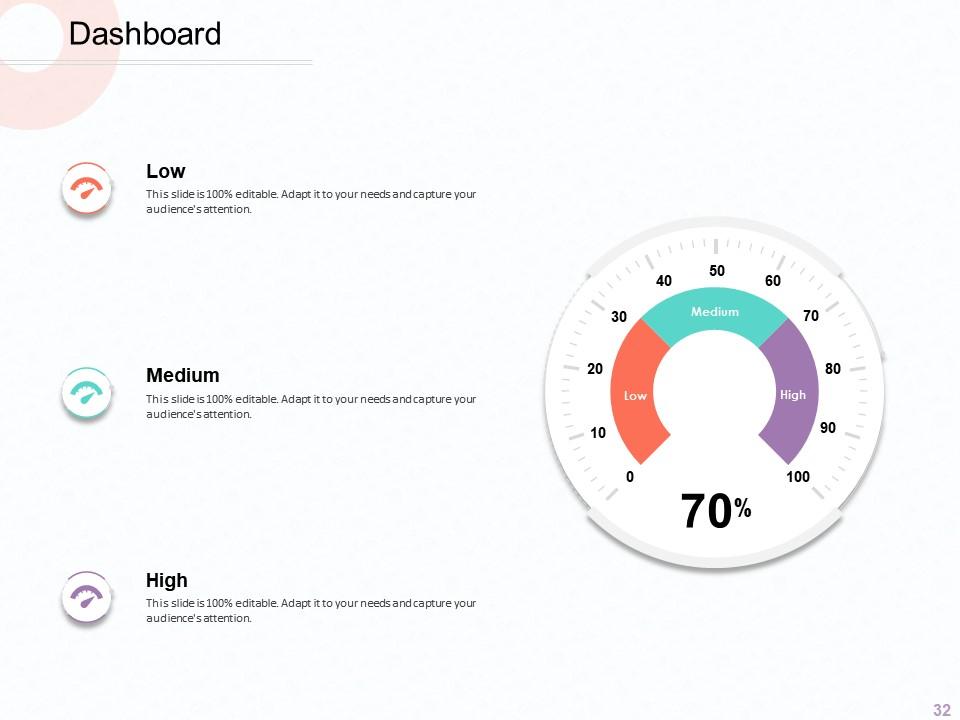
Slide 32: This slide shows the Dashboard with low, medium, and high with a circular meter for tracking percentages.
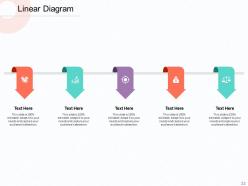
Slide 33: This slide displays a Linear Diagram with five stages, each with a distinct icon.
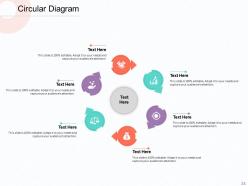
Slide 34: This slide showcases a Circular Diagram with six stages in a cyclical format.
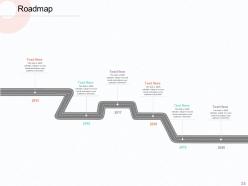
Slide 35: This slide presents a Roadmap for six years from 2015 to 2020 to track your progress.
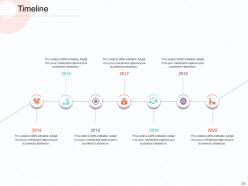
Slide 36: This slide shows the Timeline covering seven years from 2014 to 2020, each stage with a distinct icon.
Slide 37: This is the thank You slide with your company's Address, Contact Number, and Email Address.
Business Competition Strategies To Emerge As The Market Leader In Your Industry Complete Deck with all 37 slides:
Use our Business Competition Strategies To Emerge As The Market Leader In Your Industry Complete Deck to effectively help you save your valuable time. They are readymade to fit into any presentation structure.
-
Commendable slides with attractive designs. Extremely pleased with the fact that they are easy to modify. Great work!
-
Good research work and creative work done on every template.
-
Very unique and reliable designs.


