Asset lifecycle management process powerpoint presentation slides
Optimize the profits generated by your firm’s assets throughout their lifecycle with our Asset Lifecycle Management Process PowerPoint Presentation Slides. The predictive analysis PPT presentation provides multiple objectives of the asset management process like predictive analysis, low-cost procurement, and visual asset management; improving OEE and asset optimization. Using the optimizing lifecycle PPT display the tabular presentation of the company assets to be optimized along with location, cost of procurement, and annual maintenance cost. With this categorisation PowerPoint slideshow, you can calculate the replacement cost and use our lifecycle management process including steps like a requirement, procurement, maintenance, and deployment. Use the nine-step process for maintaining assets and mention the key performance indicators in our PowerPoint templates. The equipment lifecycle PPT presentation also includes multiple steps like retirement and proposal process and current disposal plan, gap analysis to calculate challenges, procurement process, and new equipment maintenance software to achieve the end goal. In the end, use the asset life PPT layout to measure the long-term performance of your company’s assets.
- Google Slides is a new FREE Presentation software from Google.
- All our content is 100% compatible with Google Slides.
- Just download our designs, and upload them to Google Slides and they will work automatically.
- Amaze your audience with SlideTeam and Google Slides.
-
Want Changes to This PPT Slide? Check out our Presentation Design Services
- WideScreen Aspect ratio is becoming a very popular format. When you download this product, the downloaded ZIP will contain this product in both standard and widescreen format.
-

- Some older products that we have may only be in standard format, but they can easily be converted to widescreen.
- To do this, please open the SlideTeam product in Powerpoint, and go to
- Design ( On the top bar) -> Page Setup -> and select "On-screen Show (16:9)” in the drop down for "Slides Sized for".
- The slide or theme will change to widescreen, and all graphics will adjust automatically. You can similarly convert our content to any other desired screen aspect ratio.
Compatible With Google Slides

Get This In WideScreen
You must be logged in to download this presentation.
PowerPoint presentation slides
Presenting our Asset Lifecycle Management Process PowerPoint Presentation Slides that are sure to impress executives, inspire team members, and other audiences. You can use the asset lifecycle PowerPoint design according to your company’s product information. We have used beautiful PowerPoint graphics, templates, icons, and diagrams. The content has been well researched by our excellent team of researchers. You can change the colour, fonts, texts, images without any hassle to suit your business needs. The PPT is available in both standard screen and widescreen aspect ratios. Download the presentation, enter your content in the placeholders, and present it with confidence!
Content of this Powerpoint Presentation
Slide 1: This title slide introduces the Asset Lifecycle Management Process. Add the name of your company here.
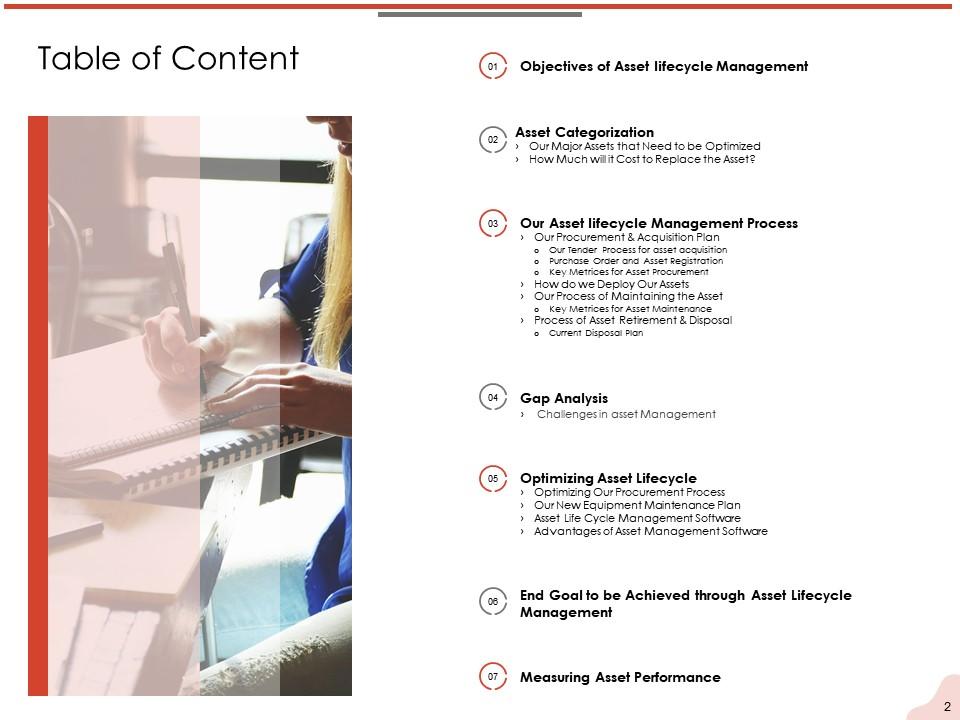
Slide 2: This slide contains the Table of Content. It includes: Objectives of Asset lifecycle Management, Asset Categorization, Our Asset lifecycle Management Process, Gap Analysis, Optimizing Asset Lifecycle, End Goal to be Achieved through Asset Lifecycle Management, and Measuring Asset Performance.
Slide 3: This is a table of content slide showing the Objectives of Asset lifecycle Management.
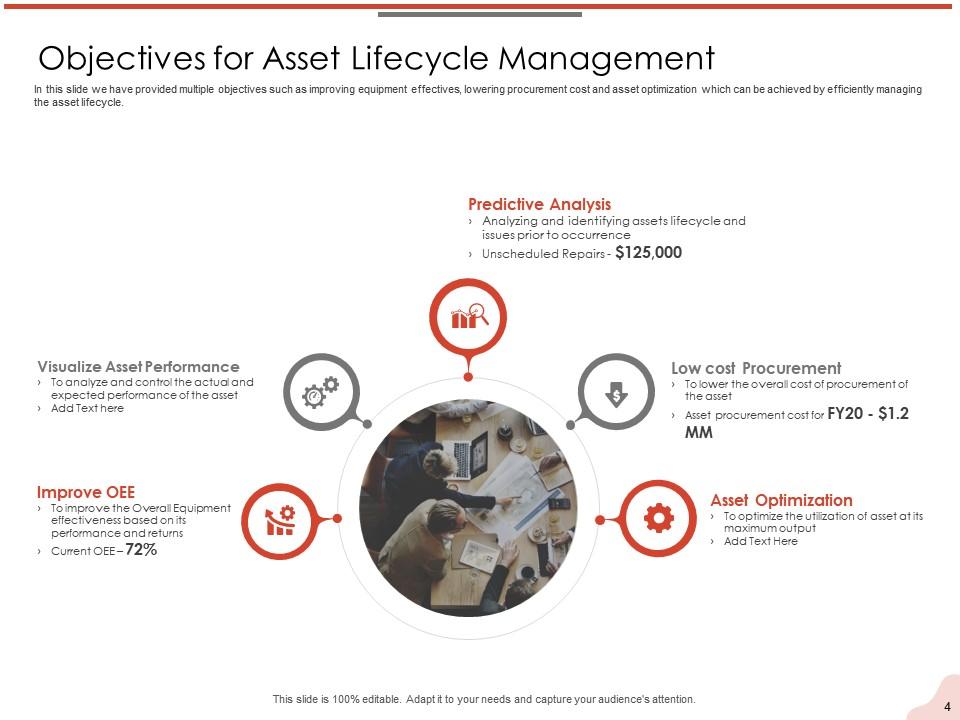
Slide 4: This slide presents the Objectives of Asset lifecycle Management. This includes: Improve OEE, Visualize Asset Performance, Predictive Analysis, Low-cost Procurement, and Asset Optimization.
Slide 5: This is a table of content slide showing Asset Categorization. This includes: Our Major Assets that Need to be Optimized and How Much Will it Cost to Replace the Asset?
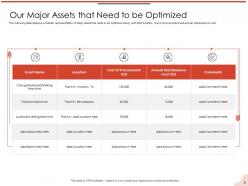
Slide 6: This slide presents Our Major Assets that Need to be Optimized. It displays a tabular representation of Major assets that need to be optimized along with their location, cost of procurement, and annual maintenance cost.
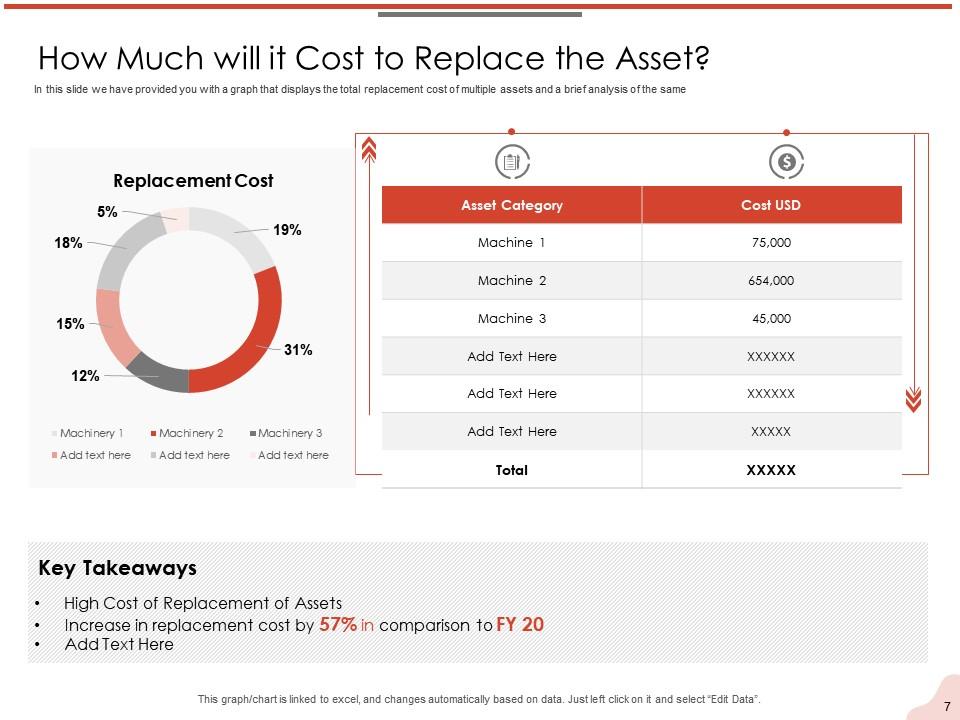
Slide 7: This slide presents How Much Will it Cost to Replace the Asset? It provides you with a graph that displays the total replacement cost of multiple assets and brief analysis of the same
Slide 8: This is a table of content slide showing Our Asset lifecycle Management Process. This includes: Our Procurement & Acquisition Plan, How do we Deploy Our Assets, Our Process of Maintaining the Asset, and Process of Asset Retirement & Disposal.
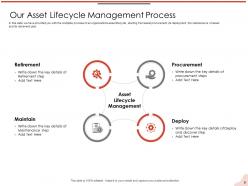
Slide 9: This slide presents Our Asset Lifecycle Management Process. It provides you with the complete process of an organization's asset lifecycle, starting from asset procurement, its deployment, the maintenance of assets, and its retirement plan.
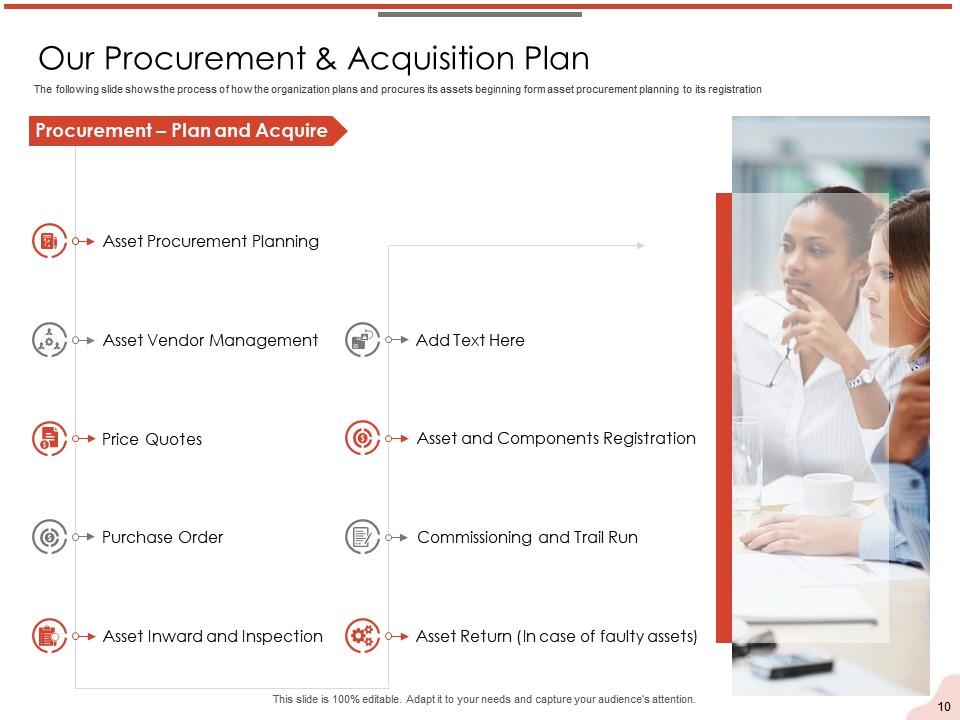
Slide 10: This slide presents Our Procurement & Acquisition Plan. It shows the process of how the organization plans and procures its assets beginning from asset procurement planning to its registration.
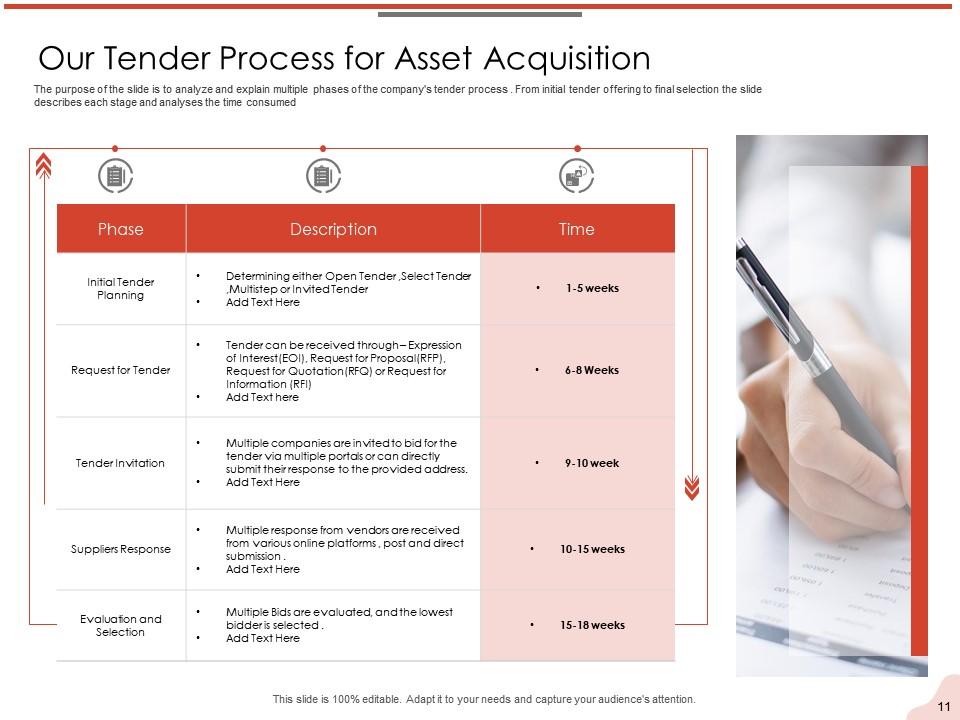
Slide 11: This slide presents Our Tender Process for Asset Acquisition. It analyzes and explains multiple phases of the company's tender process. From initial tender offering to final selection the slide describes each stage and analyses the time consumed.
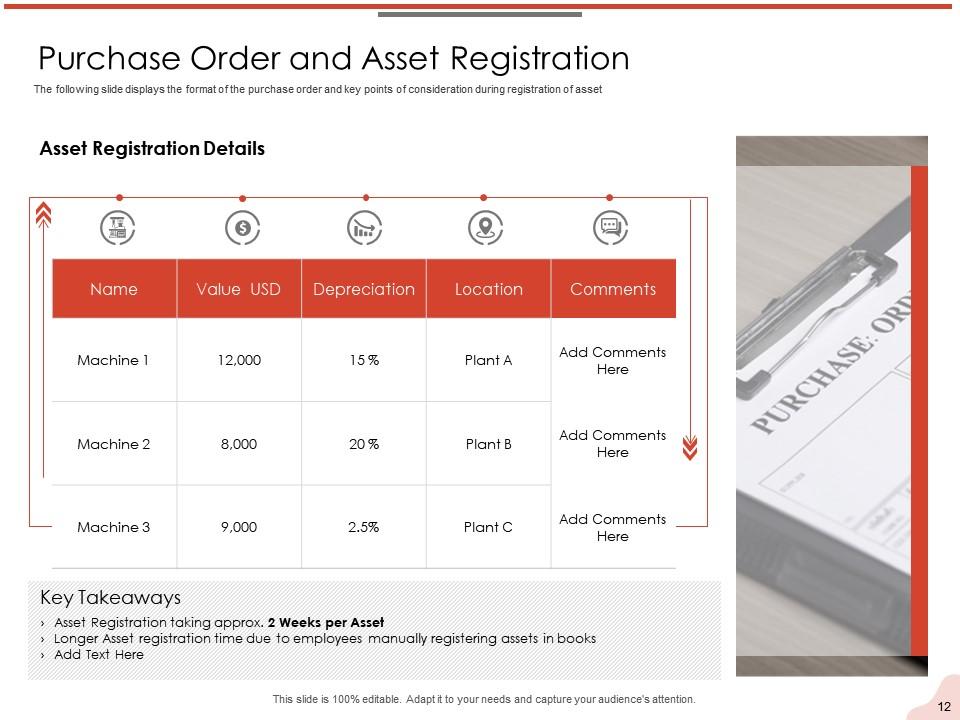
Slide 12: This slide presents the Purchase Order and Asset Registration. It analyzes and explains multiple phases of the company's tender process. From initial tender offering to final selection the slide describes each stage and analyses the time consumed.
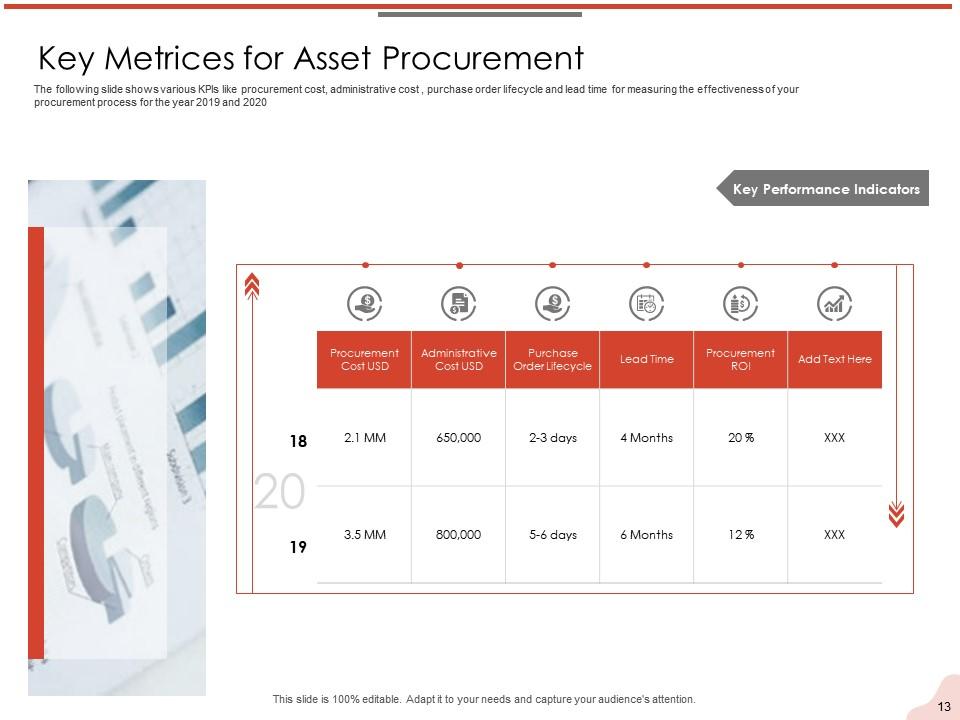
Slide 13: This slide presents the Key Metrics for Asset Procurement. It shows various KPIs like procurement cost, administrative cost, purchase order lifecycle, and lead time for measuring the effectiveness of your procurement process for the years 2019 and 2020.
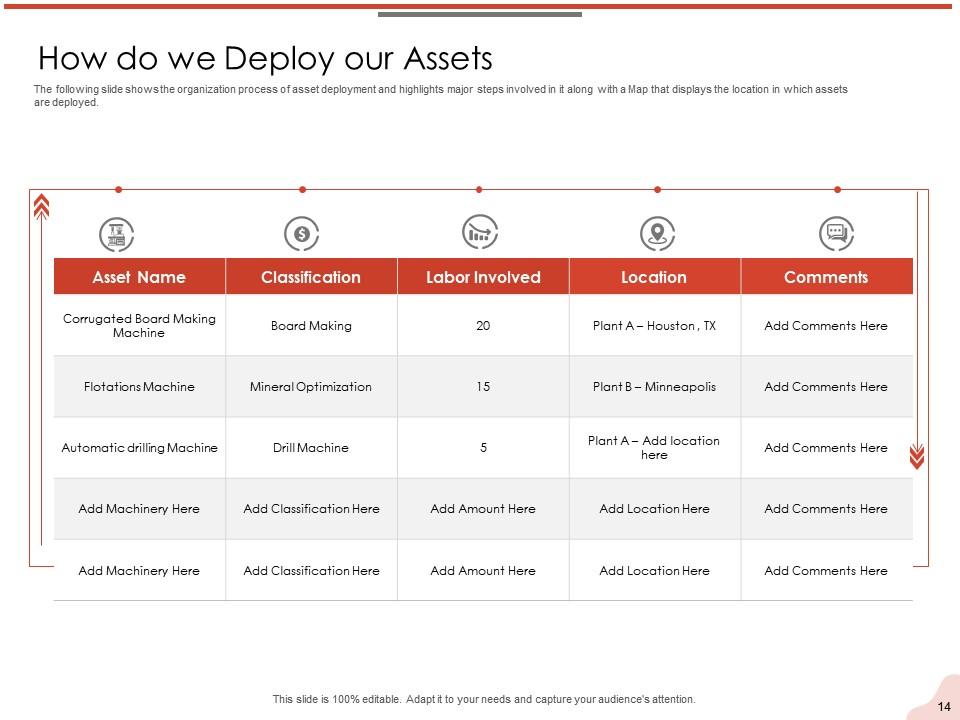
Slide 14: This slide presents How do we Deploy our Assets. It shows the organization process of asset deployment and highlights major steps involved in it along with a Map that displays the location in which assets are deployed.
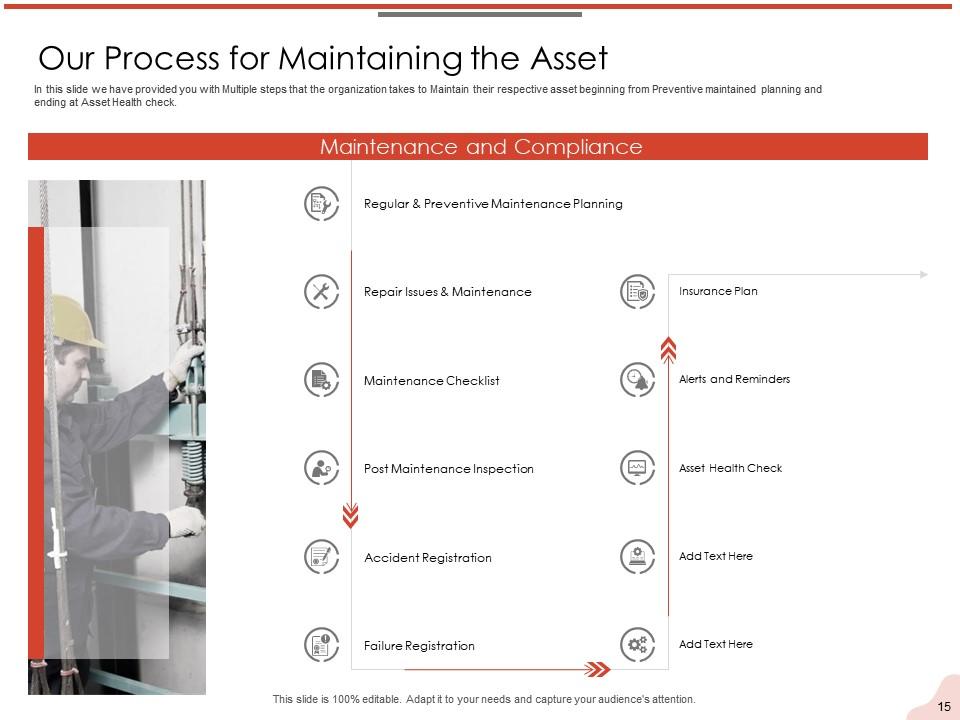
Slide 15: This slide presents Our Process for Maintaining the Asset. It provides you with multiple steps that the organization takes to Maintain their respective asset beginning with Preventive maintenance planning and ending at Asset Health check.
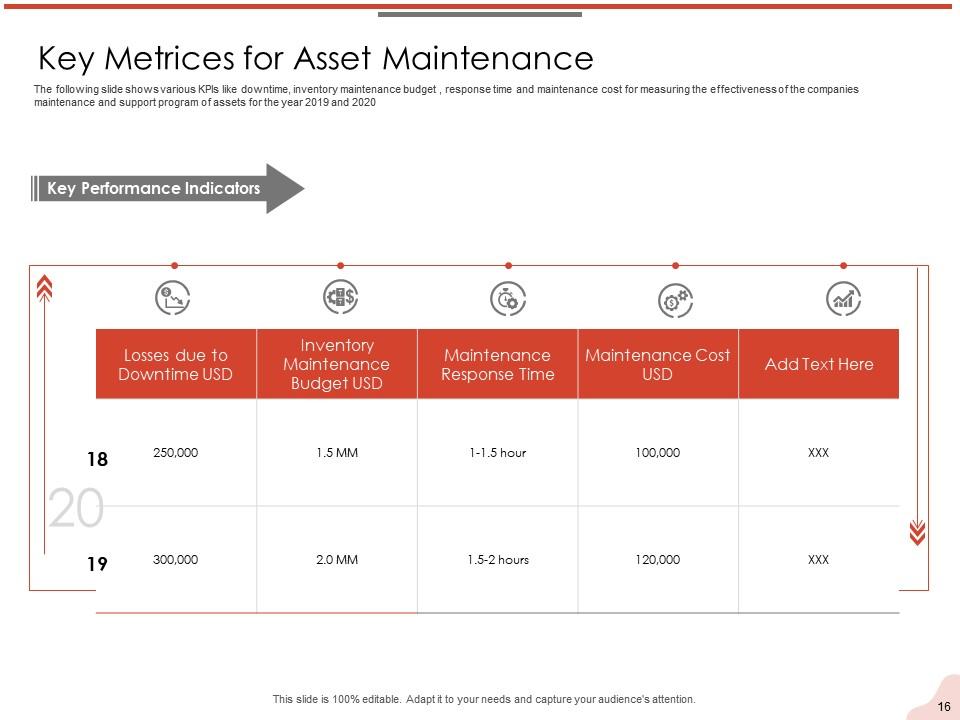
Slide 16: This slide presents the Key Metrics for Asset Maintenance. It shows the various KPIs like downtime, inventory maintenance budget, response time, and maintenance cost for measuring the effectiveness of the companies maintenance and support program of assets for the years 2019 and 2020
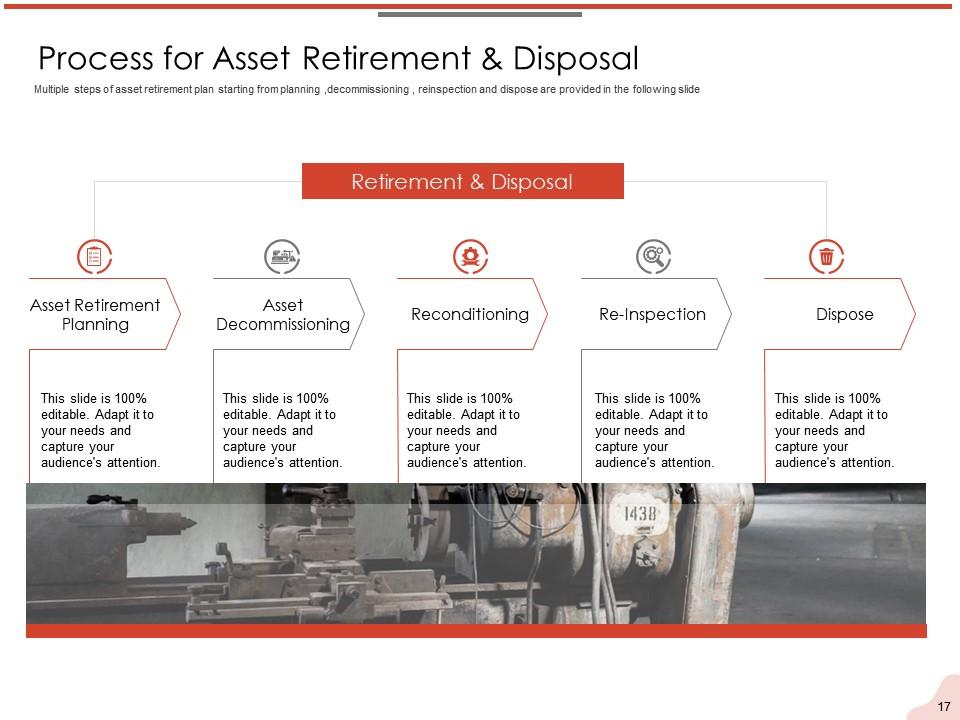
Slide 17: This slide presents the Process for Asset Retirement & Disposal. It shows the Multiple steps of asset retirement plan starting from planning, decommissioning, reinspection, and disposal are provided in the following slide.
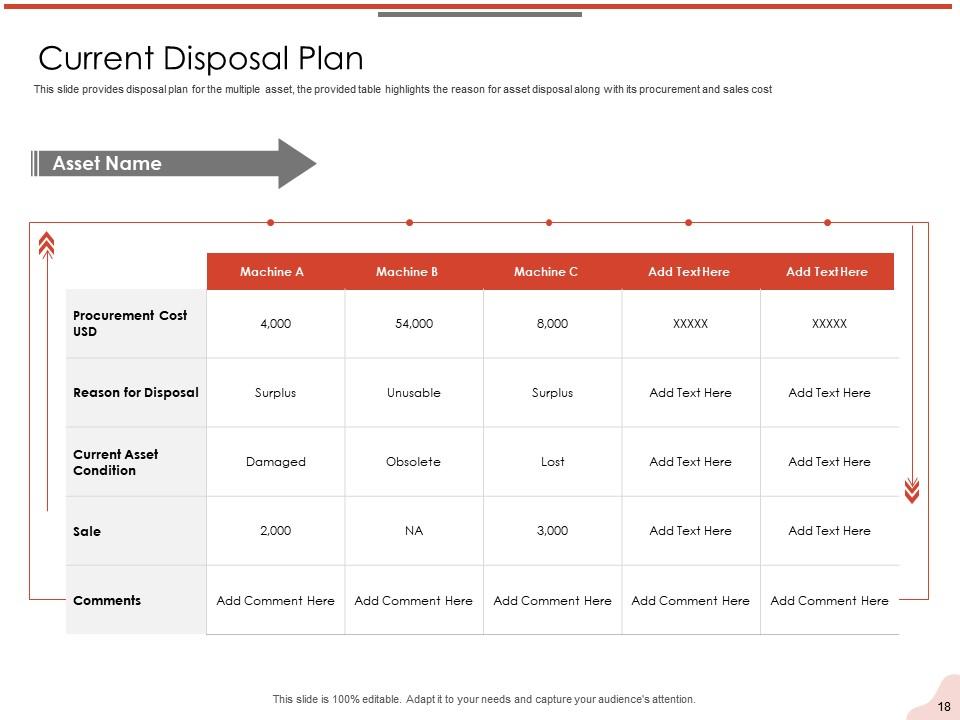
Slide 18: This slide presents the Current Disposal Plan. It provides the disposal plan for the multiple assets, the provided table highlights the reason for asset disposal along with its procurement and sales cost.
Slide 19: This is a table of content slide showing the Gap Analysis which includes Challenges in asset Management.
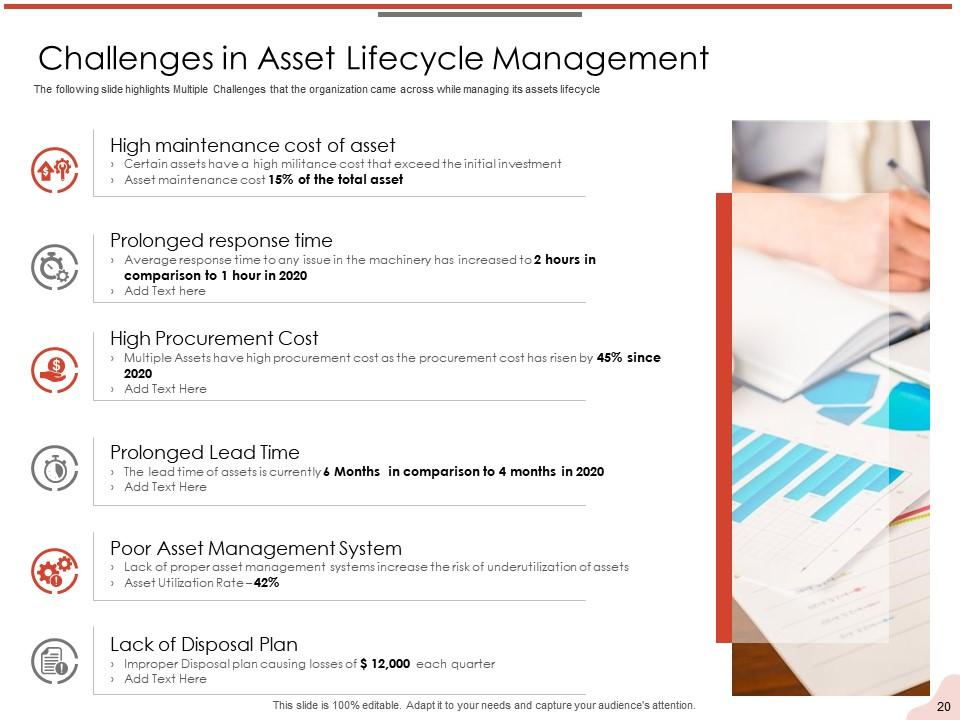
Slide 20: This slide presents the Challenges in Asset Lifecycle Management. It highlights Multiple Challenges that the organization came across while managing the lifecycle of its assets
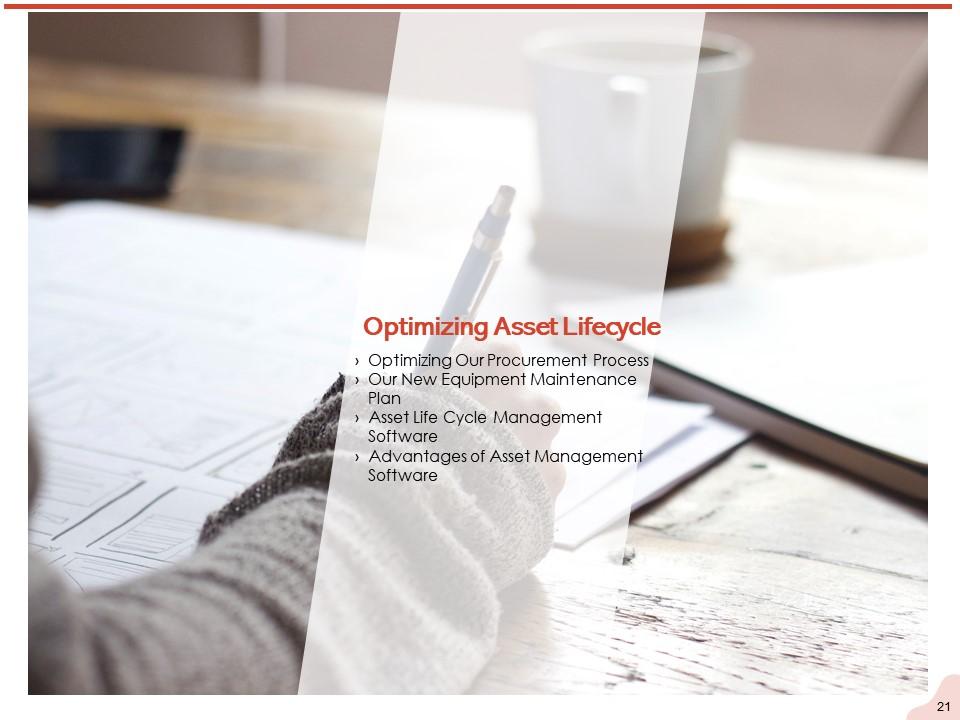
Slide 21: This is a table of content slide showing the Optimizing Asset Lifecycle. This includes: Optimizing Our Procurement Process, Our New Equipment Maintenance Plan, Asset Life Cycle Management Software, and Advantages of Asset Management Software.
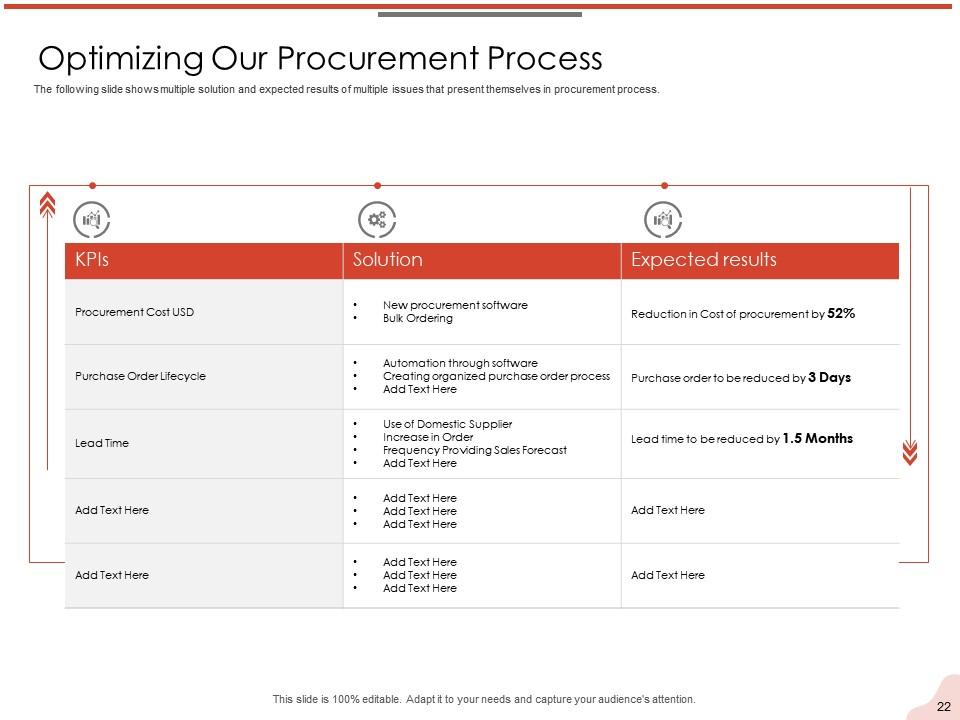
Slide 22: This slide presents Optimizing Our Procurement Process. It shows multiple solutions and expected results of multiple issues that present themselves in the procurement process.
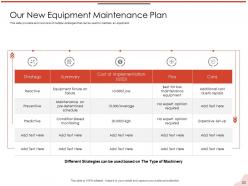
Slide 23: This slide presents Our New Equipment Maintenance Plan. It provides an overview of multiple strategies that can be used to maintain equipment.
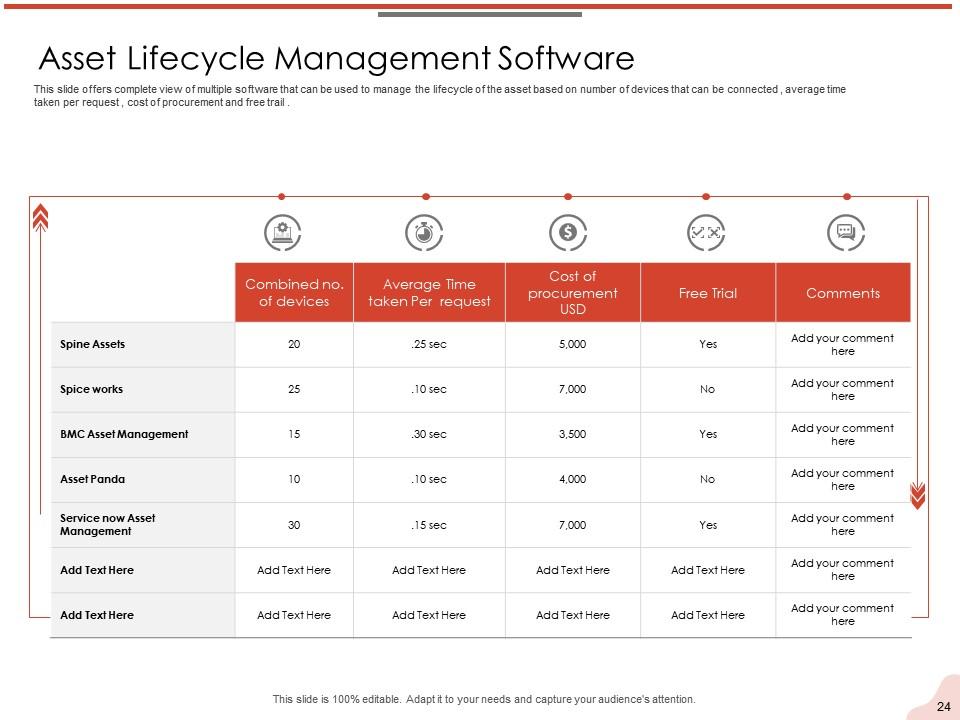
Slide 24: This slide presents the Asset Lifecycle Management Software. It offers a complete view of multiple software that can be used to manage the lifecycle of the asset based on the number of devices that can be connected, the average time is taken per request, cost of procurement, and free trial.
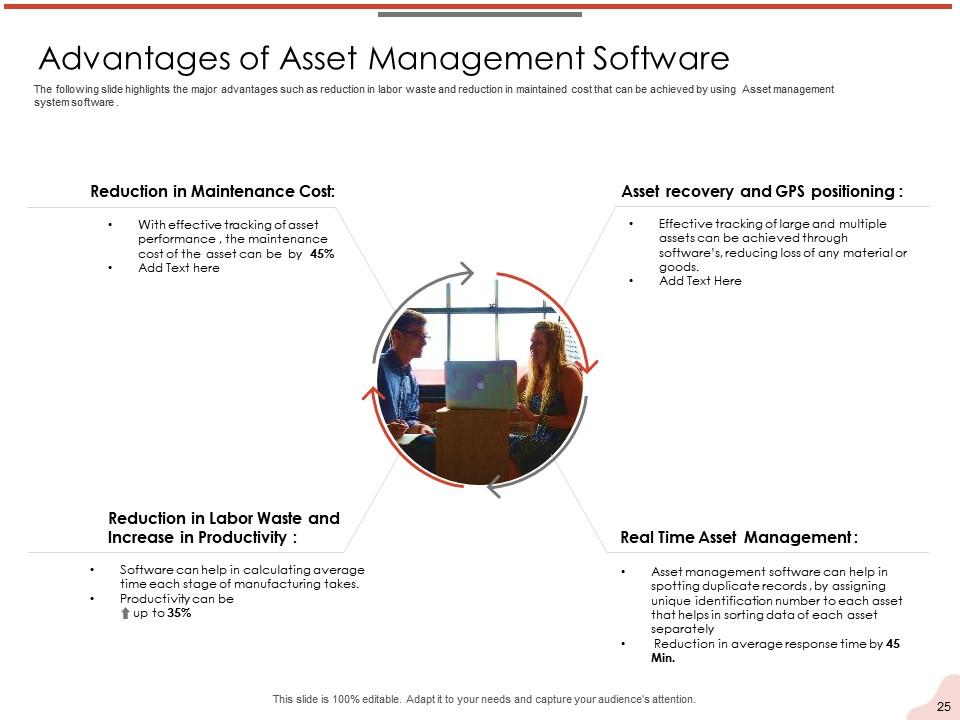
Slide 25: This slide presents the Advantages of Asset Management Software. It highlights the major advantages such as reduction in labor waste and reduction in maintained cost that can be achieved by using Asset management system software.
Slide 26: This is a table of content slide showing the End Goal to be Achieved through Asset Lifecycle Management.
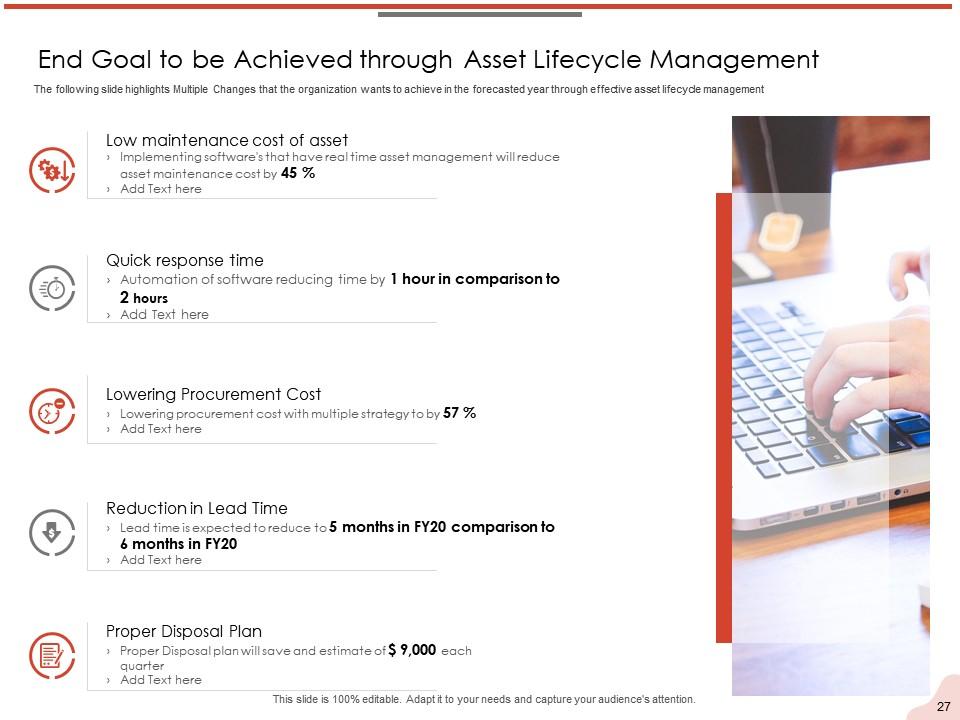
Slide 27: This slide presents the End Goal to be Achieved through Asset Lifecycle Management. It highlights Multiple Changes that the organization wants to achieve in the forecasted year through effective asset lifecycle management.
Slide 28: This is a table of content slide showing the Measuring Asset Performance.
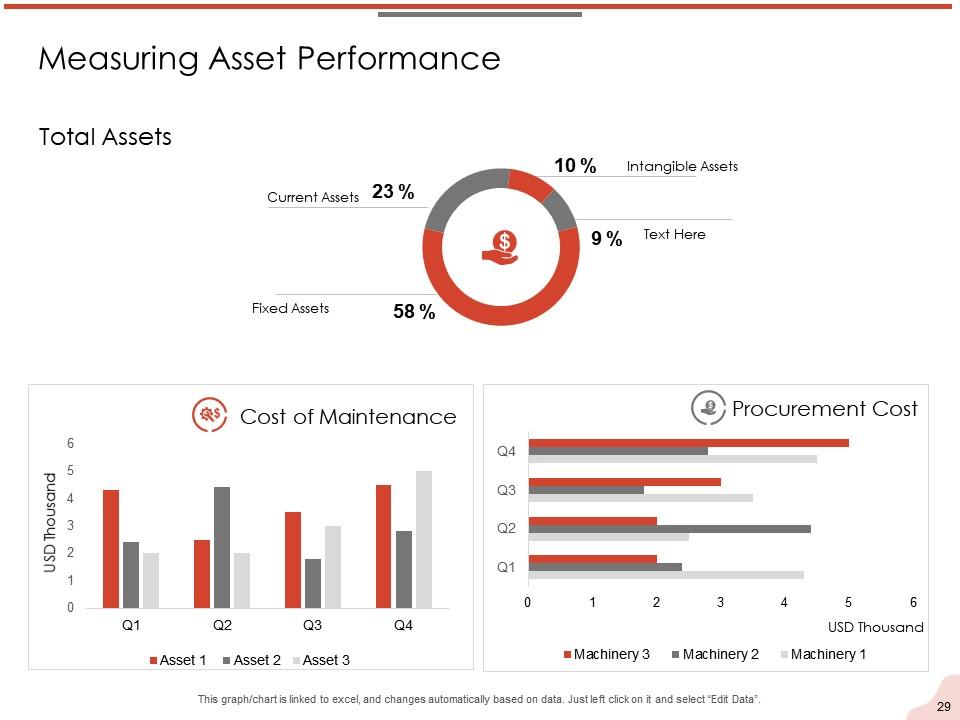
Slide 29: This slide presents the Measuring Asset Performance. It shows concepts like the cost of maintenance, procurement cost, and total assets.
Slide 30: This slide contains the Asset Lifecycle Management Process Icons for you to choose from.
Slide 31: This slide introduces the Additional Slides.
Slide 32: This is a table of content slide showing Managing Change in Asset Lifecycle Management
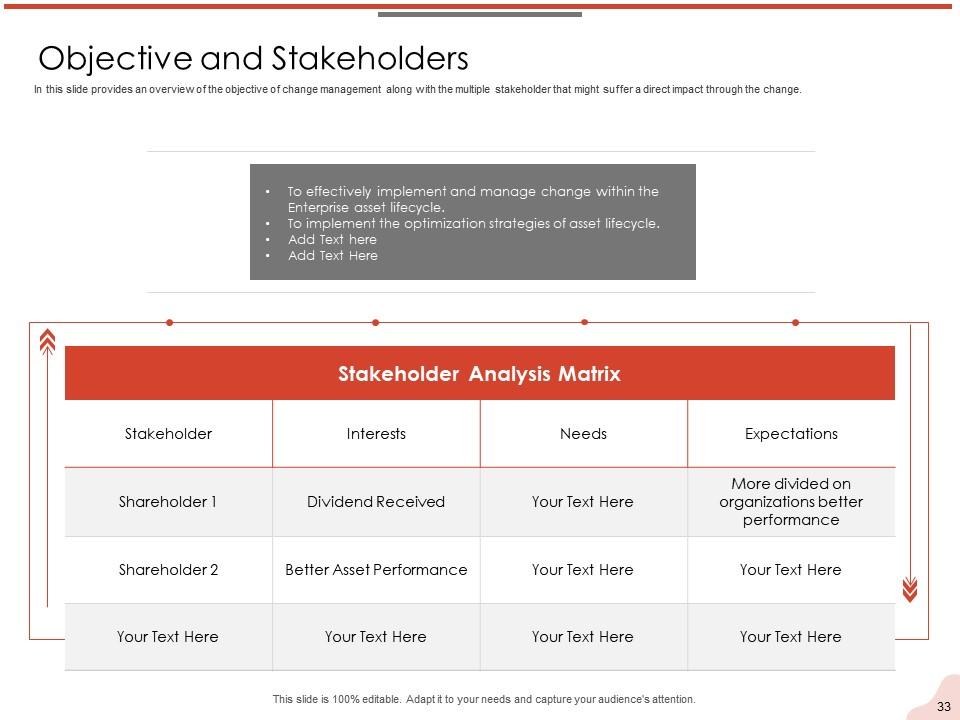
Slide 33: This slide presents the Objectives and Stakeholders. It provides an overview of the objective of change management along with the multiple stakeholders that might suffer a direct impact through the change.
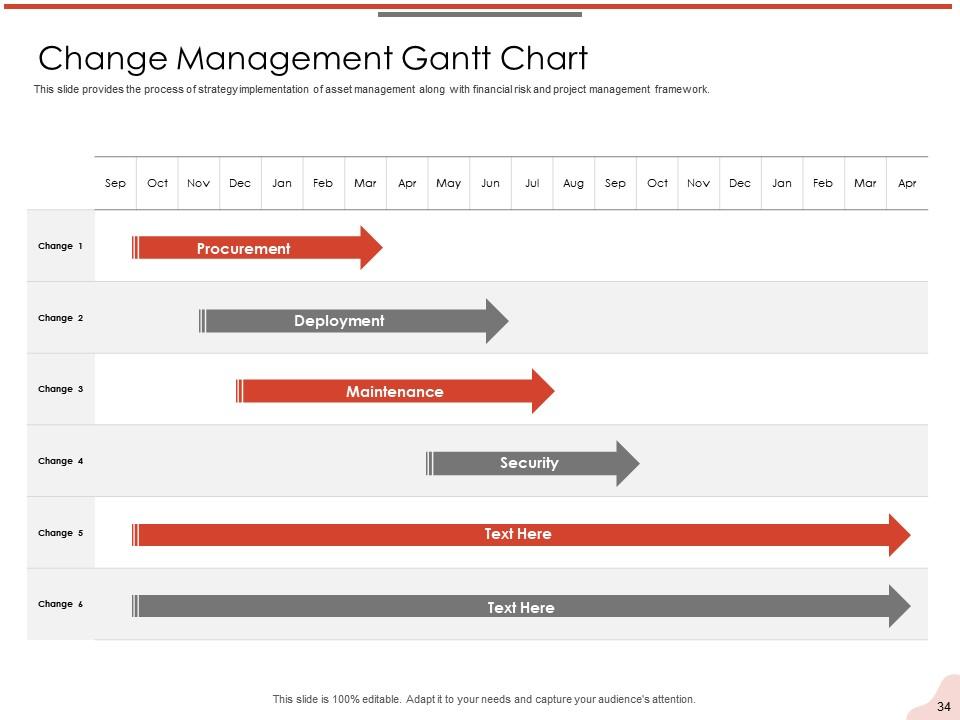
Slide 34: This slide presents the Change Management Gantt Chart. It provides the process of strategy implementation of asset management along with financial risk and project management framework.
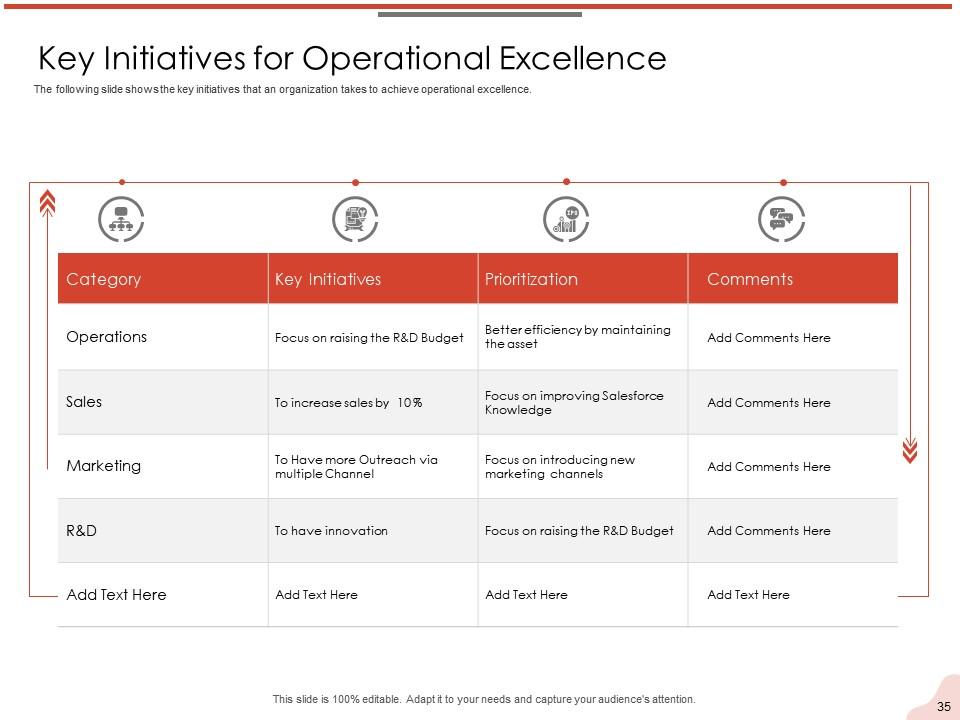
Slide 35: This slide presents the Key Initiatives for Operational Excellence. It shows the key initiatives that an organization takes to achieve operational excellence.
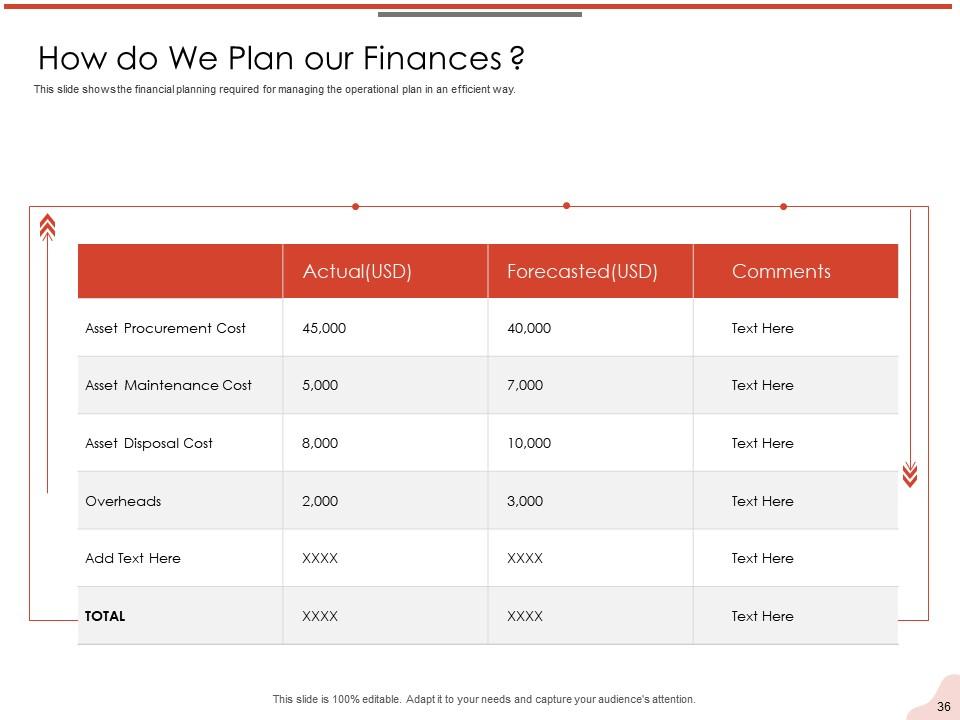
Slide 36: This slide presents the How do We Plan our Finances? It shows the financial planning required for managing the operational plan in an efficient way.
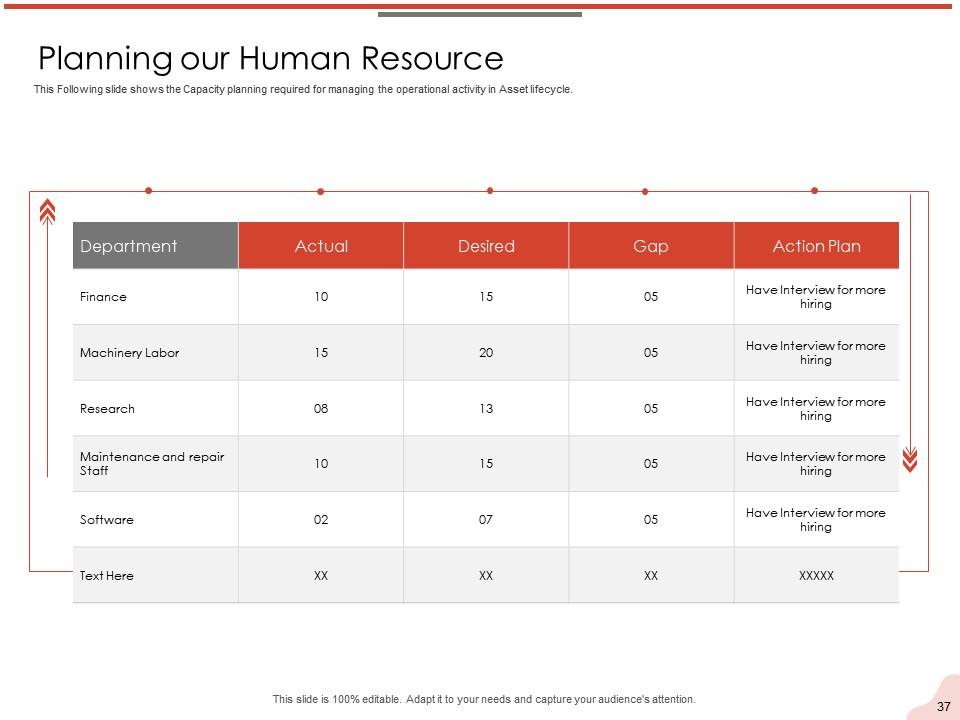
Slide 37: This slide presents the Planning our Human Resource. It shows the Capacity planning required for managing the operational activity in the Asset lifecycle.
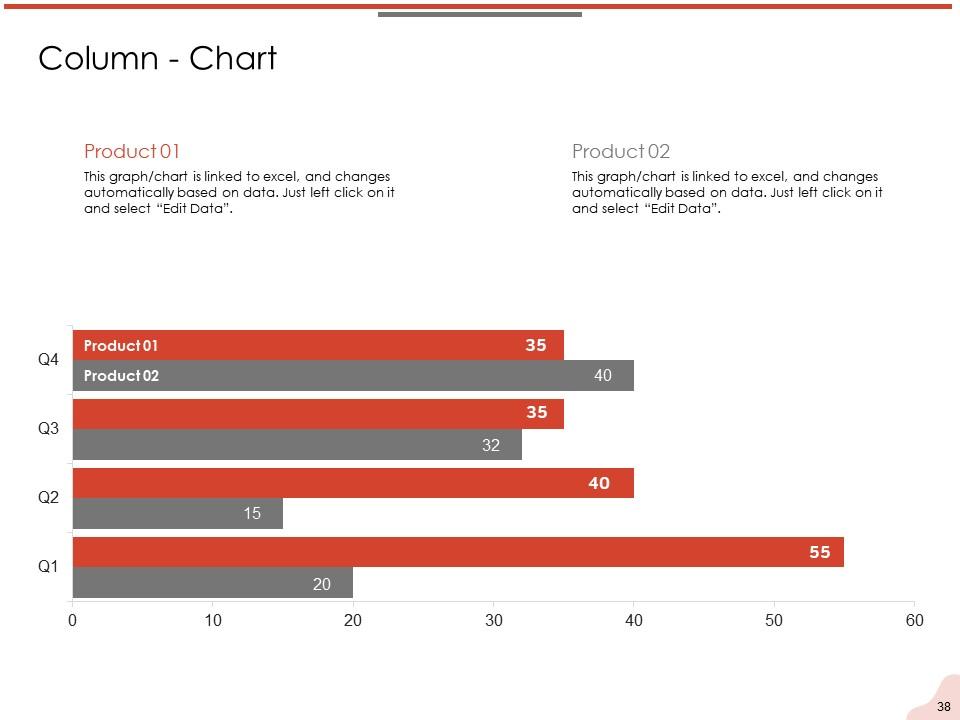
Slide 38: This slide shows a Column - Chart that compares 2 products’ data over a timeline of financial quarters for one year.
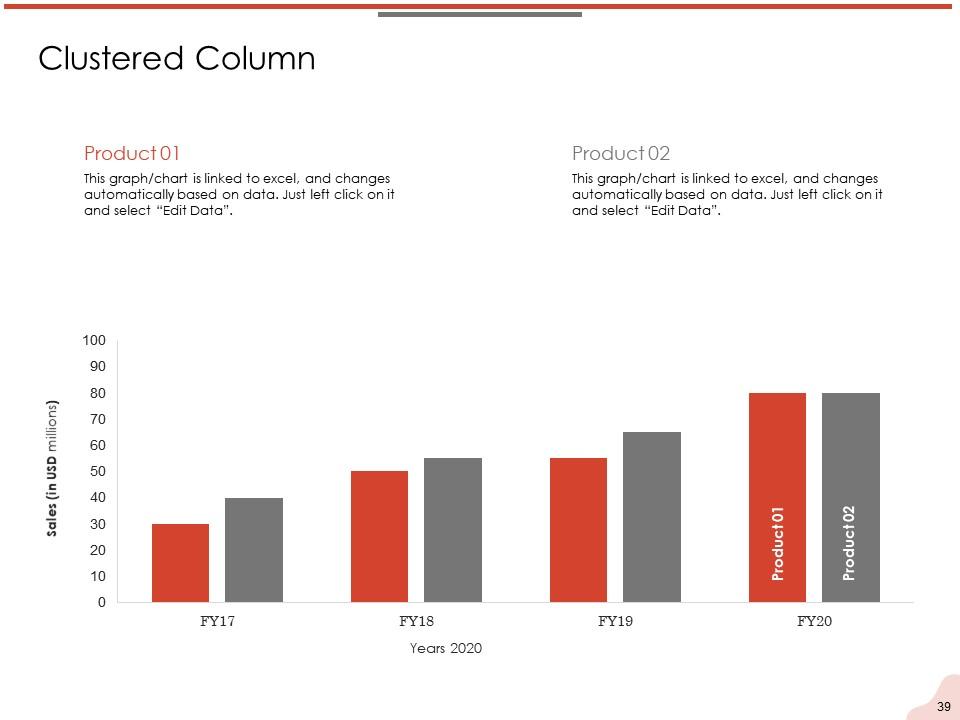
Slide 39: Clustered Column This slide shows a bar graph that compares 2 products’ sales over a timeline of financial years.
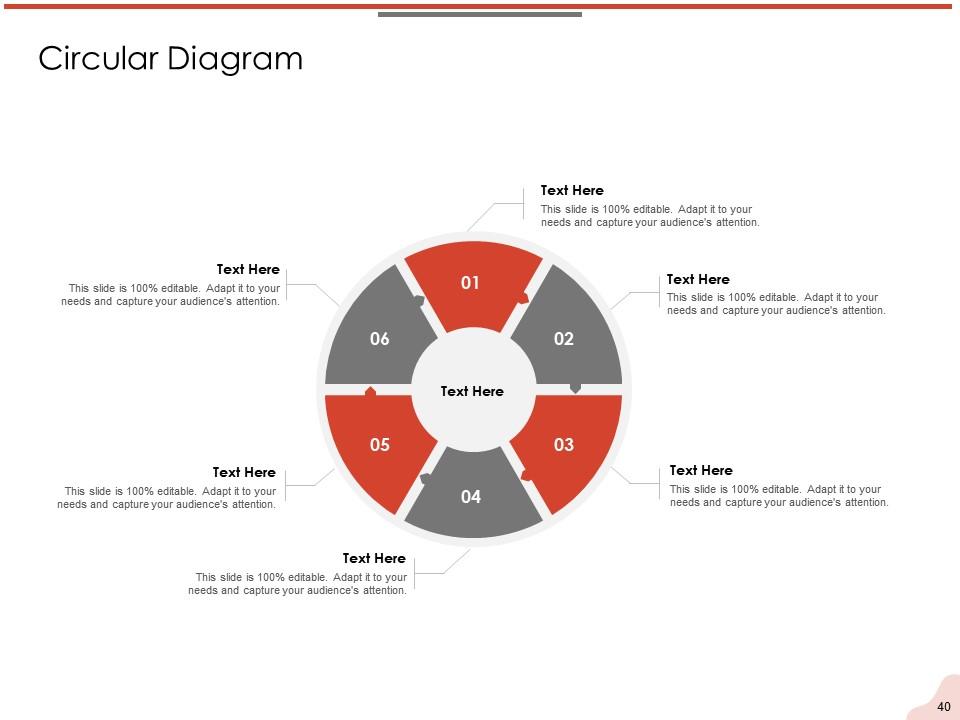
Slide 40: This slide presents a Circular Diagram to showcase the elements of a concept or project.
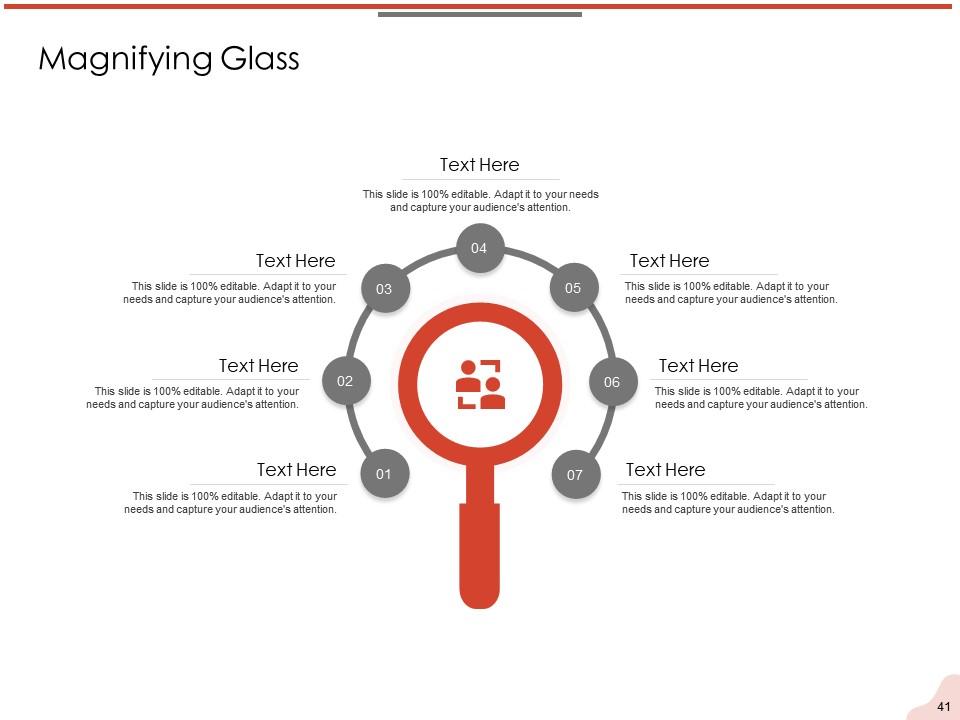
Slide 41: This slide presents a MAGNIFYING GLASS to give more details about the individual steps in a project.
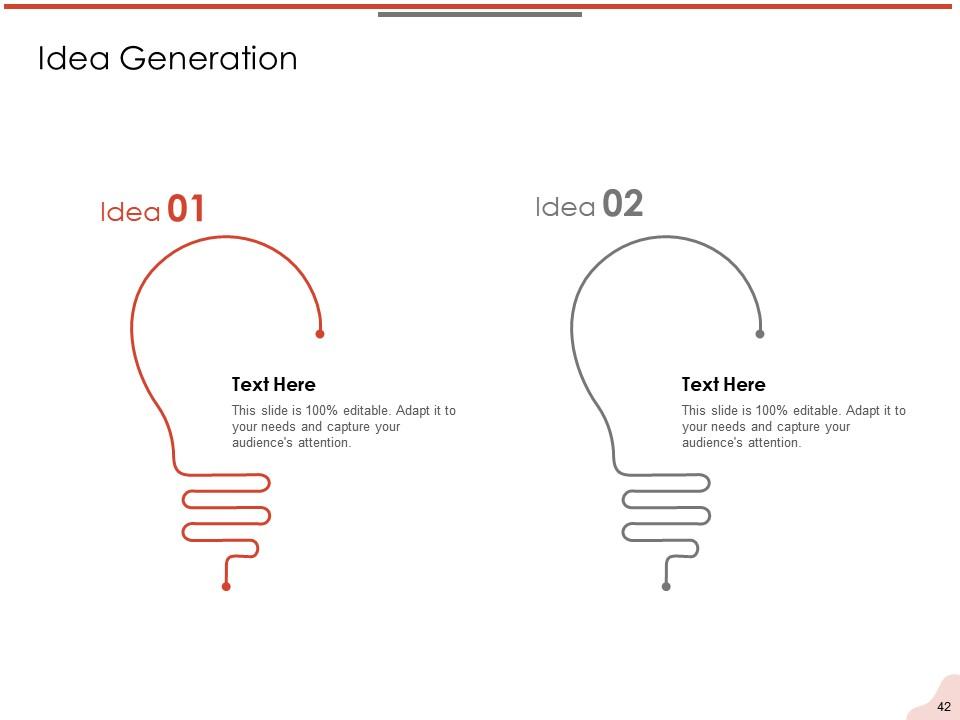
Slide 42: This slide presents Idea Generation to heklp in brainstorming sessions.
Slide 43: This slide provides a Venn diagram that can be used to show interconnectedness and overlap between various departments, projects, etc.
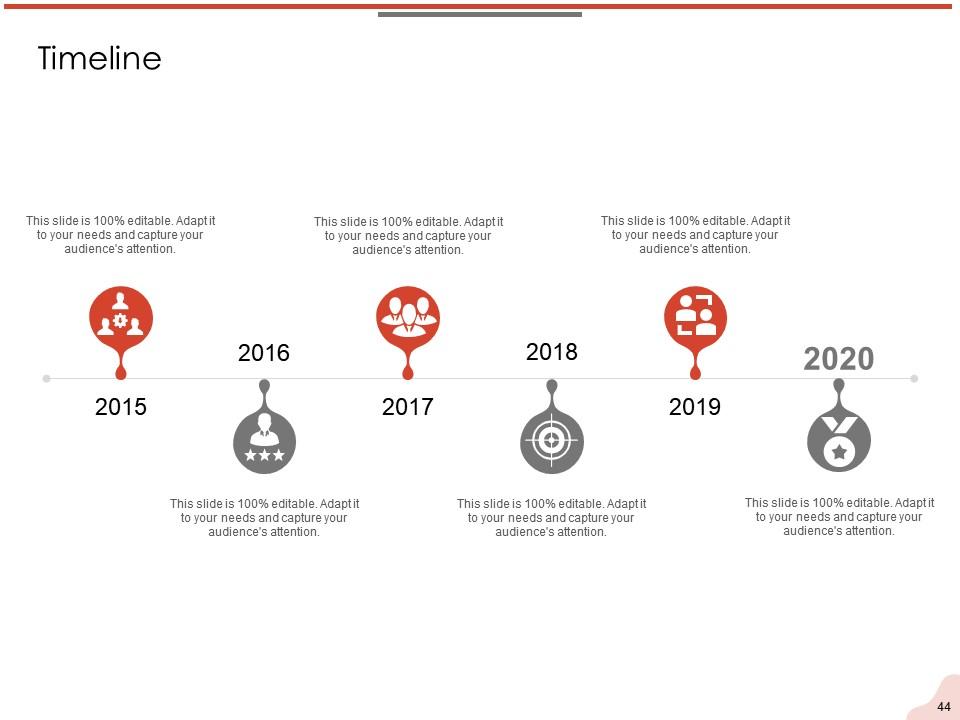
Slide 44: This slide is a Timeline template to showcase the progress of the steps of a project with time.
Slide 45: This slide contains Important Notes that can be used to express any brief thoughts or ideas.
Slide 46: This is a Thank You slide where details such as the address, contact number, email address are added.
Asset lifecycle management process powerpoint presentation slides with all 46 slides:
Use our Asset Lifecycle Management Process Powerpoint Presentation Slides to effectively help you save your valuable time. They are readymade to fit into any presentation structure.
No Reviews


