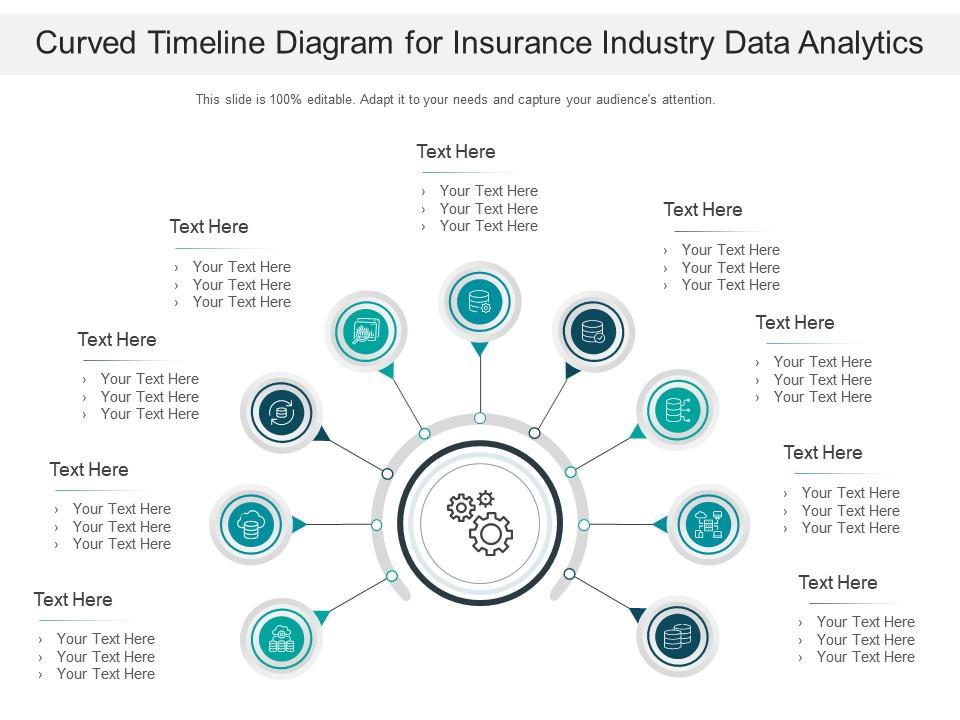
Curved timeline diagram for insurance industry data analytics infographic template
A curved timeline diagram is a visual way of representing temporal data. In the insurance industry, temporal data can include anything from when a policy was issued to when a claim was filed. By using a curved timeline diagram, analysts can easily identify patterns and trends in the data. This can help them make better decisions about how to run their business. The data analytics ppt templates we’ve provided are a great starting point to help you visualize your insurance industry data. With these templates, you can quickly and easily create amazing curved timeline diagram infographics that will give your audience a deep understanding of your data. So what are you waiting for? Grab these templates now and start creating beautiful, informative infographics today.
- Google Slides is a new FREE Presentation software from Google.
- All our content is 100% compatible with Google Slides.
- Just download our designs, and upload them to Google Slides and they will work automatically.
- Amaze your audience with SlideTeam and Google Slides.
-
Want Changes to This PPT Slide? Check out our Presentation Design Services
- WideScreen Aspect ratio is becoming a very popular format. When you download this product, the downloaded ZIP will contain this product in both standard and widescreen format.
-

- Some older products that we have may only be in standard format, but they can easily be converted to widescreen.
- To do this, please open the SlideTeam product in Powerpoint, and go to
- Design ( On the top bar) -> Page Setup -> and select "On-screen Show (16:9)” in the drop down for "Slides Sized for".
- The slide or theme will change to widescreen, and all graphics will adjust automatically. You can similarly convert our content to any other desired screen aspect ratio.
Compatible With Google Slides

Get This In WideScreen
You must be logged in to download this presentation.
PowerPoint presentation slides
This is a single slide titled Curved Timeline Diagram For Insurance Industry Data Analytics Infographic Template. It is crafted using high quality vector based visuals that are 100 percent editable and available for immediate download in standard and widescreen aspect ratios.
Curved timeline diagram for insurance industry data analytics infographic template with all 2 slides:
Use our Curved Timeline Diagram For Insurance Industry Data Analytics Infographic Template to effectively help you save your valuable time. They are readymade to fit into any presentation structure.
-
Very unique, user-friendly presentation interface.
-
Design layout is very impressive.
-
Much better than the original! Thanks for the quick turnaround.
-
Excellent template with unique design.
-
Thanks for all your great templates they have saved me lots of time and accelerate my presentations. Great product, keep them up!
-
Great experience, I would definitely use your services further.
-
Very unique and reliable designs.
-
Excellent design and quick turnaround.
-
Appreciate the research and its presentable format.


