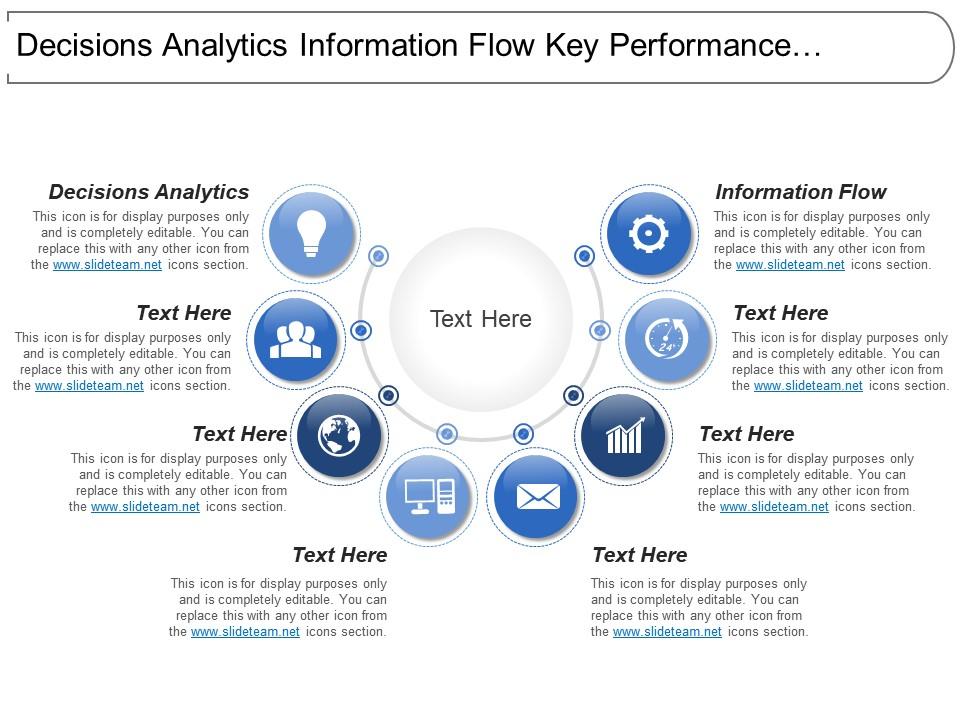
71127684 style circular semi 8 piece powerpoint presentation diagram infographic slide
Analyze the interaction between different forces with our Decisions Analytics Information Flow Key Performance Indicators Metrics. Be able to assess the interplay.
- Google Slides is a new FREE Presentation software from Google.
- All our content is 100% compatible with Google Slides.
- Just download our designs, and upload them to Google Slides and they will work automatically.
- Amaze your audience with SlideTeam and Google Slides.
-
Want Changes to This PPT Slide? Check out our Presentation Design Services
- WideScreen Aspect ratio is becoming a very popular format. When you download this product, the downloaded ZIP will contain this product in both standard and widescreen format.
-

- Some older products that we have may only be in standard format, but they can easily be converted to widescreen.
- To do this, please open the SlideTeam product in Powerpoint, and go to
- Design ( On the top bar) -> Page Setup -> and select "On-screen Show (16:9)” in the drop down for "Slides Sized for".
- The slide or theme will change to widescreen, and all graphics will adjust automatically. You can similarly convert our content to any other desired screen aspect ratio.
Compatible With Google Slides

Get This In WideScreen
You must be logged in to download this presentation.
PowerPoint presentation slides
Presenting this set of slides with name - Decisions Analytics Information Flow Key Performance Indicators Metrics. This is an editable eight stages graphic that deals with topics like Decisions Analytics, Information Flow, Key Performance Indicators Metrics to help convey your message better graphically. This product is a premium product available for immediate download, and is 100 percent editable in Powerpoint. Download this now and use it in your presentations to impress your audience.
71127684 style circular semi 8 piece powerpoint presentation diagram infographic slide with all 5 slides:
Our Decisions Analytics Information Flow Key Performance Indicators Metrics bring about change effectively. They ensure it is acceptable to all.
-
Great product with effective design. Helped a lot in our corporate presentations. Easy to edit and stunning visuals.
-
Awesome use of colors and designs in product templates.


