Impressive Collection of Decline Concept PPT Templates
-
 25649484 style concepts 1 decline 5 piece powerpoint presentation diagram infographic slide
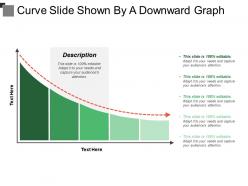
Presenting this set of slides with name - Curve Slide Shown By A Downward Graph. This is a five stage process. The stages in this process are Curve Slide, Spiral, Spring.
-
 51678101 style concepts 1 decline 8 piece powerpoint presentation diagram infographic slide
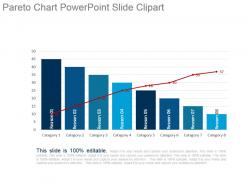
Presenting pareto chart powerpoint slide clipart. This is a pareto chart powerpoint slide clipart. This is a eight stage process. The stages in this process are category, reason.
-
 27333821 style concepts 1 decline 5 piece powerpoint presentation diagram infographic slide
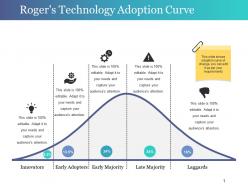
Presenting roger s technology adoption curve powerpoint slide background designs. This is a roger s technology adoption curve powerpoint slide background designs. This is a five stage process. The stages in this process are innovators, early adopters, early majority, late majority, laggards.
-
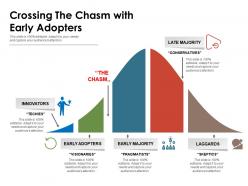 Crossing the chasm with early adopters
Presenting this set of slides with name Crossing The Chasm With Early Adopters. This is a five stage process. The stages in this process are Innovators, Early Majority, Laggards, Early Adopters, Late Majority. This is a completely editable PowerPoint presentation and is available for immediate download. Download now and impress your audience.
-
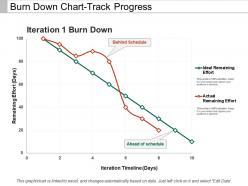 995996 style concepts 1 decline 2 piece powerpoint presentation diagram infographic slide
Presenting this set of slides with name - Burn Down Chart-Track Progress. This is a two stage process. The stages in this process are Burn Down Chart, Agile Software Development Chart, Run Chart.
-
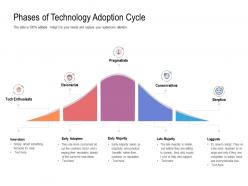 Phases of technology adoption cycle
Presenting this set of slides with name Phases Of Technology Adoption Cycle. This is a five stage process. The stages in this process are Innovators, Early Adopters, Early Majority, Late Majority, Laggards. This is a completely editable PowerPoint presentation and is available for immediate download. Download now and impress your audience.
-
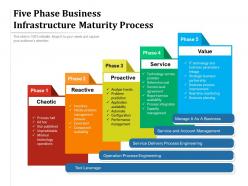 Five phase business infrastructure maturity process
Presenting this set of slides with name Five Phase Business Infrastructure Maturity Process. This is a five stage process. The stages in this process are Proactive, Service, Value. This is a completely editable PowerPoint presentation and is available for immediate download. Download now and impress your audience.
-
 53286540 style concepts 1 decline 1 piece powerpoint presentation diagram infographic slide
We are proud to present our mobile with bar graph and pie graph flat powerpoint design. This power point template diagram has been crafted with graphic of mobile and bar graph This PPT diagram contains the concept of data analysis. Use this PPT diagram for business and marketing related presentations.
-
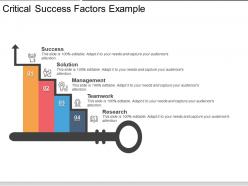 93242866 style concepts 1 decline 4 piece powerpoint presentation diagram infographic slide
Presenting critical success factors example PPT examples. PPT allows full editing. Modify the design as per your customized business needs. Change the design layout, structure by editing font type, color, size, shape, style, background etc. PPT can be opened with Google Slides and PowerPoint. You can view the design on normal and wide screen view. Instant and swift downloading available. Download the design into JPEG and PDF formats.
-
 92078617 style concepts 1 decline 1 piece powerpoint presentation diagram infographic slide
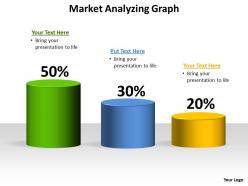
This template is skillfully designed and is completely editable to suit all the needs and requirements of the user. The color of the font, its size, style, and all other elements can be customized according to the user's desire The text in the PPT placeholder can be replaced with the desired information making this template highly flexible and adaptable as well. This template is also compatible with various Microsoft versions and formats like Google Slides, JPG, PDF, etc so the user will face no issue in saving it in the format of his choice.
-
 51174084 style concepts 1 decline 1 piece powerpoint presentation diagram infographic slide
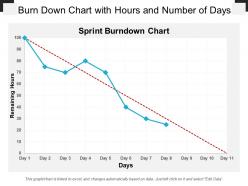
Presenting this set of slides with name - Burn Down Chart With Hours And Number Of Days. This is a one stage process. The stages in this process are Burn Down Chart, Agile Software Development Chart, Run Chart.
-
 97466534 style concepts 1 decline 4 piece powerpoint presentation diagram infographic slide
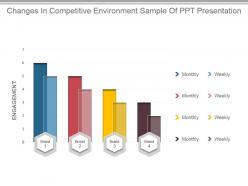
Presenting changes in competitive environment sample of ppt presentation. Presenting changes in competitive environment sample of ppt presentation. Presenting changes in competitive environment sample of ppt presentation. This is a changes in competitive environment sample of ppt presentation. This is four stage process. The stages in this process are engagement, monthly, brand, weekly.
-
 Life cycle of technology adoption
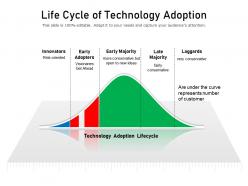
Presenting this set of slides with name Life Cycle Of Technology Adoption. This is a five stage process. The stages in this process are Innovators, Technology, Lifecycle, Early Majority, Laggards. This is a completely editable PowerPoint presentation and is available for immediate download. Download now and impress your audience.
-
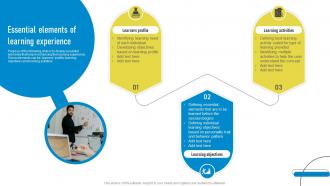 Essential Elements Of Learning Experience Playbook For Innovation Learning
The following slide presents a framework to formulate strategy for team or business. It highlights key questions to consider key fundamental choices such as what are our aspirations and goals, where do we play, how do we create value, etc. Introducing Essential Elements Of Learning Experience Playbook For Innovation Learning to increase your presentation threshold. Encompassed with five stages, this template is a great option to educate and entice your audience. Dispence information on Learners Profile, Learning Activities, Learning Objectives, using this template. Grab it now to reap its full benefits.
-
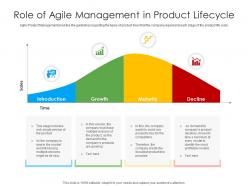 Role of agile management in product lifecycle
Agile Product Management provides the guidelines regarding the types of product lines that the company required at each stage of the product life cycle. Introducing our premium set of slides with Role Of Agile Management In Product Lifecycle. Elucidate the four stages and present information using this PPT slide. This is a completely adaptable PowerPoint template design that can be used to interpret topics like Introduction, Growth, Maturity, Decline. So download instantly and tailor it with your information.
-
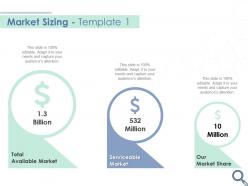 Market sizing template serviceable ppt powerpoint presentation visual aids show
Presenting this set of slides with name Market Sizing Template Serviceable Ppt Powerpoint Presentation Visual Aids Show. This is a three stage process. The stages in this process are Market Sizing, Template, Serviceable. This is a completely editable PowerPoint presentation and is available for immediate download. Download now and impress your audience.
-
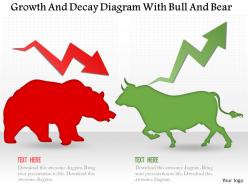 8655424 style concepts 1 decline 2 piece powerpoint presentation diagram infographic slide
We are proud to present our 0115 growth and decay diagram with bull and bear powerpoint template. This power point template slide has been designed with graphic of bull and bear. This PPT contains the concept of growth and decay. Use this PPT for business and marketing related presentations.
-
 88134502 style concepts 1 decline 3 piece powerpoint presentation diagram infographic slide
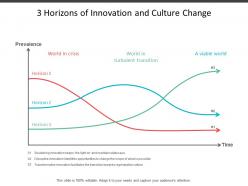
Introducing 3 Horizons of Innovation and Culture Change PPT image. This PowerPoint design is adaptable with all software’s operations and all Google Slides. These Presentation slides can also be simply exportable into PDF or JPG file schemes. These PPT images can be displayed in a larger screen ratio with an unaffected high resolution. All the aspects or features of these Presentation graphics like matter, pattern, context, intensity etc. can be manually manageable.
-
 Key disruptors of industrial success displayed via bell curve
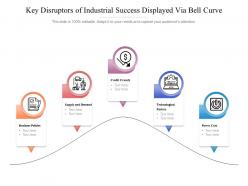
Presenting this set of slides with name Key Disruptors Of Industrial Success Displayed Via Bell Curve. This is a five stage process. The stages in this process are Business Policies, Supply And Demand, Credit Crunch, Technological Factors, Power Cuts. This is a completely editable PowerPoint presentation and is available for immediate download. Download now and impress your audience.
-
 3744669 style division donut 4 piece powerpoint presentation diagram infographic slide
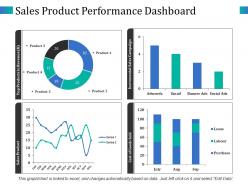
Highlighting sales product performance dashboard top products in revenue PowerPoint slide. Easy and convenient downloading by following simple steps. No concession with the quality, once opened on wide screen. Modify and personalize the presentation by including the company name and logo. Guidance for executing the changes has been provided for assistance. Useful for sales leaders, marketers, business professionals, analysts, strategists, students, teachers, etc. Compatible with Microsoft office software and the Google Slides. Available to be saved in jpg or pdf format.
-
 Analyzing product capabilities understanding our product lifecycle
Purpose of the following slide is to displays the lifecycle of the product as the provided graph displays, key stages of product lifecycle. These stages are, product development, introduction, growth , maturity and decline along with the total sales and profit the product has generated. Increase audience engagement and knowledge by dispensing information using Analyzing Product Capabilities Understanding Our Product Lifecycle. This template helps you present information on one stages. You can also present information on Innovators, Early Adopters, Early Maturity, Late Maturity, Laggards using this PPT design. This layout is completely editable so personaize it now to meet your audiences expectations.
-
 66702585 style concepts 1 growth 3 piece powerpoint presentation diagram infographic slide
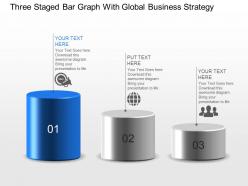
We are proud to present our three staged bar graph with global business strategy powerpoint template slide. Graphic of three staged bar graph has been used to craft this power point template diagram. This PPT diagram contains the concept of business strategy .Use this PPT diagram for business and management related presentations.
-
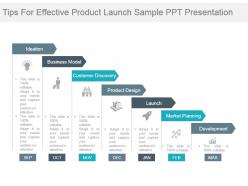 35403977 style concepts 1 decline 7 piece powerpoint presentation diagram infographic slide
Presenting tips for effective product launch sample ppt presentation. This is a tips for effective product launch sample ppt presentation. This is a seven stage process. The stages in this process are ideation, business model, customer discovery, product design, launch, market planning, development.
-
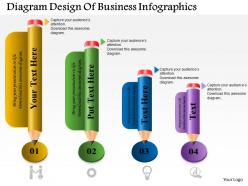 48181834 style concepts 1 decline 1 piece powerpoint presentation diagram infographic slide
We are proud to present our 0514 business consulting diagram design of business infographics powerpoint slide template. Proper Analysis Of The Marketing Strategies And Further Planning Can Be Carried Out Using This Infographic Design In An Effective Manner. Figures And Statistics Can Be Easily Added This Diagram To Mention The Data And The Information In An Expressive Manner.
-
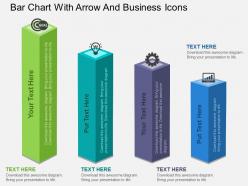 69884401 style concepts 1 decline 4 piece powerpoint presentation diagram infographic slide
We are proud to present our bar chart with arrow and business icons flat powerpoint design. Graphic of bar chart and arrows with business icons has been used to design this power point template diagram. This PPT diagram contains the concept of result analysis. Use this PPT diagram for business and marketing related presentations.
-
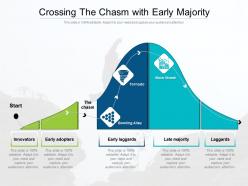 Crossing the chasm with early majority
Presenting this set of slides with name Crossing The Chasm With Early Majority. This is a five stage process. The stages in this process are Innovators, Late Majority, Laggards, Early Laggards, Early Adopters. This is a completely editable PowerPoint presentation and is available for immediate download. Download now and impress your audience.
-
 Business loss icon for decreasing profits
Introducing our premium set of slides with Business Loss Icon For Decreasing Profits. Ellicudate the one stage and present information using this PPT slide. This is a completely adaptable PowerPoint template design that can be used to interpret topics like Business Loss Icon For Decreasing Profits. So download instantly and tailor it with your information.
-
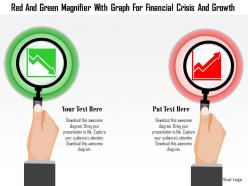 14116252 style concepts 1 decline 2 piece powerpoint presentation diagram template slide
We are proud to present our 0115 red and green magnifier with graph for financial crisis and growth powerpoint template. Graphic of red and green magnifier has been used to craft this power point template. This PPT contains the concept of analyzing the financial crisis and growth with the help of graph. This PPT can be used for business and finance related presentations.
-
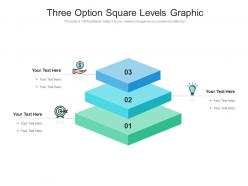 Three option square levels graphic
Presenting this set of slides with name Three Option Square Levels Graphic. This is a three stage process. The stage in this process are Three Option Square Levels Graphic. This is a completely editable PowerPoint presentation and is available for immediate download. Download now and impress your audience.
-
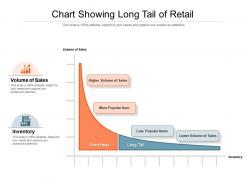 Chart showing long tail of retail
Presenting this set of slides with name Chart Showing Long Tail Of Retail. This is a four stage process. The stages in this process are Chart Showing Long Tail, Retail. This is a completely editable PowerPoint presentation and is available for immediate download. Download now and impress your audience.
-
 Trade promotion management process flow
Presenting this set of slides with name Trade Promotion Management Process Flow. This is a three stage process. The stages in this process are Fund And Forecast Management, Promotion Planning, Promotion Executive. This is a completely editable PowerPoint presentation and is available for immediate download. Download now and impress your audience.
-
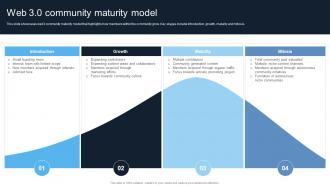 Introduction To Web 3 0 Era Web 3 0 Community Maturity Model BCT SS
This slide showcases web3 community maturity model that highlights how members within the community grow. Key stages include Introduction, growth, maturity and mitosis. Increase audience engagement and knowledge by dispensing information using Introduction To Web 3 0 Era Web 3 0 Community Maturity Model BCT SS. This template helps you present information on four stages. You can also present information on Community Maturity Model, Expanding Contributors, Community Generated Content, Autonomous Niche Communities using this PPT design. This layout is completely editable so personaize it now to meet your audiences expectations.
-
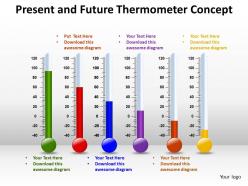 5348725 style concepts 1 decline 1 piece powerpoint presentation diagram infographic slide
This template is skillfully designed and is completely editable to suit all the needs and requirements of the user. The color of the font, its size, style, and all other elements can be customized according to the user's desire The text in the PPT placeholder can be replaced with the desired information making this template highly flexible and adaptable as well. This template is also compatible with various Microsoft versions and formats like Google Slides, JPG, PDF, etc so the user will face no issue in saving it in the format of his choice.
-
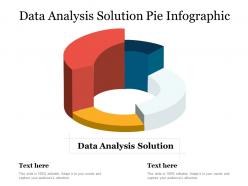 Data analysis solution pie infographic
Presenting this set of slides with name Data Analysis Solution Pie Infographic. This is a one stage process. The stages in this process are Data Analysis Solution Pie Infographic. This is a completely editable PowerPoint presentation and is available for immediate download. Download now and impress your audience.
-
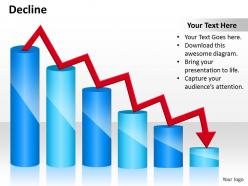 96366658 style concepts 1 decline 1 piece powerpoint presentation diagram infographic slide
This template is skillfully designed and is completely editable to suit all the needs and requirements of the user. The color of the font, its size, style, and all other elements can be customized according to the user's desire The text in the PPT placeholder can be replaced with the desired information making this template highly flexible and adaptable as well. This template is also compatible with various Microsoft versions and formats like Google Slides, JPG, PDF, etc so the user will face no issue in saving it in the format of his choice.
-
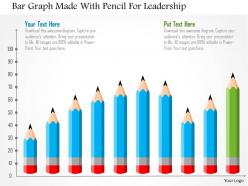 44081189 style concepts 1 decline 2 piece powerpoint presentation diagram infographic slide
We are proud to present our bar graph made with pencil for leadership flat powerpoint design. Graphic of bar graph and pencil has been used to design this power point template. This PPT diagram contains the concept of leadership. Use this PPT diagram for business and marketing related presentations.
-
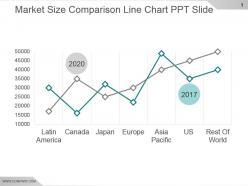 49647725 style concepts 1 decline 2 piece powerpoint presentation diagram infographic slide
Presenting market size comparison line chart ppt slide. This is a market size comparison line chart ppt slide. This is a two stage process. The stages in this process are latin america, canada, japan, europe, asia pacific, us, rest of world.
-
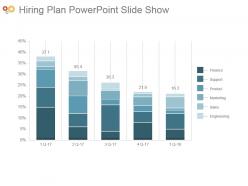 53127151 style concepts 1 decline 5 piece powerpoint presentation diagram infographic slide
Presenting hiring plan powerpoint slide show. Presenting hiring plan powerpoint slide show. Presenting hiring plan powerpoint slide show. This is a hiring plan powerpoint slide show. This is five stage process. The stages in this process are finance, support, product, marketing, sales, engineering.
-
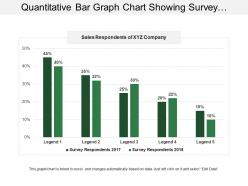 81268392 style concepts 1 decline 5 piece powerpoint presentation diagram infographic slide
Presenting this set of slides with name - Quantitative Bar Graph Chart Showing Survey Respondents. This is a five stage process. The stages in this process are Quantitative, Financial Analysis, Statistical Modelling.
-
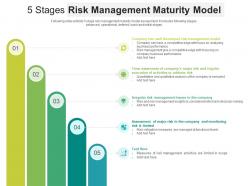 5 stage risk management maturity model
Following slide exhibits 5 stage risk management maturity model assessment. It includes following stages advanced, operational, defined, basic and initial stages. Presenting our set of slides with 5 Stage Risk Management Maturity Model. This exhibits information on five stages of the process. This is an easy-to-edit and innovatively designed PowerPoint template. So download immediately and highlight information on Operational, Awareness, Activities, Risk Management, Monitoring.
-
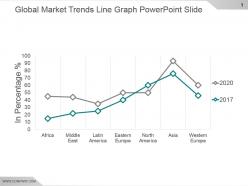 30006164 style concepts 1 decline 2 piece powerpoint presentation diagram infographic slide
Presenting global market trends line graph powerpoint slide. This is a global market trends line graph powerpoint slide. This is a two stage process. The stages in this process are africa, middle east, latin america, eastern europe, north america, asia, western europe.
-
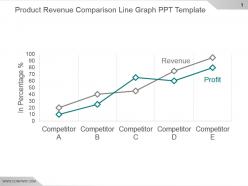 78154096 style concepts 1 decline 2 piece powerpoint presentation diagram infographic slide
Presenting product revenue comparison line graph ppt template. This is a product revenue comparison line graph ppt template. This is a two stage process. The stages in this process are revenue, profit, competitor.
-
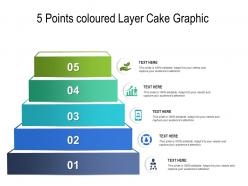 5 points coloured layer cake graphic
Presenting this set of slides with name 5 Points Coloured Layer Cake Graphic. This is a five stage process. The stages in this process are 5 Points Coloured Layer Cake Graphic. This is a completely editable PowerPoint presentation and is available for immediate download. Download now and impress your audience.
-
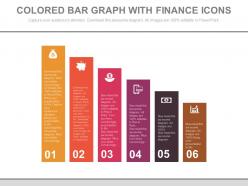 13455680 style essentials 2 financials 6 piece powerpoint presentation diagram infographic slide
Presenting six staged colored bar graph with finance icons powerpoint slides. This Power Point template diagram has been crafted with graphic of six staged colored bar graph and finance icons diagram. This PPT diagram contains the concept of financial data analysis representation. Use this PPT diagram for business and finance related presentations.
-
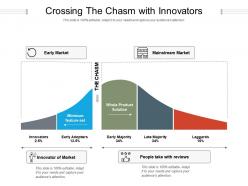 Crossing the chasm with innovators
Presenting this set of slides with name Crossing The Chasm With Innovators. This is a five stage process. The stages in this process are Market, Product, Innovator Of Market, Minimum, Feature Set, People Take With Reviews. This is a completely editable PowerPoint presentation and is available for immediate download. Download now and impress your audience.
-
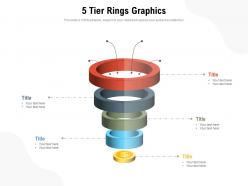 5 tier rings graphics
Presenting this set of slides with name 5 Tier Rings Graphics. This is a five stage process. The stages in this process are 5 Tier Rings Graphics. This is a completely editable PowerPoint presentation and is available for immediate download. Download now and impress your audience.
-
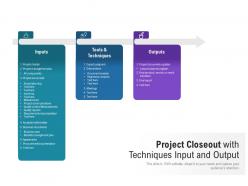 Project closeout with techniques input and output
Presenting this set of slides with name Project Closeout With Techniques Input And Output. This is a three stage process. The stages in this process are Inputs, Tools And Techniques, Outputs, Project Charter, Project Management Plan, Project Documents, Assumption Log, Business Case, Benefits Management Plan, Procurement Documentation, Expert Judgment, Data Analysis, Project Documents Updates, Regression Analysis, Document Analysis. This is a completely editable PowerPoint presentation and is available for immediate download. Download now and impress your audience.
-
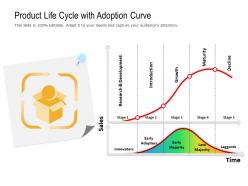 Product life cycle with adoption curve
Presenting this set of slides with name Product Life Cycle With Adoption Curve. This is a five stage process. The stages in this process are Growth, Maturity, Decline, Introduction, Research Development. This is a completely editable PowerPoint presentation and is available for immediate download. Download now and impress your audience.
-
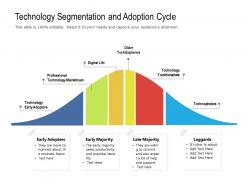 Technology segmentation and adoption cycle
Presenting this set of slides with name Technology Segmentation And Adoption Cycle. This is a six stage process. The stages in this process are Early Adopters, Early Majority, Technophobes, Late Majority, Laggards, Digital Life. This is a completely editable PowerPoint presentation and is available for immediate download. Download now and impress your audience.
-
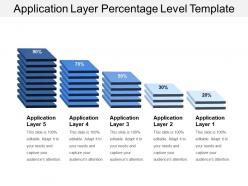 46197723 style concepts 1 decline 5 piece powerpoint presentation diagram infographic slide
Presenting this set of slides with name - Application Layer Percentage Level Template. This is a five stage process. The stages in this process are Application Layer, Session Layer, Osi Model.
-
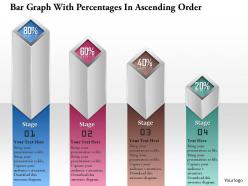 23106429 style concepts 1 decline 4 piece powerpoint presentation diagram infographic slide
We are proud to present our 0914 business plan bar graph with percentages in ascending order powerpoint template. This image slide displays bar graph with icons. This image slide may be used in your presentations to depict business planning process. Use this innovative image slide in business, marketing and social presentations. You may change color, size and orientation of any icon to your liking. This image slide will enhance the quality of your presentations.
-
 87159203 style concepts 1 decline 1 piece powerpoint presentation diagram infographic slide
This template is skillfully designed and is completely editable to suit all the needs and requirements of the user. The color of the font, its size, style, and all other elements can be customized according to the user's desire The text in the PPT placeholder can be replaced with the desired information making this template highly flexible and adaptable as well. This template is also compatible with various Microsoft versions and formats like Google Slides, JPG, PDF, etc so the user will face no issue in saving it in the format of his choice.
-
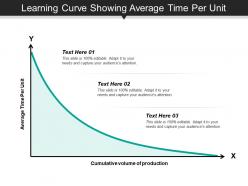 34808056 style concepts 1 decline 3 piece powerpoint presentation diagram infographic slide
Presenting this set of slides with name - Learning Curve Showing Average Time Per Unit. This is a three stage process. The stages in this process are Experience Curve, Learning Curve.
-
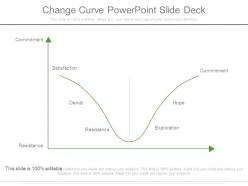 95569390 style concepts 1 decline 1 piece powerpoint presentation diagram infographic slide
Presenting change curve powerpoint slide deck. This is a change curve powerpoint slide deck. This is a one stage process. The stages in this process are commitment, resistance, satisfaction, denial, exploration, hope.
-
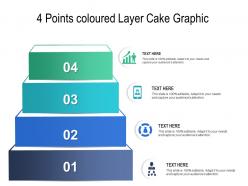 4 points coloured layer cake graphic
Presenting this set of slides with name 4 Points Coloured Layer Cake Graphic. This is a four stage process. The stages in this process are 4 Points Coloured Layer Cake Graphic. This is a completely editable PowerPoint presentation and is available for immediate download. Download now and impress your audience.
-
 Low Employee Productivity Rate Icon
Introducing our premium set of slides with Low Employee Productivity Rate Icon. Ellicudate the three stages and present information using this PPT slide. This is a completely adaptable PowerPoint template design that can be used to interpret topics like Low Employee, Productivity Rate. So download instantly and tailor it with your information.
-
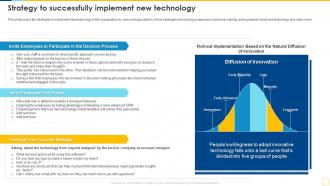 Technology Planning And Implementation Strategy To Successfully Implement New Technology
This slide covers the strategies to implement new technology in the organization by overcoming problems. Some strategies are involving employees in decision making, asking experts about new technology and many more. Increase audience engagement and knowledge by dispensing information using Technology Planning And Implementation Strategy To Successfully Implement New Technology. This template helps you present information on six stages. You can also present information on Technology Implementation, Decision Making Processes, Natural Diffusion Of Innovation using this PPT design. This layout is completely editable so personaize it now to meet your audiences expectations.
-
 99241066 style concepts 1 decline 5 piece powerpoint presentation diagram infographic slide
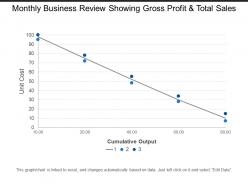
Presenting this set of slides with name - Monthly Business Review Showing Gross Profit And Total Sales. This is a five stage process. The stages in this process are Experience Curve, Learning Curve.
-
 Currency value decrease icon in stock market
Presenting this set of slides with name Currency Value Decrease Icon In Stock Market. This is a three stage process. The stages in this process are Stock Market, Investment, Multiple Shareholders. This is a completely editable PowerPoint presentation and is available for immediate download. Download now and impress your audience.
-
 20698593 style concepts 1 decline 1 piece powerpoint presentation diagram infographic slide
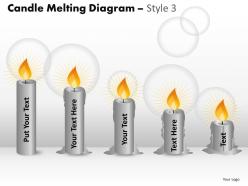
This template is skillfully designed and is completely editable to suit all the needs and requirements of the user. The color of the font, its size, style, and all other elements can be customized according to the user's desire The text in the PPT placeholder can be replaced with the desired information making this template highly flexible and adaptable as well. This template is also compatible with various Microsoft versions and formats like Google Slides, JPG, PDF, etc so the user will face no issue in saving it in the format of his choice.


