75337623 style concepts 1 growth 3 piece powerpoint presentation diagram infographic slide
Do you know why you need to use Sales Comparison Report Powerpoint Slide Design Ideas created by pros for your presentations? Because they understand the effects of colours and they use them to suit the purpose.
- Google Slides is a new FREE Presentation software from Google.
- All our content is 100% compatible with Google Slides.
- Just download our designs, and upload them to Google Slides and they will work automatically.
- Amaze your audience with SlideTeam and Google Slides.
-
Want Changes to This PPT Slide? Check out our Presentation Design Services
- WideScreen Aspect ratio is becoming a very popular format. When you download this product, the downloaded ZIP will contain this product in both standard and widescreen format.
-

- Some older products that we have may only be in standard format, but they can easily be converted to widescreen.
- To do this, please open the SlideTeam product in Powerpoint, and go to
- Design ( On the top bar) -> Page Setup -> and select "On-screen Show (16:9)” in the drop down for "Slides Sized for".
- The slide or theme will change to widescreen, and all graphics will adjust automatically. You can similarly convert our content to any other desired screen aspect ratio.
Compatible With Google Slides

Get This In WideScreen
You must be logged in to download this presentation.
PowerPoint presentation slides
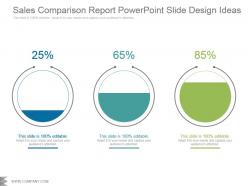
Presenting sales comparison report powerpoint slide design ideas. Presenting sales comparison report powerpoint slide design ideas. Presenting sales comparison report powerpoint slide design ideas. Presenting sales comparison report powerpoint slide design ideas. This is a sales comparison report powerpoint slide design ideas. This is a three stage process. The stages in this process are business, compare, strategy, marketing, management.
Content of this Powerpoint Presentation
Description:
The image is a PowerPoint slide titled "Sales Comparison Report PowerPoint Slide Design Ideas." It showcases three circular progress bars, each representing a percentage value: 25%, 65%, and 85%. These circular bars are likely used to display sales performance, goal completion, or another type of progress metric in a visual format. The colors blue, teal, and green may indicate different products, regions, or periods.
Use Cases:
This type of slide can be used in various industries for performance reporting and strategic presentations:
1. Retail:
Use: Displaying sales performance by product category.
Presenter: Sales Manager
Audience: Store Managers, Sales Teams
2. Financial Services:
Use: Showing completion rates of financial targets.
Presenter: Financial Analyst
Audience: Investment Team, Management
3. Real Estate:
Use: Comparing sales across different properties or regions.
Presenter: Real Estate Broker
Audience: Agents, Investors
4. Manufacturing:
Use: Illustrating production targets versus actual output.
Presenter: Operations Director
Audience: Factory Managers, Production Staff
5. Healthcare:
Use: Reporting patient services or treatment completion rates.
Presenter: Healthcare Administrator
Audience: Medical Staff, Department Heads
6. Education:
Use: Showing enrollment targets versus current enrollment figures.
Presenter: Admissions Officer
Audience: School Board, Administrative Staff
7. Technology:
Use: Visualizing software sales or subscription renewal rates.
Presenter: Product Manager
Audience: Marketing Team, Stakeholders
75337623 style concepts 1 growth 3 piece powerpoint presentation diagram infographic slide with all 5 slides:
Brighten the environment with our Sales Comparison Report Powerpoint Slide Design Ideas. Your brilliant views will heighten the mood.
-
Content of slide is easy to understand and edit.
-
Easily Understandable slides.


